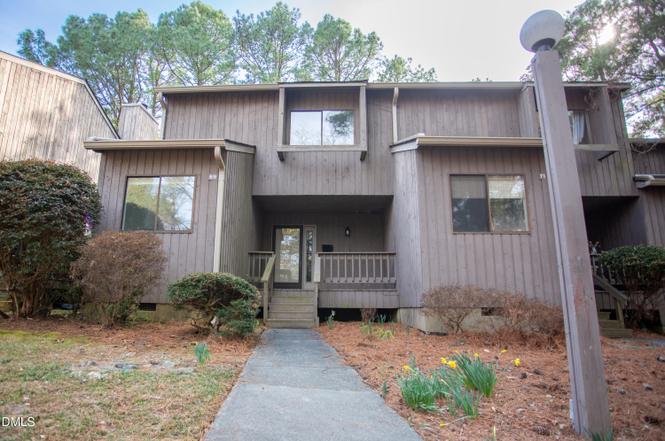
69 Fernwood Ln · Chapel Hill, NC
Flood risk 1/10 · Minimal
- FEMA flood zone
- X (unshaded)
- Chance of flooding over 30 yrs
- 0.0%
- Est. flood insurance / yr
- $507 – $1,088
Fire risk 2/10 · Minimal
- Est. fire insurance / yr
- $906 – $1,684
Heat risk 6/10 · Moderate
- Hot days now (above 105°F)
- 7 days/yr
- Hot days in 30 yrs
- 17 days/yr
Wind risk 6/10 · Moderate
- Chance of severe wind over 30 yrs
- 27.0%
Air-quality risk 2/10 · Minimal
- Unhealthy air days now
- 1 days/yr
- Unhealthy air days in 30 yrs
- 1 days/yr
Risk factors via First Street. Map © Google.
Why this score? — see what drove the D+ grade
The composite is a weighted blend of 9 inputs, each scored 0–100. Each bar is that input's sub-score; the figure is the points it added to the 100-point composite (weight × sub-score).
- ARV discount +15.0/15.0
- Cash flow +10.0/30.0
- Schools +5.4/10.0
- 1% rule +4.4/10.0
- Livability +4.2/5.0
- Rent growth +3.1/5.0
- DSCR +2.8/10.0
- Condition / age +2.5/5.0
- Appreciation +0.0/10.0
$295,000
🖨 Deal sheet 📄 Offer letter ✓ Due diligence
Listing remarks MLS
END UNIT TOWNHOUSE ON THE BUS LINE. PARQUET ENTRY HALL & DINING AREA. FIREPLACE IN LIVING ROOM. SKYLIGHTS IN KITCHEN, EATING AREA & STAIRWELL. PRIVATE VIEW FROM BACK DECK.
Key facts
- End unit townhome
- Clubhouse
- Pool
Tags
Property features AI
Finance
- Other: Living area reported as 1,558 (above-grade finished area)
- HOA & community: HOA: Village West HOA; Monthly HOA fee (listed) includes grounds and structure maintenance, pest control, and road maintenance; Community amenities include clubhouse, pool, tennis courts, basketball court, dog park, sidewalks, street lights, parking, recreation facilities, landscaping, and trash service
Exterior
- Parking: 2 open parking spaces in a parking lot with additional parking available; Private road access (asphalt) with private road maintenance agreement
- Security: Street lights in community
- Utilities: Public water; Public sewer; Electricity connected; Cable available; Sewer and water connected
- Home design: Townhouse end unit with one common wall; Two levels; Entry via front porch; R-3 zoning; Property listed as fixer condition
- Construction: Wood siding construction; Shingle roof; Crawl space foundation; Built as part of Building 2
- Exterior features: Front porch; Exterior lighting; Rain gutters; Outdoor storage; Community fenced outdoor pool; Partially wooded lot
Interior
- Kitchen: Dishwasher; Electric range with range hood; Refrigerator; Granite counters
- Bedrooms: 3 bedrooms (includes upper-level bedrooms)
- Flooring: Carpet; Laminate; Parquet; Tile; Combination flooring types
- Bathrooms: 1 full bathroom; 1 half bathroom
- Heating & cooling: Electric heating with forced air; Fireplace(s) provide additional heat; Central air conditioning; Ceiling fans
- Interior features: Bathtub-only bathroom; Separate shower; Built-in bookcases and storage; Granite countertops; Ceiling fans; Entrance foyer; High-speed internet; Sliding doors and storm door(s); Wood-burning fireplace in family room (1)
- Laundry & utility: Washer and dryer included; Laundry located in hall/upper-level laundry closet
Neighborhood map
What this means for you Summary
Snapshot
- This is a 3-bed/2.5-bath townhouse listed at $295k.
Deal economics
- At list price, monthly cash flow is $-181 ($-2k/yr) — negative.
- To cash-flow at today's rent, offer at most $263k (10.8% below list).
- To meet the 1% rule (rent ≥ 1% of price), the offer needs to be $276k (6.5% below list).
- Recommended offer: $263k (10.8% below list) — sets the bar for cash-flow.
- Cap rate 5.6% vs local median 1.8% in Chapel Hill — top-decile yield for the area; either an underpriced asset or a hidden risk that comps aren't pricing in. Stress-test before assuming the spread holds.
Location & tenants
- Location reads 84/100 on livability (#5 in NC, #742 nationally) — a professional / high-income tenant draw. Strengths: amenities A+, commute A+, employment A+; Watch: cost of living F.
- Chapel Hill-Carrboro City Schools (urban): math 60% / reading 66% proficiency, ranked #24 of 178 in NC (top 14%) — acceptable for families but not a draw, mixed tenant base, ~2y average lease.
- Zoned schools: Chapel Hill High (math 79% / reading 47%, grade B-, #177 of 535 statewide, top 33%, 1,597 students, 25% FRL) — zoned schools at 25% FRL track the district average.
- Market conditions: Rents rising (+2.5%/yr); 361 active listings in the ZIP; 13 comparable units currently listed for rent nearby; rentals leasing fast (median 14d on market — plan ~1-2 weeks tenant-placement turnaround); solid renter incomes; 375 units permitted in Orange County in 2024 (34 in 5+ unit buildings).
- This rent runs 31% of the median local income ($106k/yr) — at the standard rent-burdened threshold; future hikes will face affordability resistance.
Forward outlook
- Local home prices are declining (-3.0%/yr); year-one equity from $2k of loan paydown is wiped out by about $9k of value loss. Plan a longer hold.
- Orange County population projected at +28% by 2050 — long-run rental-demand tailwind backs the buy-and-hold thesis.
Negotiation context
- It's been on market 104 days — a 9% lower offer ($268k) is reasonable based on typical stale-listing flexibility.
- 10 sale attempts since 28y ago with the ask held roughly flat each time — persistent listings suggest the price (not the market) is what's stuck; bring a comps-based counter.
Risks & watch-outs
- Climate carrying-cost: major wind risk, 27% chance of damaging wind over 30y; extreme-heat days projected 7→17/yr by 2055 (HVAC capex compounding) — expect insurance premiums to compound above CPI over the hold.
Questions for the listing agent
- What do current leases actually rent for vs. the listed asking? Can we see a recent rent roll and the last 12 months of T-12 income?
- It's been on market 104 days. Have you received any prior offers? Is the seller open to a 11% concession, seller financing, or rate buy-down credit?
- Built in 1978 — when were the roof, HVAC, electrical panel, plumbing, and water heater last replaced?
- What does the HOA fee cover, when was the last increase, and are there any pending special assessments or reserve-fund shortfalls?
- Why hasn't it sold? Are there any deal-killer items the seller is aware of (foundation, flood, title, zoning, code violations)?
- Is there a deadline driving the sale (1031 exchange, divorce, estate, relocation)? That informs how much negotiation room exists.
- Schools are A-rated — typically a magnet for longer-tenancy family renters. What's the average tenant stay here, and is there a school-zone premium baked into asking?
- The area grade is low — what's the realistic commute time and amenity access for the typical tenant pool here? Any planned neighborhood developments (good or bad) we should know about?
- What's the average days-on-market for RENTAL listings here right now (not sales)? A rising rental-DOM trend means longer vacancies and softer asking-rent achievability than the comps imply.
- What's the recent tenant-quality profile in this submarket — average credit score on applications, eviction rate, late-payment / NSF rate, and stable-employment percentage? A property-management company in the area should have these aggregated.
- How much new for-sale + rental construction is in the pipeline within 1–3 miles? Heavy new supply typically softens prices + rents 12–24 months out; constrained supply supports both.
Investment metrics
- 1% rule
- 0.94% ✗
- Cap rate
- 5.56%
- Cash-on-cash
- -2.62%
- DSCR
- 0.88
- GRM
- 8.9
CMA / ARV
- ARV (on-the-fly)
- $473,394
- Comps found
- 12
Show comp detail 12 sales within ~0.75 mi
| Address | Dist | Beds/Ba | Sqft | Sold | Price | $/sf | Match |
|---|---|---|---|---|---|---|---|
| 19 Bluff Trl | 0.04mi | 3/2.0 | 1,551 (+1%) | 1mo | $317,000 | $204 | 94 |
| 216 Ridge Trl | 0.10mi | 3/3.0 | 1,574 (+2%) | 2mo | $315,000 | $200 | 88 |
| 201 Estes Dr Apt D | 0.31mi | 2/2.5 (-1) | 1,400 (-9%) | 2mo | $330,000 | $236 | 64 |
| 101 Thomas Ln Unit D-3 | 0.53mi | 4/2.0 (+1) | 1,600 (+4%) | 1mo | $430,000 | $269 | 61 |
| 107 Mulberry St Apt B | 0.33mi | 3/2.0 | 1,368 (-11%) | 7mo | $420,000 | $307 | 58 |
| 219 W Columbia Pl | 0.48mi | 2/2.5 (-1) | 1,655 (+7%) | 8mo | $455,000 | $275 | 54 |
| 805 N Columbia St | 0.50mi | 2/2.5 (-1) | 1,453 (-6%) | 11mo | $485,000 | $334 | 53 |
| 140 W Franklin St Unit 310 | 0.73mi | 2/2.5 (-1) | 1,484 (-4%) | 3mo | $880,000 | $593 | 52 |
| 601 W Rosemary St Unit 801 | 0.70mi | 2/2.0 (-1) | 1,471 (-5%) | 6mo | $975,000 | $663 | 48 |
| 620 Martin Luther King Jr. Blvd #302 | 0.64mi | 2/2.0 (-1) | 1,438 (-7%) | 9mo | $418,000 | $291 | 44 |
| 140 W Franklin St Unit 504 | 0.73mi | 2/2.5 (-1) | 1,366 (-11%) | 1mo | $1,080,000 | $791 | 41 |
| 140 W Franklin St Unit 807 | 0.73mi | 2/2.0 (-1) | 1,408 (-9%) | 14mo | $1,300,000 | $923 | 33 |
Match score weights: distance 35% · size 25% · config 20% · recency 20%. Top-matched comps best support the ARV.
Projected returns pro-forma
-3.0% appreciation · 2.54% rent growth · sell at horizon
- IRR
- -21.2%
- Equity multiple
- 0.27×
- Total profit
- $-60,338
- Equity at exit
- $43,985
- IRR
- -15.7%
- Equity multiple
- 0.13×
- Total profit
- $-71,549
- Equity at exit
- $25,506
Cash invested: $82,600 (down + closing). Projections, not guarantees.
Landlord ↔ Tenant lean methodology
- Overall (STATE)
- 85 Strongly Landlord-Friendly
- State North Carolina
- 85 Strongly Landlord-Friendly · R+3
- County
- — inherits STATE
- City
- — inherits STATE
ZIP-level market 27516
- Rents YoY
- 2.5%
- Active inventory
- 361
- Price-to-rent
- 8.9×
Monthly cashflow live
- Estimated rent
- $2,759 high interval (Pro) →
- Mortgage (P&I)
- −$1,547
- Tax from tax record
- −$381 /mo · $4,577/yr
- Insurance
- −$123
- HOA
- −$309
- Vacancy / Maint / Mgmt
- −$579
- Net cashflow
- $-181
Break-even live
UW: 25.0% down · 7.5% · 30yr · 1.5% tax · 5.0% vac · 8.0% maint · 8.0% mgmt
Financing live
Cash to close
- Down payment
- $73,750
- Closing costs
- $8,850
- Reserves months
- —
- Total cash needed
- —
Loan-product check · same deal, 3 products live
Conventional
25% down · 7.5% · 30yr
- Down + closing
- —
- Monthly P&I
- —
- Monthly cashflow
- —
- DSCR
- —
- Eligible?
- —
Personal DTI + credit; lowest rate.
DSCR
20% down · 8.5% · 30yr
- Down + closing
- —
- Monthly P&I
- —
- Monthly cashflow
- —
- DSCR
- —
- Eligible?
- —
No personal income docs; deal must DSCR.
Hard money
10% down · 12.0% · 12mo
- Down + closing
- —
- Monthly P&I
- —
- Monthly cashflow
- —
- DSCR
- —
- Eligible?
- —
Short-term bridge; refi at stabilization.
Rent comps 13 comps
| Address | Beds | Baths | Sqft | Rent | $/sqft | DOM | Units | Dist |
|---|---|---|---|---|---|---|---|---|
| 223 Jay St Chapel Hill, NC | 3.0 | 2.0 | 1484 | $2,349 | $1.58 | 23d | 1 | 0.08mi |
| 234 Jay St Chapel Hill, NC | 3.0 | 2.0 | 1200 | $3,800 | $3.17 | 13d | 1 | 0.09mi |
| 706 Sykes St Unit A Chapel Hill, NC | 4.0 | 2.0 | 1350 | $2,400 | $1.78 | 23d | 1 | 0.21mi |
| 505 N Greensboro St Unit A Carrboro, NC | 4.0 | 2.0 | 1232 | $2,000 | $1.62 | 23d | 1 | 0.48mi |
| 1104 N Greensboro St Unit 15 Carrboro, NC | 3.0 | 2.0 | 1079 | $1,700 | $1.58 | 13d | 1 | 0.57mi |
| 206 N Graham St Chapel Hill, NC | 3.0 | 2.0 | 1297 | $2,700 | $2.08 | 23d | 1 | 0.58mi |
| 500 W Rosemary St Unit 1300722P Chapel Hill, NC | 3.0 | 3.0 | 2066 | $7,933 | $3.84 | 13d | 1 | 0.62mi |
| 714 Bradley Rd Unit A Chapel Hill, NC | 2.0 | 1.0 | 1400 | $3,000 | $2.14 | 23d | 1 | 0.72mi |
| 111 Barclay Rd Chapel Hill, NC | 2.0 | 1.0 | 1138 | $1,850 | $1.63 | 13d | 1 | 0.92mi |
| 112 W Poplar Ave Carrboro, NC | 4.0 | 2.0 | 1744 | $3,200 | $1.83 | 13d | 1 | 0.94mi |
| 308 Laurel Ave Carrboro, NC | 4.0 | 3.5 | 1600 | $3,200 | $2.00 | 23d | 1 | 1.02mi |
| 1000 Martin Luther King Jr Blvd Chapel Hill, NC | 1.0–3.0 | 1.0–3.5 | 1221 | $4,595 | $3.76 | 13d | 268 | 1.25mi |
| 220 Elizabeth St Chapel Hill, NC | 2.0 | 2.5 | 1175 | $1,698 | $1.44 | 13d | 5 | 1.46mi |
HOA detail
- Monthly dues
- $309 · $3,708/yr
Listing history 48 events
-
2026-06-18days on market $295,000 Active 104 DOM
-
2026-06-17days on market $295,000 Active 103 DOM
-
2026-06-16days on market $295,000 Active 102 DOM
-
2026-06-15days on market $295,000 Active 101 DOM
-
2026-06-14days on market $295,000 Active 99 DOM
-
2026-06-13days on market $295,000 Active 98 DOM
-
2026-06-10days on market $295,000 Active 96 DOM
-
2026-06-09days on market $295,000 Active 95 DOM
-
2026-06-08days on market $295,000 Active 94 DOM
-
2026-06-07days on market $295,000 Active 93 DOM
-
2026-06-05days on market $295,000 Active 90 DOM
-
2026-06-03days on market $295,000 Active 89 DOM
-
2026-06-02days on market $295,000 Active 88 DOM
-
2026-06-01days on market $295,000 Active 87 DOM
-
2026-05-31days on market $295,000 Active 86 DOM
-
2026-05-30days on market $295,000 Active 85 DOM
-
2026-03-19price $295,000
-
2026-03-06$305,000 Active
-
2023-12-11price $117,000 183-char remark
Show marketing remark (183 chars)
END UNIT TOWNHOUSE ON THE BUS LINE. PARQUET ENTRY HALL & DINING AREA. FIREPLACE IN LIVING ROOM. SKYLIGHTS IN KITCHEN, EATING AREA & STAIRWELL. PRIVATE VIEW FROM BACK DECK.
-
2023-04-25soldstatus $327,000 Closed
-
2023-04-25soldstatus $327,000
-
2023-04-25soldstatus $327,000
-
2023-03-21historical Contingent
-
2023-03-13$339,000 Active
-
2023-03-13$339,000
-
2022-12-03historical
-
2022-11-17$330,000 Active
-
2016-10-24soldstatus $153,500 Closed
-
2016-10-24soldstatus $153,500
-
2016-10-24soldstatus $153,500
-
2016-10-12historical Contingent
-
2016-09-27price $159,500
-
2016-09-21$163,000 Active
-
2016-09-21$159,500
-
2009-06-03soldstatus $167,000
-
2009-06-03soldstatus $167,000
-
2009-06-03soldstatus $167,000
-
2009-03-26historical
-
2009-03-10$169,000
-
2009-03-10$169,000
-
1998-12-21soldstatus $115,000
-
1998-12-18soldstatus $115,000 183-char remark
Show marketing remark (183 chars)
END UNIT TOWNHOUSE ON THE BUS LINE. PARQUET ENTRY HALL & DINING AREA. FIREPLACE IN LIVING ROOM. SKYLIGHTS IN KITCHEN, EATING AREA & STAIRWELL. PRIVATE VIEW FROM BACK DECK.
-
1998-12-18price $129,500 183-char remark
Show marketing remark (183 chars)
END UNIT TOWNHOUSE ON THE BUS LINE. PARQUET ENTRY HALL & DINING AREA. FIREPLACE IN LIVING ROOM. SKYLIGHTS IN KITCHEN, EATING AREA & STAIRWELL. PRIVATE VIEW FROM BACK DECK.
-
1998-12-18soldstatus $115,000 183-char remark
Show marketing remark (183 chars)
END UNIT TOWNHOUSE ON THE BUS LINE. PARQUET ENTRY HALL & DINING AREA. FIREPLACE IN LIVING ROOM. SKYLIGHTS IN KITCHEN, EATING AREA & STAIRWELL. PRIVATE VIEW FROM BACK DECK.
-
1998-08-08$117,000 183-char remark
Show marketing remark (183 chars)
END UNIT TOWNHOUSE ON THE BUS LINE. PARQUET ENTRY HALL & DINING AREA. FIREPLACE IN LIVING ROOM. SKYLIGHTS IN KITCHEN, EATING AREA & STAIRWELL. PRIVATE VIEW FROM BACK DECK.
-
1998-08-08$117,000 183-char remark
Show marketing remark (183 chars)
END UNIT TOWNHOUSE ON THE BUS LINE. PARQUET ENTRY HALL & DINING AREA. FIREPLACE IN LIVING ROOM. SKYLIGHTS IN KITCHEN, EATING AREA & STAIRWELL. PRIVATE VIEW FROM BACK DECK.
-
1996-10-31soldstatus $111,000
-
1990-06-25soldstatus $76,000
ⓘ Source: listings_history table (triggers on properties + properties_extension) + one-shot
backfill from property_details.listing_events for pre-trigger history.
Tax reassessment forecast NC · Resets to sale price
- Current annual tax
- $4,577 · $381/mo
- Projected year-2 tax
- $4,577 · $381/mo
- Expected delta
- $0/yr ($0/mo · 0.0%)
ⓘ Screening estimate from a state-policy table — verify with the county assessor before closing.
Climate risk First Street
- Flood 1/10 Low FEMA zone X (unshaded) · 0% chance over 30 yrs
- Wildfire 2/10 Low
- Heat 6/10 Major 7 d/yr ≥105°F today · 17 d/yr by 30 yrs out
- Wind 6/10 Major 27% chance of damaging wind over 30 yrs
- Air quality 2/10 Low 1 unhealthy d/yr today · 1 by 30 yrs out
Nearby sold comps map
Loading sold comps map…
Walkable amenities ~0.75 mi
Loading nearby amenities…
Taxation est. · year 1
- Rental income
- $33,110
- − Mortgage interest
- −$16,525
- − Property taxes
- −$4,577
- − Insurance
- −$1,475
- − Repairs & maintenance
- −$2,649
- − Management
- −$2,649
- − HOA
- −$3,708
- − Depreciation
- −$8,582
- Taxable loss
- −$7,054
- Est. tax savings @ 24.0%
- +$1,693
- After-tax cash flow
- $-474/yr
For passive investors: Depreciation is non-cash, so a rental often shows a tax loss while cash-flowing — sheltering income. Rental losses are passive: they offset passive income freely, and up to $25,000/yr can offset ordinary (W-2) income if you actively participate and your MAGI is under $100k (phasing out to $0 by $150k); unused losses carry forward. On sale, claimed depreciation is recaptured at up to 25%, and gains may owe capital-gains tax (a 1031 exchange can defer both). Figures are a year-1 estimate at your 24.0% rate — not tax advice; consult a CPA.
Schools (NCES district)
- District
- Chapel Hill-Carrboro City Schools
- NCES district ID
- 3700720
- Math proficiency
- 60% ▼ -4.00%
- Reading proficiency
- 66% ▼ -1.00%
- Median HH income
- $57,687
- Composite
- 54.28/100
- National rank
- #1370
- State rank
- #24 of 178 in NC
Livability — Chapel Hill
- Score
- 84/100
- State rank
- #5
- US rank
- #742
Category grades
Schools grade is shown separately in the Schools card above.
Census & demographics
- Census place
- Chapel Hill, NC
- County
- Orange County · 151,666 people
- City population
- 62,515
- Metro
- Durham-Chapel Hill, NC
- Population (ZIP)
- 47,358
- Household income
- $106,353
- Rent vs Own
- Severe rent burden
- 1783.0
Population outlook (Orange County) Hauer SSP2
- Today (2025)
- 158,781 people
- By 2030
- 168,367 · +6.0%
- By 2040
- 186,192 · +17.3%
- By 2050
- 203,801 · +28.4%
- By 2075
- 249,160 · +56.9%
- By 2100
- 285,614 · +79.9%
Race, ethnicity, and origin ACS 2023
- Neighborhood character
- Predominantly White (69%)
- Race & ethnicity
- White 69% Asian 10% Black 9% Hispanic / Latino 7% Two or more races 7%
- Hispanic origin (detail)
- Mexican 3%
- Common ancestry
- Slovak 4% Romanian 3% Italian 2%
- Foreign-born
- 12% · Canada, China, South Korea
- Languages at home
- 85% English-only · Spanish 5% Chinese 3% Other Indo-European 2%
Political lean MEDSL · Orange
- 2024 margin
- Solid D (+51.1) · D 74.9% · R 23.8% · Other 1.4%
- 2008→2024 swing
- +6.3pp toward D · 2008: 44.8pp · 2024: 51.1pp
- All cycles
- 2024: D+51.1 2020: D+51.1 2016: D+51.0 2012: D+42.2 2008: D+44.8
Not yet ingested
- Civics
- —
Market trends
- HPI YoY
- ▼ -360.82%
- Current HPI
- 222.7543
- Rent YoY
- ▲ 2.54%
- Metro
- Durham-Chapel Hill, NC
- State GDP YoY
- ▲ 3.28%
- F500 in state
- 26
Industry mix (Fortune 500 HQ in NC)
| Industry | F500 HQs | Revenue |
|---|---|---|
| Financial Services | 2 | $213B |
|
||
| Retail | 2 | $95B |
|
||
| Industrial Conglomerate | 1 | $38B |
|
||
| Metals / Steel | 1 | $35B |
|
||
| Utilities | 1 | $30B |
|
||
| Industrial Machinery | 1 | $19B |
|
||
Price history
+288.2% since first listed32 events — show timeline
- 2026-03-19 Price Changed $295,000 TMLS
- 2026-03-06 Listed $305,000 TMLS
- 2023-12-11 Price Changed $117,000 TMLS
- 2023-04-25 Sold (Public Records) $327,000 Public Records
- 2023-04-25 Sold (MLS) $327,000 AMLSNC
- 2023-04-25 Sold (MLS) $327,000 TMLS
- 2023-03-21 Contingent — TMLS
- 2023-03-13 Listed $339,000 AMLSNC
- 2023-03-13 Listed $339,000 TMLS
- 2022-12-03 Listing Removed — TMLS
- 2022-11-17 Listed $330,000 TMLS
- 2016-10-24 Sold (Public Records) $153,500 Public Records
- 2016-10-24 Sold (MLS) $153,500 AMLSNC
- 2016-10-24 Sold (MLS) $153,500 TMLS
- 2016-10-12 Contingent — TMLS
- 2016-09-27 Price Changed $159,500 TMLS
- 2016-09-21 Listed $163,000 TMLS
- 2016-09-21 Listed $159,500 AMLSNC
- 2009-06-03 Sold (Public Records) $167,000 Public Records
- 2009-06-03 Sold (MLS) $167,000 AMLSNC
- 2009-06-03 Sold (MLS) $167,000 TMLS
- 2009-03-26 Listing Removed — TMLS
- 2009-03-10 Listed $169,000 AMLSNC
- 2009-03-10 Listed $169,000 TMLS
- 1998-12-21 Sold (Public Records) $115,000 Public Records
- 1998-12-18 Sold (MLS) $115,000 AMLSNC
- 1998-12-18 Price Changed $129,500 TMLS
- 1998-12-18 Sold (MLS) $115,000 TMLS
- 1998-08-08 Listed $117,000 AMLSNC
- 1998-08-08 Listed $117,000 TMLS
- 1996-10-31 Sold (Public Records) $111,000 Public Records
- 1990-06-25 Sold (Public Records) $76,000 Public Records
Property tax history
+3.5%/yrLatest (2025): $4,577 · +17.8% YoY. Source: county tax records.
Cash-flow waterfall
monthlySold comps — $/sqft
last 12 mo · ≤1 miLoading sold comps…