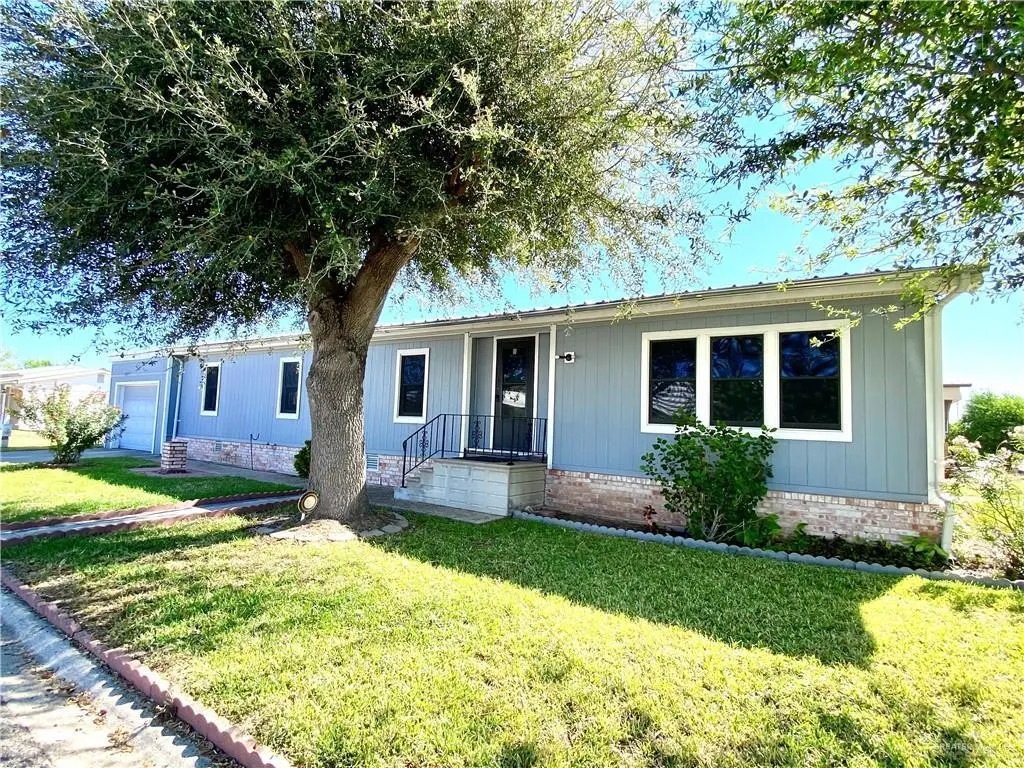
218 Bundle Wagon Dr · Mission, TX
Flood risk 1/10 · Minimal
- FEMA flood zone
- X
- Chance of flooding over 30 yrs
- 0.0%
- Est. flood insurance / yr
- $507 – $1,088
Fire risk 1/10 · Minimal
- Est. fire insurance / yr
- $1,222 – $2,270
Heat risk 8/10 · Major
- Hot days now (above 111°F)
- 6 days/yr
- Hot days in 30 yrs
- 18 days/yr
Wind risk 8/10 · Major
- Chance of severe wind over 30 yrs
- 94.0%
Air-quality risk 2/10 · Minimal
- Unhealthy air days now
- 1 days/yr
- Unhealthy air days in 30 yrs
- 2 days/yr
Risk factors via First Street. Map © Google.
Why this score? — see what drove the C+ grade
The composite is a weighted blend of 9 inputs, each scored 0–100. Each bar is that input's sub-score; the figure is the points it added to the 100-point composite (weight × sub-score).
- Cash flow +26.5/30.0
- DSCR +9.0/10.0
- 1% rule +8.3/10.0
- ARV discount +7.5/15.0
- Livability +3.8/5.0
- Rent growth +2.5/5.0
- Condition / age +2.5/5.0
- Schools +1.7/10.0
- Appreciation +0.0/10.0
$119,900
🖨 Deal sheet 📄 Offer letter ✓ Due diligence
Listing remarks MLS
Discover the perfect place to call home in the desirable 55+ community of Wagon City South! This charming 3-bedroom, 2-bath home sits on an oversized corner lot, offering comfort and convenience. Inside, enjoy a spacious living room filled with natural light, plus two dining areas ideal for everyday living. The kitchen features tiled countertops, ample cabinet space, a pantry, and updated appliances from 2021. A built-in hutch adds character and functionality. The Texas room is perfect for a home office or craft space and includes a new window A/C unit. The accessible primary suite offers a granite vanity and roll-in shower. Additional highlights include an attached one-car garage, workshop, fenced backyard, and mature trees. Recent upgrades include a new roof and siding in 2023, providing added peace of mind. This move-in-ready home comes fully furnished, making your transition seamless. Don’t miss this opportunity—schedule your private showing today!
Key facts
- Oversized corner lot
- Updated appliances
- Two dining areas
Tags
Neighborhood map
What this means for you Summary
Snapshot
- This is a 2-bed/1.0-bath manufactured listed at $120k.
Deal economics
- At list price, monthly cash flow is $316 ($4k/yr) — positive.
- The deal already cash-flows at list — no discount required.
- Meets the 1% rule at list price ($2k rent vs $120k).
- Recommended offer: $113k (6.0% below list) — sets the bar for market timing.
- Cap rate 9.5% vs local median 3.5% in Mission — top-decile yield for the area; either an underpriced asset or a hidden risk that comps aren't pricing in. Stress-test before assuming the spread holds.
Location & tenants
- Location reads 75/100 on livability (#148 in TX, #4,155 nationally) — a middle-class / working-renter tenant base. Strengths: cost of living A+, housing A+, health & safety A+; Watch: schools C-, amenities F, commute F.
- Mission CISD (urban): math 15% / reading 28% proficiency, ranked #775 of 826 in TX (top 94%) — low school quality limits family demand, transient renter base, plan for 1-2y turnover; 78% free/reduced lunch — lower-income household profile, screen leases tightly.
- Market conditions: 474 active listings in the ZIP; 15 comparable units currently listed for rent nearby; rentals lingering (median 44d on market — plan ~5-8 weeks vacancy on turnover, expect pricing pressure); 53% of comp listings sitting > 30 days — soft ceiling on asking rent; 7,378 units permitted in Hidalgo County in 2024 (641 in 5+ unit buildings).
- This rent runs 37% of the median local income ($52k/yr) — at the standard rent-burdened threshold; future hikes will face affordability resistance.
Forward outlook
- Local home prices are declining (-3.0%/yr); year-one equity from $829 of loan paydown is wiped out by about $4k of value loss. Plan a longer hold.
- Hidalgo County population projected at +28% by 2050 — long-run rental-demand tailwind backs the buy-and-hold thesis.
- At projected returns (-3.0% appreciation + 3.0% rent growth), your $34k cash investment doubles in ~10 years — after that, you're playing with house money.
Negotiation context
- It's been on market 90 days — a 6% lower offer ($113k) is reasonable based on typical stale-listing flexibility.
- 6 sale attempts since 5y ago with the ask held roughly flat each time — persistent listings suggest the price (not the market) is what's stuck; bring a comps-based counter.
Risks & watch-outs
- Climate carrying-cost: severe wind risk, 94% chance of damaging wind over 30y; extreme-heat days projected 6→18/yr by 2055 (HVAC capex compounding) — expect insurance premiums to compound above CPI over the hold.
Questions for the listing agent
- It's been on market 90 days. Have you received any prior offers? Is the seller open to a 6% concession, seller financing, or rate buy-down credit?
- Built in 1977 — when were the roof, HVAC, electrical panel, plumbing, and water heater last replaced?
- What does the HOA fee cover, when was the last increase, and are there any pending special assessments or reserve-fund shortfalls?
- Why hasn't it sold? Are there any deal-killer items the seller is aware of (foundation, flood, title, zoning, code violations)?
- Is there a deadline driving the sale (1031 exchange, divorce, estate, relocation)? That informs how much negotiation room exists.
- What's the average days-on-market for RENTAL listings here right now (not sales)? A rising rental-DOM trend means longer vacancies and softer asking-rent achievability than the comps imply.
- What's the recent tenant-quality profile in this submarket — average credit score on applications, eviction rate, late-payment / NSF rate, and stable-employment percentage? A property-management company in the area should have these aggregated.
- How much new for-sale + rental construction is in the pipeline within 1–3 miles? Heavy new supply typically softens prices + rents 12–24 months out; constrained supply supports both.
Investment metrics
- 1% rule
- 1.33% ✓
- Cap rate
- 9.46%
- Cash-on-cash
- 11.31%
- DSCR
- 1.50
- GRM
- 6.3
CMA / ARV
- ARV (median comp)
- $119,900
- List price
- $119,900
- Delta
- —
- Verdict
- FAIR
- Comps
- 7 within 1.0 mi
Show comp detail 4 sales within ~0.75 mi
| Address | Dist | Beds/Ba | Sqft | Sold | Price | $/sf | Match |
|---|---|---|---|---|---|---|---|
| 209 Buckboard Dr | 0.17mi | 2/2.0 | 1,568 (-3%) | 3mo | $85,000 | $54 | 81 |
| 213 Buckboard Dr | 0.17mi | 3/2.0 (+1) | 1,530 (-5%) | 2mo | $139,900 | $91 | 73 |
| 112 Buckboard Dr | 0.23mi | 2/2.0 | 1,456 (-10%) | 0mo | $119,900 | $82 | 69 |
| 108 Covered Wagon Dr | 0.16mi | 3/2.0 (+1) | 1,656 (+3%) | 14mo | $99,000 | $60 | 67 |
Match score weights: distance 35% · size 25% · config 20% · recency 20%. Top-matched comps best support the ARV.
Projected returns pro-forma
-3.0% appreciation · 3.0% rent growth · sell at horizon
- IRR
- 0.6%
- Equity multiple
- 1.02×
- Total profit
- $817
- Equity at exit
- $17,877
- IRR
- 10.3%
- Equity multiple
- 1.81×
- Total profit
- $27,045
- Equity at exit
- $10,367
Cash invested: $33,572 (down + closing). Projections, not guarantees.
Landlord ↔ Tenant lean methodology
- Overall (STATE)
- 87 Strongly Landlord-Friendly
- State Texas
- 87 Strongly Landlord-Friendly · R+5
- County
- — inherits STATE
- City
- — inherits STATE
ZIP-level market 78574
- Home prices YoY
- -16.1%
- Active inventory
- 474
- Price-to-rent
- 6.3×
Monthly cashflow live
- Estimated rent
- $1,596 high interval (Pro) →
- Mortgage (P&I)
- −$629
- Tax from tax record
- −$233 /mo · $2,794/yr
- Insurance
- −$50
- HOA
- −$33
- Vacancy / Maint / Mgmt
- −$335
- Net cashflow
- $316
Break-even live
UW: 25.0% down · 7.5% · 30yr · 1.5% tax · 5.0% vac · 8.0% maint · 8.0% mgmt
Financing live
Cash to close
- Down payment
- $29,975
- Closing costs
- $3,597
- Reserves months
- —
- Total cash needed
- —
Loan-product check · same deal, 3 products live
Conventional
25% down · 7.5% · 30yr
- Down + closing
- —
- Monthly P&I
- —
- Monthly cashflow
- —
- DSCR
- —
- Eligible?
- —
Personal DTI + credit; lowest rate.
DSCR
20% down · 8.5% · 30yr
- Down + closing
- —
- Monthly P&I
- —
- Monthly cashflow
- —
- DSCR
- —
- Eligible?
- —
No personal income docs; deal must DSCR.
Hard money
10% down · 12.0% · 12mo
- Down + closing
- —
- Monthly P&I
- —
- Monthly cashflow
- —
- DSCR
- —
- Eligible?
- —
Short-term bridge; refi at stabilization.
Rent comps 15 comps
| Address | Beds | Baths | Sqft | Rent | $/sqft | DOM | Units | Dist |
|---|---|---|---|---|---|---|---|---|
| 702 W 25th St Mission, TX | 3.0 | 2.0 | 1375 | $1,650 | $1.20 | 19d | 1 | 0.33mi |
| 2002 Thornton St Mission, TX | 3.0 | 2.0 | 1374 | $1,300 | $0.95 | 44d | 1 | 0.53mi |
| 607 Alameda Dr Mission, TX | 3.0 | 2.5 | 1731 | $2,200 | $1.27 | 44d | 1 | 0.70mi |
| 3209 Black Oak Ln Mission, TX | 3.0 | 2.5 | 1672 | $1,700 | $1.02 | 14d | 1 | 0.83mi |
| 221 W 14th St Mission, TX | 3.0 | 2.0 | 1290 | $1,100 | $0.85 | 44d | 1 | 0.94mi |
| 1400 N Dunlap Ave Mission, TX | 2.0 | 1.0 | 1068 | $800 | $0.75 | 19d | 1 | 0.96mi |
| 3401 N Mayberry Rd Mission, TX | 3.0 | 2.0 | 1150 | $961 | $0.84 | 44d | 1 | 1.12mi |
| 1827 Highland Park Ave Unit 1 Mission, TX | 2.0 | 2.0 | 1300 | $1,200 | $0.92 | 44d | 1 | 1.12mi |
| 1801 Highland Park Ave Mission, TX | 2.0 | 2.0 | 1173 | $1,500 | $1.28 | 19d | 1 | 1.17mi |
| 1707 Highland Park Ave Unit 4-B Mission, TX | 2.0 | 2.0 | 1336 | $1,200 | $0.90 | 14d | 1 | 1.17mi |
| 1006 Fairway Dr Mission, TX | 2.0 | 2.0 | 1072 | $1,100 | $1.03 | 44d | 1 | 1.23mi |
| 2903 Estevan St #4 Mission, TX | 3.0 | 2.0 | 1056 | $1,399 | $1.32 | 19d | 1 | 1.27mi |
| 2216 Robyn Ln Mission, TX | 3.0 | 3.0 | 2033 | $2,000 | $0.98 | 21d | 1 | 1.30mi |
| 3006 Gabriel St Mission, TX | 3.0 | 2.0 | 1433 | $1,600 | $1.12 | 44d | 1 | 1.33mi |
| 3102 Gabriel St Mission, TX | 3.0 | 2.0 | 1370 | $1,800 | $1.31 | 44d | 1 | 1.34mi |
HOA detail
- Monthly dues
- $33 · $396/yr
Listing history 28 events
-
2026-06-18days on market $119,900 Active 90 DOM
-
2026-06-17days on market $119,900 Active 89 DOM
-
2026-06-16days on market $119,900 Active 88 DOM
-
2026-06-15days on market $119,900 Active 87 DOM
-
2026-06-14days on market $119,900 Active 85 DOM
-
2026-06-10days on market $119,900 Active 82 DOM
-
2026-06-09days on market $119,900 Active 81 DOM
-
2026-06-08days on market $119,900 Active 80 DOM
-
2026-06-07days on market $119,900 Active 79 DOM
-
2026-06-03days on market $119,900 Active 75 DOM
-
2026-06-02days on market $119,900 Active 74 DOM
-
2026-06-01days on market $119,900 Active 73 DOM
-
2026-05-31days on market $119,900 Active 72 DOM
-
2026-05-31days on market $119,900 Active 71 DOM
-
2026-03-20$119,900 Active 978-char remark
Show marketing remark (978 chars)
Discover the perfect place to call home in the desirable 55+ community of Wagon City South! This charming 3-bedroom, 2-bath home sits on an oversized corner lot, offering comfort and convenience. Inside, enjoy a spacious living room filled with natural light, plus two dining areas ideal for everyday living. The kitchen features tiled countertops, ample cabinet space, a pantry, and updated appliances from 2021. A built-in hutch adds character and functionality. The Texas room is perfect for a home office or craft space and includes a new window A/C unit. The accessible primary suite offers a granite vanity and roll-in shower. Additional highlights include an attached one-car garage, workshop, fenced backyard, and mature trees. Recent upgrades include a new roof and siding in 2023, providing added peace of mind. This move-in-ready home comes fully furnished, making your transition seamless. Don’t miss this opportunity—schedule your private showing today!
-
2024-09-12$129,900 Active
-
2024-02-04price $117,900
-
2023-12-21status Active
-
2023-12-18status Pending
-
2023-12-13historical Option
-
2023-12-04$120,000 Active
-
2021-05-17soldstatus Sold
-
2021-04-21status Pending
-
2021-03-31status Active
-
2021-03-16historical Option
-
2021-03-03price $64,900
-
2021-01-19$69,900 Active
-
2007-01-26soldstatus
ⓘ Source: listings_history table (triggers on properties + properties_extension) + one-shot
backfill from property_details.listing_events for pre-trigger history.
Tax reassessment forecast TX · Resets to sale price
- Current annual tax
- $2,794 · $233/mo
- Projected year-2 tax
- $2,794 · $233/mo
- Expected delta
- $0/yr ($0/mo · 0.0%)
ⓘ Screening estimate from a state-policy table — verify with the county assessor before closing.
Climate risk First Street
- Flood 1/10 Low FEMA zone X · 0% chance over 30 yrs
- Wildfire 1/10 Low
- Heat 8/10 Severe 6 d/yr ≥111°F today · 18 d/yr by 30 yrs out
- Wind 8/10 Severe 94% chance of damaging wind over 30 yrs
- Air quality 2/10 Low 1 unhealthy d/yr today · 2 by 30 yrs out
Nearby sold comps map
Loading sold comps map…
Walkable amenities ~0.75 mi
Loading nearby amenities…
Taxation est. · year 1
- Rental income
- $19,153
- − Mortgage interest
- −$6,716
- − Property taxes
- −$2,794
- − Insurance
- −$600
- − Repairs & maintenance
- −$1,532
- − Management
- −$1,532
- − HOA
- −$396
- − Depreciation
- −$3,488
- Taxable income
- $2,095
- Est. tax owed @ 24.0%
- −$503
- After-tax cash flow
- $3,294/yr
For passive investors: Depreciation is non-cash, so a rental often shows a tax loss while cash-flowing — sheltering income. Rental losses are passive: they offset passive income freely, and up to $25,000/yr can offset ordinary (W-2) income if you actively participate and your MAGI is under $100k (phasing out to $0 by $150k); unused losses carry forward. On sale, claimed depreciation is recaptured at up to 25%, and gains may owe capital-gains tax (a 1031 exchange can defer both). Figures are a year-1 estimate at your 24.0% rate — not tax advice; consult a CPA.
Schools (NCES district)
- District
- Mission CISD
- NCES district ID
- 4831040
- Math proficiency
- 15% ▼ -35.00%
- Reading proficiency
- 28% ▼ -15.00%
- Median HH income
- $32,855
- Composite
- 17.47/100
- National rank
- #9061
- State rank
- #775 of 826 in TX
Livability — Mission
- Score
- 75/100
- State rank
- #148
- US rank
- #4155
Category grades
Schools grade is shown separately in the Schools card above.
Census & demographics
- Census place
- Mission, TX
- County
- Hidalgo County · 623,128 people
- City population
- 78,024
- Metro
- McAllen-Edinburg-Mission, TX
- Population (ZIP)
- 62,456
- Household income
- $52,393
- Rent vs Own
- Severe rent burden
- 803.0
Population outlook (Hidalgo County) Hauer SSP2
- Today (2025)
- 955,232 people
- By 2030
- 1,009,774 · +5.7%
- By 2040
- 1,120,332 · +17.3%
- By 2050
- 1,225,036 · +28.2%
- By 2075
- 1,439,189 · +50.7%
- By 2100
- 1,533,429 · +60.5%
Race, ethnicity, and origin ACS 2023
- Neighborhood character
- Predominantly Hispanic (97%)
- Race & ethnicity
- Hispanic / Latino 97% Two or more races 62% White 2%
- Hispanic origin (detail)
- Mexican 93%
- Foreign-born
- 33% · Canada
- Languages at home
- 12% English-only · Spanish 87%
Political lean MEDSL · Hidalgo
- 2024 margin
- Toss-up / Even · D 48.1% · R 51.0%
- 2008→2024 swing
- -41.6pp toward R · 2008: 38.7pp · 2024: -2.9pp
- All cycles
- 2024: R+2.9 2020: D+17.1 2016: D+40.5 2012: D+41.8 2008: D+38.7
Not yet ingested
- Civics
- —
Market trends
- HPI YoY
- ▼ -44.13%
- Current HPI
- 230.3323
- Rent YoY
- —
- Metro
- McAllen-Edinburg-Mission, TX
- State GDP YoY
- ▲ 3.95%
- F500 in state
- 110
Industry mix (Fortune 500 HQ in TX)
| Industry | F500 HQs | Revenue |
|---|---|---|
| Energy | 16 | $1,198B |
|
||
| Technology | 5 | $198B |
|
||
| Engineering / Construction | 4 | $72B |
|
||
| Energy Services | 3 | $60B |
|
||
| Utilities | 3 | $41B |
|
||
| Healthcare | 2 | $330B |
|
||
Price history
+71.5% since first listed14 events — show timeline
- 2026-03-20 Listed $119,900 MCALLENMLS
- 2024-09-12 Listed $129,900 MCALLENMLS
- 2024-02-04 Price Changed $117,900 MCALLENMLS
- 2023-12-21 Relisted — MCALLENMLS
- 2023-12-18 Pending — MCALLENMLS
- 2023-12-13 Contingent — MCALLENMLS
- 2023-12-04 Listed $120,000 MCALLENMLS
- 2021-05-17 Sold (MLS) — MCALLENMLS
- 2021-04-21 Pending — MCALLENMLS
- 2021-03-31 Relisted — MCALLENMLS
- 2021-03-16 Contingent — MCALLENMLS
- 2021-03-03 Price Changed $64,900 MCALLENMLS
- 2021-01-19 Listed $69,900 MCALLENMLS
- 2007-01-26 Sold (Public Records) — Public Records
Property tax history
+8.1%/yrLatest (2025): $2,794 · +20.0% YoY. Source: county tax records.
Cash-flow waterfall
monthlySold comps — $/sqft
last 12 mo · ≤1 miLoading sold comps…