2284 Yew St Unit K3 · Bellingham, WA
Flood risk 1/10 · Minimal
- FEMA flood zone
- X (unshaded)
- Chance of flooding over 30 yrs
- 0.0%
- Est. flood insurance / yr
- $507 – $1,088
Fire risk 4/10 · Minor
- Est. fire insurance / yr
- $604 – $1,122
Heat risk 1/10 · Minimal
- Hot days now (above 83°F)
- 6 days/yr
- Hot days in 30 yrs
- 13 days/yr
Wind risk 1/10 · Minimal
- Chance of severe wind over 30 yrs
- —
Air-quality risk 6/10 · Moderate
- Unhealthy air days now
- 9 days/yr
- Unhealthy air days in 30 yrs
- 10 days/yr
Risk factors via First Street. Map © Google.
Why this score? — see what drove the C+ grade
The composite is a weighted blend of 9 inputs, each scored 0–100. Each bar is that input's sub-score; the figure is the points it added to the 100-point composite (weight × sub-score).
- Cash flow +29.9/30.0
- DSCR +10.0/10.0
- 1% rule +7.4/10.0
- Schools +4.8/10.0
- Livability +4.0/5.0
- Rent growth +3.3/5.0
- Condition / age +2.5/5.0
- ARV discount +1.7/15.0
- Appreciation +0.0/10.0
$158,900
🖨 Deal sheet (PDF) 📄 Offer letter ✓ Due diligence
Listing remarks
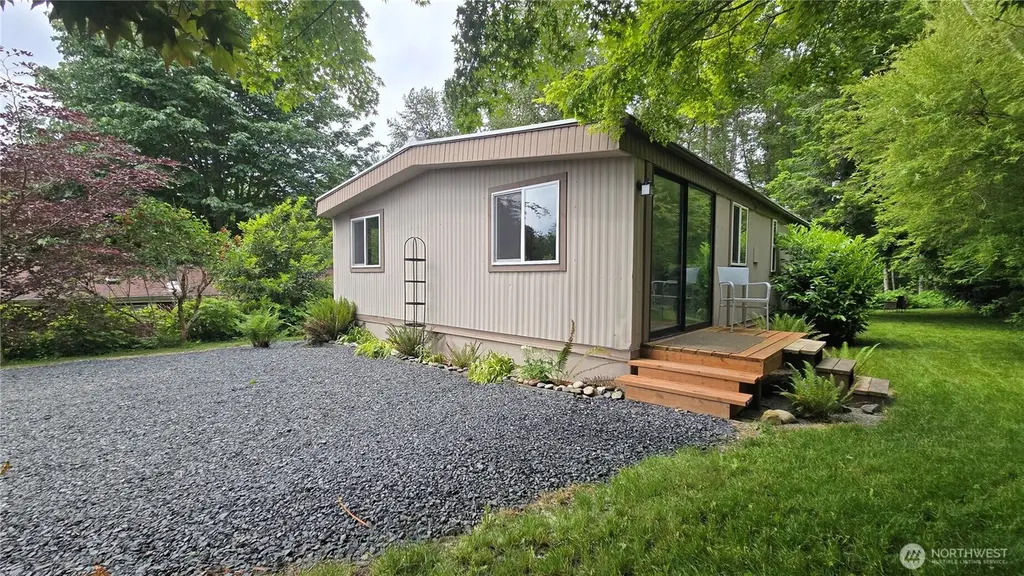
Safe and quiet living in this gorgeous remodeled manufactured home in one of the area's most affordable parks. Located near Lake Padden and Galbraith Mountain but also on a bus line and 10 minutes to downtown Bellingham, this is likely the most affordable living option around. Completely updated and newly remodeled, the attractive and bright, spacious open concept inside boasts new appliances, vinyl plank flooring, paint, trim, windows, insulation, paint inside and out, carpet, vapor barrier, yard and landscaping. Outside is plenty of parking on the new driveway, a handy shed for tools or toys, a front and back deck and a location backing up to the forest. There's a healthy, green lawn, abu
Key facts
- Updated appliances
- Handy shed
- New driveway
Tags
Property features AI
Finance
- Other: Calculated living area 864; Structure type: Manufactured house; Style: Manufactured double wide
- Financial info: Listing terms: Cash or Conventional
- HOA & community: Located in Forest Park (park-approved for sale); Park amenities include common area; Pets allowed (cats and dogs; see remarks); Land lease of $650/month
Exterior
- Parking: Uncovered parking; 3 open parking spaces
- Utilities: Electric energy source; Community water (park); Park sewer; Power by PSE; Electric water heater
- Home design: Manufactured double-wide home (Homette model 36x24); Updated/remodeled condition; One level; Faces south; Mobile home remains on site
- Construction: Metal/vinyl and wood construction; Composition and torch down roof; Wood skirting; Tie-down foundation
- Exterior features: Metal/vinyl and wood exterior; Dead-end street; Paved access; View
Interior
- Kitchen: Kitchen without eating space; Dining room adjacent
- Bedrooms: 2 bedrooms
- Flooring: Vinyl plank; Carpet
- Bathrooms: 1 full bathroom
- Heating & cooling: Forced air heating; No central cooling
- Interior features: Water heater; Double pane windows; Patio/porch/deck; Walk-in closet
- Laundry & utility: Back shed for storage
Neighborhood map
What this means for you Summary
Snapshot
- This is a 2-bed/1.5-bath manufactured listed at $159k.
Deal economics
- At list price, monthly cash flow is $590 ($7k/yr) — positive.
- The deal already cash-flows at list — no discount required.
- Meets the 1% rule at list price ($2k rent vs $159k).
- Cap rate 10.7% vs local median 2.0% in Bellingham — top-decile yield for the area; either an underpriced asset or a hidden risk that comps aren't pricing in. Stress-test before assuming the spread holds.
Location & tenants
- Location reads 80/100 on livability (#102 in WA, #1,947 nationally) — a professional / high-income tenant draw. Strengths: amenities A+, commute A+, health & safety A+; Watch: crime F, cost of living F.
- Bellingham School District (urban): math 47% / reading 63% proficiency, ranked #106 of 291 in WA (top 36%) — acceptable for families but not a draw, mixed tenant base, ~2y average lease.
- Zoned schools: Wade King Elementary School (346 students, 24% FRL); Sehome High School (1,163 students, 25% FRL).
- Market conditions: Rents rising (+3.4%/yr); 270 active listings in the ZIP; 4 comparable units currently listed for rent nearby; rentals at typical pace (median 22d on market — plan ~3-4 weeks tenant-placement turnaround); solid renter incomes; 1,190 units permitted in Whatcom County in 2024 (327 in 5+ unit buildings).
Forward outlook
- Local home prices are declining (-3.0%/yr); year-one equity from $1k of loan paydown is wiped out by about $5k of value loss. Plan a longer hold.
- Whatcom County population projected at +28% by 2050 — long-run rental-demand tailwind backs the buy-and-hold thesis.
- At projected returns (-3.0% appreciation + 3.4% rent growth), your $44k cash investment doubles in ~8 years — after that, you're playing with house money.
Negotiation context
- Only 14 days on market — expect competitive offers; lowballing is unlikely to land.
Questions for the listing agent
- Built in 1975 — when were the roof, HVAC, electrical panel, plumbing, and water heater last replaced?
- Is there a deadline driving the sale (1031 exchange, divorce, estate, relocation)? That informs how much negotiation room exists.
- Schools are B-rated — typically a magnet for longer-tenancy family renters. What's the average tenant stay here, and is there a school-zone premium baked into asking?
- Crime grade is F in this area — have there been break-ins, vandalism, or insurance claims at this property in the last 3 years? What carrier currently insures it and at what premium?
- What's the average days-on-market for RENTAL listings here right now (not sales)? A rising rental-DOM trend means longer vacancies and softer asking-rent achievability than the comps imply.
- What's the recent tenant-quality profile in this submarket — average credit score on applications, eviction rate, late-payment / NSF rate, and stable-employment percentage? A property-management company in the area should have these aggregated.
- How much new for-sale + rental construction is in the pipeline within 1–3 miles? Heavy new supply typically softens prices + rents 12–24 months out; constrained supply supports both.
Investment metrics
- 1% rule
- 1.24% ✓
- Cap rate
- 10.75%
- Cash-on-cash
- 15.90%
- DSCR
- 1.71
- GRM
- 6.7
CMA / ARV
- ARV (on-the-fly)
- $140,832
- Comps found
- 1
Show comp detail 1 sale within ~0.75 mi
| Address | Dist | Beds/Ba | Sqft | Sold | Price | $/sf | Match |
|---|---|---|---|---|---|---|---|
| 2284 Yew st Rd Unit B6 | 0.20mi | 2/1.0 | 784 (-9%) | 6mo | $128,000 | $163 | 68 |
Match score weights: distance 35% · size 25% · config 20% · recency 20%. Top-matched comps best support the ARV.
Projected returns pro-forma
-3.0% appreciation · 3.38% rent growth · sell at horizon
- IRR
- 7.2%
- Equity multiple
- 1.28×
- Total profit
- $12,521
- Equity at exit
- $23,693
- IRR
- 16.8%
- Equity multiple
- 2.40×
- Total profit
- $62,210
- Equity at exit
- $13,739
Cash invested: $44,492 (down + closing). Projections, not guarantees.
Landlord ↔ Tenant lean methodology
- Overall (STATE)
- 28 Tenant-Leaning
- State Washington
- 28 Tenant-Leaning · D+8
- County
- — inherits STATE
- City
- — inherits STATE
ZIP-level market 98229
- Rents YoY
- 3.4%
- Active inventory
- 270
- Price-to-rent
- 6.7×
Monthly cashflow live
- Estimated rent
- $1,977 medium interval (Pro) →
- Mortgage (P&I)
- −$833
- Tax from tax record
- −$73 /mo · $874/yr
- Insurance
- −$66
- HOA
- −$0
- Vacancy / Maint / Mgmt
- −$415
- Net cashflow
- $590
Break-even live
Sensitivity live
| Price | -10% $680 | -5% $635 | +0% $590 | +5% $545 | +10% $500 |
|---|---|---|---|---|---|
| Rent | -10% $433 | -5% $512 | +0% $590 | +5% $668 | +10% $746 |
| Rate | -1.0pp $670 | -0.5pp $630 | base $590 | +0.5pp $549 | +1.0pp $507 |
UW: 25.0% down · 7.5% · 30yr · 1.5% tax · 5.0% vac · 8.0% maint · 8.0% mgmt
Financing live
Cash to close
- Down payment
- $39,725
- Closing costs
- $4,767
- Reserves months
- —
- Total cash needed
- —
Loan-product check · same deal, 3 products live
Conventional
25% down · 7.5% · 30yr
- Down + closing
- —
- Monthly P&I
- —
- Monthly cashflow
- —
- DSCR
- —
- Eligible?
- —
Personal DTI + credit; lowest rate.
DSCR
20% down · 8.5% · 30yr
- Down + closing
- —
- Monthly P&I
- —
- Monthly cashflow
- —
- DSCR
- —
- Eligible?
- —
No personal income docs; deal must DSCR.
Hard money
10% down · 12.0% · 12mo
- Down + closing
- —
- Monthly P&I
- —
- Monthly cashflow
- —
- DSCR
- —
- Eligible?
- —
Short-term bridge; refi at stabilization.
Rent comps 4 comps
| Address | Beds | Baths | Sqft | Rent | $/sqft | DOM | Units | Dist |
|---|---|---|---|---|---|---|---|---|
| 3966 Byron Ave Unit 105 Bellingham, WA | 2.0 | 2.0 | 995 | $1,650 | $1.66 | 21d | 1 | 1.35mi |
| 3966 Byron Ave Bellingham, WA | 1.0 | 1.0 | 711 | $1,450 | $2.04 | 21d | 1 | 1.35mi |
| 3805 Elwood Ave Bellingham, WA | 4.0 | 1.0–2.5 | 1213 | $2,418 | $1.99 | 13d | 49 | 1.43mi |
| 1743 E Maple St Bellingham, WA | 1.0–3.0 | 1.0–2.0 | 910 | $2,108 | $2.32 | 13d | 12 | 1.46mi |
Listing history 12 events
-
2026-06-18days on market $158,900 Active 14 DOM
-
2026-06-17days on market $158,900 Active 13 DOM
-
2026-06-16days on market $158,900 Active 12 DOM
-
2026-06-15days on market $158,900 Active 11 DOM
-
2026-06-14days on market $158,900 Active 9 DOM
-
2026-06-13days on market $158,900 Active 8 DOM
-
2026-06-10days on market $158,900 Active 6 DOM
-
2026-06-09days on market $158,900 Active 5 DOM
-
2026-06-08days on market $158,900 Active 4 DOM
-
2026-06-07days on market $158,900 Active 3 DOM
-
2026-06-05remarks 699-char remark
-
2026-06-05$158,900 Active 1 DOM
ⓘ Source: listings_history table (triggers on properties + properties_extension) + one-shot
backfill from property_details.listing_events for pre-trigger history.
Tax reassessment forecast WA · Resets to sale price
- Current annual tax
- $874 · $73/mo
- Projected year-2 tax
- $1,557 · $130/mo
- Expected delta
- +$683/yr (+$57/mo · 78.1%)
ⓘ Screening estimate from a state-policy table — verify with the county assessor before closing.
Climate risk First Street
- Flood 1/10 Low FEMA zone X (unshaded) · 0% chance over 30 yrs
- Wildfire 4/10 Moderate
- Heat 1/10 Low 6 d/yr ≥83°F today · 13 d/yr by 30 yrs out
- Wind 1/10 Low
- Air quality 6/10 Major 9 unhealthy d/yr today · 10 by 30 yrs out
Nearby sold comps map
Loading sold comps map…
Walkable amenities ~0.75 mi
Loading nearby amenities…
Taxation est. · year 1
- Rental income
- $23,727
- − Mortgage interest
- −$8,901
- − Property taxes
- −$874
- − Insurance
- −$794
- − Repairs & maintenance
- −$1,898
- − Management
- −$1,898
- − Depreciation
- −$4,623
- Taxable income
- $4,739
- Est. tax owed @ 24.0%
- −$1,137
- After-tax cash flow
- $5,939/yr
For passive investors: Depreciation is non-cash, so a rental often shows a tax loss while cash-flowing — sheltering income. Rental losses are passive: they offset passive income freely, and up to $25,000/yr can offset ordinary (W-2) income if you actively participate and your MAGI is under $100k (phasing out to $0 by $150k); unused losses carry forward. On sale, claimed depreciation is recaptured at up to 25%, and gains may owe capital-gains tax (a 1031 exchange can defer both). Figures are a year-1 estimate at your 24.0% rate — not tax advice; consult a CPA.
Schools (NCES district)
- District
- Bellingham School District
- NCES district ID
- 5300420
- Math proficiency
- 47% ▼ -6.00%
- Reading proficiency
- 63% ▼ -1.00%
- Median HH income
- $47,678
- Composite
- 48.49/100
- National rank
- #4632
- State rank
- #106 of 291 in WA
Livability — Bellingham
- Score
- 80/100
- State rank
- #102
- US rank
- #1947
Category grades
Schools grade is shown separately in the Schools card above.
Census & demographics
- County
- Whatcom County · 209,776 people
- City population
- 130,296
- Metro
- Bellingham, WA
- Population (ZIP)
- 33,298
- Household income
- $90,945
- Rent vs Own
- Severe rent burden
- 1040.0
Population outlook (Whatcom County) Hauer SSP2
- Today (2025)
- 240,408 people
- By 2030
- 254,667 · +5.9%
- By 2040
- 281,365 · +17.0%
- By 2050
- 307,592 · +27.9%
- By 2075
- 375,576 · +56.2%
- By 2100
- 421,637 · +75.4%
Race, ethnicity, and origin ACS 2023
- Neighborhood character
- Predominantly White (77%)
- Race & ethnicity
- White 77% Two or more races 13% Hispanic / Latino 10% Asian 3%
- Hispanic origin (detail)
- Mexican 8%
- Common ancestry
- Portuguese 6% Italian 4% Slovak 4%
- Foreign-born
- 8% · Canada, China, Vietnam
- Languages at home
- 88% English-only · Spanish 7% Chinese 1% German/W. Germanic 1%
Political lean MEDSL · Whatcom
- 2024 margin
- Strong D (+24.9) · D 60.8% · R 35.9% · Other 3.3%
- 2008→2024 swing
- +6.9pp toward D · 2008: 18.0pp · 2024: 24.9pp
- All cycles
- 2024: D+24.9 2020: D+23.9 2016: D+17.7 2012: D+12.1 2008: D+18.0
Not yet ingested
- Civics
- —
Market trends
- HPI YoY
- ▼ -652.00%
- Current HPI
- 413.1478
- Rent YoY
- ▲ 3.38%
- Metro
- Bellingham, WA
- State GDP YoY
- ▲ 4.65%
- F500 in state
- 22
Industry mix (Fortune 500 HQ in WA)
| Industry | F500 HQs | Revenue |
|---|---|---|
| Retail | 2 | $269B |
|
||
| Technology / Retail | 1 | $638B |
|
||
| Technology | 1 | $245B |
|
||
| Telecommunications | 1 | $38B |
|
||
| Food / Beverage | 1 | $36B |
|
||
| Automotive / Trucks | 1 | $34B |
|
||
Price history
1 event — show timeline
- 2026-06-04 Listed $158,900 NWMLS as Distributed by MLS Grid
Property tax history
+11.9%/yrLatest (2026): $874 · +284.2% YoY. Source: county tax records.
Cash-flow waterfall
monthlySold comps — $/sqft
last 12 mo · ≤1 miLoading sold comps…