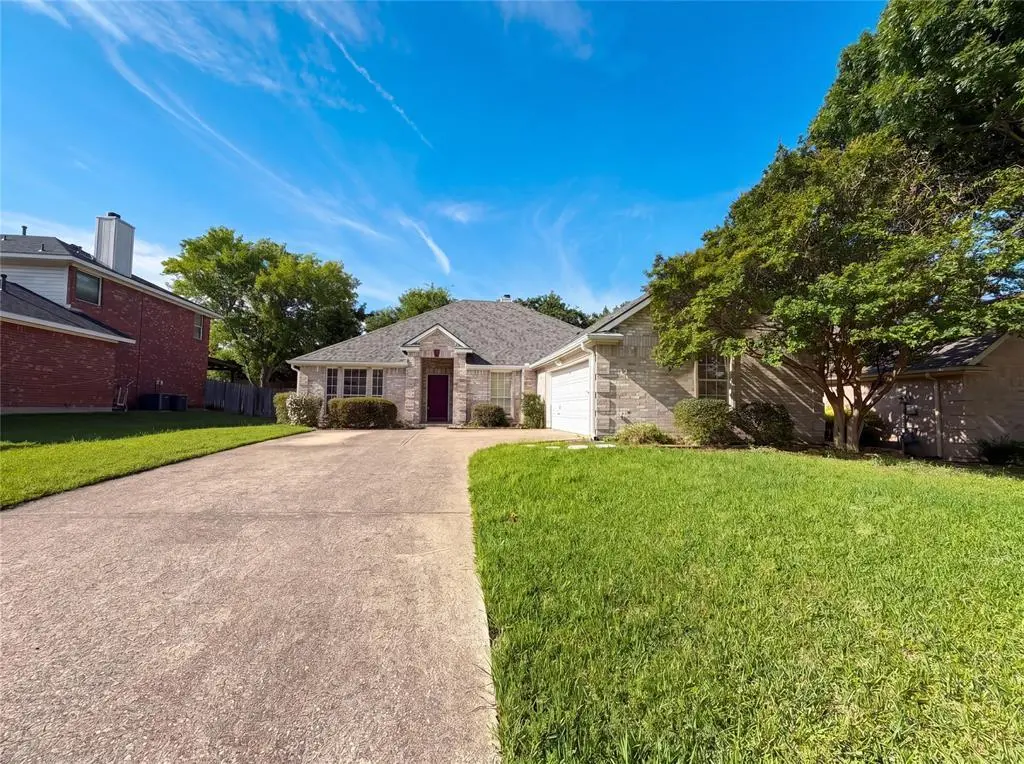
525 Hidden Oak Ln · Rockwall, TX
Flood risk 1/10 · Minimal
- FEMA flood zone
- X (unshaded)
- Chance of flooding over 30 yrs
- 0.0%
- Est. flood insurance / yr
- $507 – $1,088
Fire risk 5/10 · Moderate
- Est. fire insurance / yr
- $1,222 – $2,270
Heat risk 7/10 · Major
- Hot days now (above 109°F)
- 7 days/yr
- Hot days in 30 yrs
- 24 days/yr
Wind risk 6/10 · Moderate
- Chance of severe wind over 30 yrs
- 27.0%
Air-quality risk 3/10 · Minor
- Unhealthy air days now
- 2 days/yr
- Unhealthy air days in 30 yrs
- 3 days/yr
Risk factors via First Street. Map © Google.
Why this score? — see what drove the D- grade
The composite is a weighted blend of 9 inputs, each scored 0–100. Each bar is that input's sub-score; the figure is the points it added to the 100-point composite (weight × sub-score).
- ARV discount +12.8/15.0
- Cash flow +7.7/30.0
- Schools +5.0/10.0
- Livability +3.9/5.0
- Rent growth +3.3/5.0
- 1% rule +2.5/10.0
- Condition / age +2.5/5.0
- DSCR +1.8/10.0
- Appreciation +0.0/10.0
$357,000
🖨 Deal sheet (PDF) 📄 Offer letter ✓ Due diligence
Listing remarks
Check out 525 Hidden Oak Ln, a residence designed for everyday comfort and practical living. The kitchen contains a functional island, an accent backsplash, and stainless steel appliances. The primary bathroom includes double sinks and a separate tub and shower. A cozy fireplace adds warmth indoors, while a covered patio and a storage shed enhance exterior utility. This property blends comfort and convenience, a must-see for practical living. This home has been virtually staged to illustrate its potential. . Home comes with a 100-Day Home Warranty and a 7-Day Home Test Drive to move in 7 days early for free
Key facts
- Double sinks
- Functional island
- Cozy fireplace
Tags
Property features AI
Finance
- Other: Listing possession at closing/funding; Standard listing conditions
- Financial info: Acceptable financing: Cash, Conventional, VA Loan
- HOA & community: Mandatory association; Annual HOA fee of $400; HOA covers grounds maintenance; HOA managed by Gulf Professional Property Management, Inc.
Exterior
- Parking: Two covered parking spaces; Two-car attached garage; Driveway
- Security: Security system excluded from sale; Kwikset lock to be replaced at closing (per exclusions)
- Utilities: City water; City sewer; Not in a municipal utility district
- Home design: Single-family residence; One story; Residential property
- Construction: Wood construction; Slab foundation; Built in 1998; Preowned condition
- Exterior features: Back yard fencing (wood); Less than 0.5 acre lot
Interior
- Kitchen: Dishwasher; Microwave
- Bedrooms: 3 bedrooms (primary bedroom on main level)
- Flooring: Carpet; Ceramic tile; Vinyl
- Bathrooms: 2 full bathrooms
- Heating & cooling: Central heating; Central electric air conditioning
- Interior features: Two living areas; Two dining areas; Other interior features
- Laundry & utility: No smart-home features indicated
Neighborhood map
What this means for you Summary
Snapshot
- This is a 3-bed/2.0-bath single-family listed at $357k.
Deal economics
- At list price, monthly cash flow is $-415 ($-5k/yr) — negative.
- To cash-flow at today's rent, offer at most $284k (20.5% below list).
- To meet the 1% rule (rent ≥ 1% of price), the offer needs to be $266k (25.4% below list).
- Recommended offer: $266k (25.4% below list) — sets the bar for 1% rule.
- Cap rate 4.9% vs local median 2.9% in Rockwall — top-decile yield for the area; either an underpriced asset or a hidden risk that comps aren't pricing in. Stress-test before assuming the spread holds.
Location & tenants
- Location reads 77/100 on livability (#86 in TX, #3,043 nationally) — a middle-class / working-renter tenant base. Strengths: employment A+, housing A+, crime A-; Watch: amenities F, commute F.
- Rockwall ISD (suburban): math 54% / reading 54% proficiency, ranked #83 of 826 in TX (top 10%) — acceptable for families but not a draw, mixed tenant base, ~2y average lease.
- Zoned schools: Nebbie Williams El (math 75% / reading 62%, grade B+, #176 of 4,322 statewide, top 4%, 416 students, 12% FRL).
- Zoned-school proficiency averages 68% at this address vs 54% district-wide (+14 pts) — the actual schools serving this property are materially stronger than the Rockwall ISD average implies; a family-tenant draw the district grade alone would hide.
- Market conditions: Rents rising (+3.2%/yr); 1012 active listings in the ZIP; 11 comparable units currently listed for rent nearby; rentals at typical pace (median 14d on market — plan ~3-4 weeks tenant-placement turnaround); high-income renter base; 1,810 units permitted in Rockwall County in 2024 (0 in 5+ unit buildings).
Forward outlook
- Local home prices are declining (-3.0%/yr); year-one equity from $2k of loan paydown is wiped out by about $11k of value loss. Plan a longer hold.
- Rockwall County population projected at +56% by 2050 — long-run rental-demand tailwind backs the buy-and-hold thesis.
Negotiation context
- It's been on market 40 days — a 3% lower offer ($346k) is reasonable based on typical stale-listing flexibility.
Risks & watch-outs
- Climate carrying-cost: major wind risk, 27% chance of damaging wind over 30y; moderate wildfire risk; extreme-heat days projected 7→24/yr by 2055 (HVAC capex compounding) — expect insurance premiums to compound above CPI over the hold.
Questions for the listing agent
- What do current leases actually rent for vs. the listed asking? Can we see a recent rent roll and the last 12 months of T-12 income?
- It's been on market 40 days. Have you received any prior offers? Is the seller open to a 25% concession, seller financing, or rate buy-down credit?
- What does the HOA fee cover, when was the last increase, and are there any pending special assessments or reserve-fund shortfalls?
- Is there a deadline driving the sale (1031 exchange, divorce, estate, relocation)? That informs how much negotiation room exists.
- Schools are B-rated — typically a magnet for longer-tenancy family renters. What's the average tenant stay here, and is there a school-zone premium baked into asking?
- The area grade is low — what's the realistic commute time and amenity access for the typical tenant pool here? Any planned neighborhood developments (good or bad) we should know about?
- What's the average days-on-market for RENTAL listings here right now (not sales)? A rising rental-DOM trend means longer vacancies and softer asking-rent achievability than the comps imply.
- What's the recent tenant-quality profile in this submarket — average credit score on applications, eviction rate, late-payment / NSF rate, and stable-employment percentage? A property-management company in the area should have these aggregated.
- How much new for-sale + rental construction is in the pipeline within 1–3 miles? Heavy new supply typically softens prices + rents 12–24 months out; constrained supply supports both.
Investment metrics
- 1% rule
- 0.75% ✗
- Cap rate
- 4.90%
- Cash-on-cash
- -4.98%
- DSCR
- 0.78
- GRM
- 11.2
CMA / ARV
- ARV (median comp)
- $404,593
- List price
- $357,000
- Delta
- -11.76%
- Verdict
- UNDERPRICED
- Comps
- 20 within 1.0 mi
Show comp detail 12 sales within ~0.75 mi
| Address | Dist | Beds/Ba | Sqft | Sold | Price | $/sf | Match |
|---|---|---|---|---|---|---|---|
| 510 Bending Oaks Trl | 0.20mi | 4/2.0 (+1) | 1,905 (+0%) | 2mo | $359,900 | $189 | 84 |
| 539 Tall Oaks Pl | 0.07mi | 3/2.0 | 1,876 (-2%) | 16mo | $399,900 | $213 | 81 |
| 442 Sonoma Dr | 0.41mi | 3/2.0 | 2,031 (+7%) | 4mo | $385,000 | $190 | 66 |
| 461 Sausalito Dr | 0.62mi | 3/2.0 | 1,917 (+1%) | 11mo | $359,500 | $188 | 61 |
| 1353 Grass Valley Dr | 0.53mi | 3/2.0 | 1,697 (-11%) | 1mo | $315,000 | $186 | 56 |
| 1530 Petaluma Dr | 0.38mi | 4/2.0 (+1) | 2,128 (+12%) | 2mo | $462,500 | $217 | 56 |
| 1419 Grass Vly | 0.38mi | 4/2.0 (+1) | 2,062 (+8%) | 9mo | $349,900 | $170 | 56 |
| 1509 Audubon | 0.45mi | 3/2.0 | 1,649 (-13%) | 7mo | $349,900 | $212 | 51 |
| 1438 Audobon Ln | 0.54mi | 4/2.5 (+1) | 2,111 (+11%) | 7mo | $385,000 | $182 | 44 |
| 136 Ireland Ct | 0.48mi | 3/2.0 | 2,124 (+12%) | 20mo | $414,180 | $195 | 42 |
| 479 Sausalito Dr | 0.61mi | 4/2.0 (+1) | 2,113 (+11%) | 12mo | $405,000 | $192 | 38 |
| 2610 Eganridge Ln | 0.70mi | 3/2.0 | 1,626 (-15%) | 8mo | $389,900 | $240 | 36 |
Match score weights: distance 35% · size 25% · config 20% · recency 20%. Top-matched comps best support the ARV.
Projected returns pro-forma
-3.0% appreciation · 3.23% rent growth · sell at horizon
- IRR
- -24.5%
- Equity multiple
- 0.16×
- Total profit
- $-83,568
- Equity at exit
- $53,230
- IRR
- -19.3%
- Equity multiple
- -0.04×
- Total profit
- $-103,939
- Equity at exit
- $30,867
Cash invested: $99,960 (down + closing). Projections, not guarantees.
Landlord ↔ Tenant lean methodology
- Overall (STATE)
- 87 Strongly Landlord-Friendly
- State Texas
- 87 Strongly Landlord-Friendly · R+5
- County
- — inherits STATE
- City
- — inherits STATE
ZIP-level market 75087
- Rents YoY
- 3.2%
- Active inventory
- 1012
- Price-to-rent
- 11.2×
Monthly cashflow live
- Estimated rent
- $2,662 high interval (Pro) →
- Mortgage (P&I)
- −$1,872
- Tax from tax record
- −$464 /mo · $5,567/yr
- Insurance
- −$149
- HOA
- −$33
- Vacancy / Maint / Mgmt
- −$559
- Net cashflow
- $-415
Break-even live
Sensitivity live
| Price | -10% $-213 | -5% $-314 | +0% $-415 | +5% $-516 | +10% $-617 |
|---|---|---|---|---|---|
| Rent | -10% $-625 | -5% $-520 | +0% $-415 | +5% $-309 | +10% $-204 |
| Rate | -1.0pp $-235 | -0.5pp $-324 | base $-415 | +0.5pp $-507 | +1.0pp $-601 |
UW: 25.0% down · 7.5% · 30yr · 1.5% tax · 5.0% vac · 8.0% maint · 8.0% mgmt
Financing live
Cash to close
- Down payment
- $89,250
- Closing costs
- $10,710
- Reserves months
- —
- Total cash needed
- —
Loan-product check · same deal, 3 products live
Conventional
25% down · 7.5% · 30yr
- Down + closing
- —
- Monthly P&I
- —
- Monthly cashflow
- —
- DSCR
- —
- Eligible?
- —
Personal DTI + credit; lowest rate.
DSCR
20% down · 8.5% · 30yr
- Down + closing
- —
- Monthly P&I
- —
- Monthly cashflow
- —
- DSCR
- —
- Eligible?
- —
No personal income docs; deal must DSCR.
Hard money
10% down · 12.0% · 12mo
- Down + closing
- —
- Monthly P&I
- —
- Monthly cashflow
- —
- DSCR
- —
- Eligible?
- —
Short-term bridge; refi at stabilization.
Rent comps 11 comps
| Address | Beds | Baths | Sqft | Rent | $/sqft | DOM | Units | Dist |
|---|---|---|---|---|---|---|---|---|
| 2750 Fern Valley Ln Rockwall, TX | 4.0 | 2.0 | 1923 | $2,400 | $1.25 | 20d | 1 | 0.82mi |
| 811 Knox Dr Rockwall, TX | 4.0 | 2.0 | 2180 | $2,850 | $1.31 | 5d | 1 | 0.82mi |
| 1875 Crestlake Dr Rockwall, TX | 3.0 | 2.0 | 1610 | $2,250 | $1.40 | 45d | 1 | 0.92mi |
| 1720 Avonlea Dr Rockwall, TX | 3.0 | 2.0 | 1630 | $2,375 | $1.46 | 25d | 1 | 1.03mi |
| 875 Shores Blvd Rockwall, TX | 3.0 | 2.0 | 2026 | $2,750 | $1.36 | 0d | 1 | 1.04mi |
| 212 Darrin Dr Rockwall, TX | 3.0 | 2.0 | 1366 | $2,095 | $1.53 | 8d | 1 | 1.04mi |
| 212 Darrin Dr Rockwall, TX | 3.0 | 2.0 | 1366 | $2,095 | $1.53 | 18d | 1 | 1.04mi |
| 947 Sunset Hill Dr Rockwall, TX | 4.0 | 3.0 | 2590 | $4,095 | $1.58 | 8d | 1 | 1.26mi |
| 947 Sunset Hill Dr Rockwall, TX | 4.0 | 3.0 | 2590 | $4,095 | $1.58 | 4d | 1 | 1.26mi |
| 1143 Bayshore Dr Rockwall, TX | 3.0 | 2.0 | 1763 | $2,950 | $1.67 | 45d | 1 | 1.45mi |
| 550 Williams St Rockwall, TX | 1.0–3.0 | 1.0–2.0 | 1057 | $2,715 | $2.57 | 14d | 15 | 1.50mi |
HOA detail
- Monthly dues
- $33 · $396/yr
Listing history 17 events
-
2026-06-21days on market $357,000 Active 40 DOM
-
2026-06-18days on market $357,000 Active 37 DOM
-
2026-06-17days on market $357,000 Active 36 DOM
-
2026-06-16days on market $357,000 Active 35 DOM
-
2026-06-15days on market $357,000 Active 34 DOM
-
2026-06-13days on market $357,000 Active 32 DOM
-
2026-06-13days on market $357,000 Active 31 DOM
-
2026-06-09days on market $357,000 Active 28 DOM
-
2026-06-08days on market $357,000 Active 27 DOM
-
2026-06-07days on market $357,000 Active 26 DOM
-
2026-06-04days on market $357,000 Active 23 DOM
-
2026-06-03days on market $357,000 Active 22 DOM
-
2026-06-02days on market $357,000 Active 21 DOM
-
2026-06-01days on market $357,000 Active 20 DOM
-
2026-05-31days on market $357,000 Active 19 DOM
-
2026-05-12$357,000 Active 613-char remark
-
2026-04-22soldstatus
ⓘ Source: listings_history table (triggers on properties + properties_extension) + one-shot
backfill from property_details.listing_events for pre-trigger history.
Tax reassessment forecast TX · Resets to sale price
- Current annual tax
- $5,567 · $464/mo
- Projected year-2 tax
- $6,533 · $544/mo
- Expected delta
- +$966/yr (+$81/mo · 17.4%)
ⓘ Screening estimate from a state-policy table — verify with the county assessor before closing.
Climate risk First Street
- Flood 1/10 Low FEMA zone X (unshaded) · 0% chance over 30 yrs
- Wildfire 5/10 Major
- Heat 7/10 Severe 7 d/yr ≥109°F today · 24 d/yr by 30 yrs out
- Wind 6/10 Major 27% chance of damaging wind over 30 yrs
- Air quality 3/10 Moderate 2 unhealthy d/yr today · 3 by 30 yrs out
Nearby sold comps map
Loading sold comps map…
Walkable amenities ~0.75 mi
Loading nearby amenities…
Taxation est. · year 1
- Rental income
- $31,947
- − Mortgage interest
- −$19,998
- − Property taxes
- −$5,567
- − Insurance
- −$1,785
- − Repairs & maintenance
- −$2,556
- − Management
- −$2,556
- − HOA
- −$396
- − Depreciation
- −$10,385
- Taxable loss
- −$11,295
- Est. tax savings @ 24.0%
- +$2,711
- After-tax cash flow
- $-2,265/yr
For passive investors: Depreciation is non-cash, so a rental often shows a tax loss while cash-flowing — sheltering income. Rental losses are passive: they offset passive income freely, and up to $25,000/yr can offset ordinary (W-2) income if you actively participate and your MAGI is under $100k (phasing out to $0 by $150k); unused losses carry forward. On sale, claimed depreciation is recaptured at up to 25%, and gains may owe capital-gains tax (a 1031 exchange can defer both). Figures are a year-1 estimate at your 24.0% rate — not tax advice; consult a CPA.
Schools (NCES district)
- District
- Rockwall ISD
- NCES district ID
- 4837650
- Math proficiency
- 54% ▼ -13.00%
- Reading proficiency
- 54% ▼ -8.00%
- Median HH income
- $88,800
- Composite
- 49.82/100
- National rank
- #1952
- State rank
- #83 of 826 in TX
Livability — Rockwall
- Score
- 77/100
- State rank
- #86
- US rank
- #3043
Category grades
Schools grade is shown separately in the Schools card above.
Census & demographics
- Census place
- Rockwall, TX
- County
- Rockwall County · 132,930 people
- City population
- 84,191
- Metro
- Dallas-Fort Worth-Arlington, TX
- Population (ZIP)
- 44,326
- Household income
- $129,484
- Rent vs Own
- Severe rent burden
- 646.0
Population outlook (Rockwall County) Hauer SSP2
- Today (2025)
- 118,396 people
- By 2030
- 132,209 · +11.7%
- By 2040
- 159,538 · +34.7%
- By 2050
- 185,299 · +56.5%
- By 2075
- 243,489 · +105.7%
- By 2100
- 277,814 · +134.6%
Race, ethnicity, and origin ACS 2023
- Neighborhood character
- Predominantly White (69%)
- Race & ethnicity
- White 69% Hispanic / Latino 17% Two or more races 12% Black 7% Asian 4%
- Hispanic origin (detail)
- Mexican 12%
- Common ancestry
- Slovak 2% Italian 2% Iranian 2%
- Foreign-born
- 8% · Canada, Vietnam, South Korea
- Languages at home
- 88% English-only · Spanish 8% Other Indo-European 1% Vietnamese 1%
Political lean MEDSL · Rockwall
- 2024 margin
- Solid R (+40.9) · D 29.1% · R 70.0%
- 2008→2024 swing
- +5.3pp toward D · 2008: -46.2pp · 2024: -40.9pp
- All cycles
- 2024: R+40.9 2020: R+37.7 2016: R+47.5 2012: R+53.3 2008: R+46.2
Not yet ingested
- Civics
- —
Market trends
- HPI YoY
- ▼ -188.34%
- Current HPI
- 208.2221
- Rent YoY
- ▲ 3.23%
- Metro
- Dallas-Fort Worth-Arlington, TX
- State GDP YoY
- ▲ 3.95%
- F500 in state
- 110
Industry mix (Fortune 500 HQ in TX)
| Industry | F500 HQs | Revenue |
|---|---|---|
| Energy | 16 | $1,198B |
|
||
| Technology | 5 | $198B |
|
||
| Engineering / Construction | 4 | $72B |
|
||
| Energy Services | 3 | $60B |
|
||
| Utilities | 3 | $41B |
|
||
| Healthcare | 2 | $330B |
|
||
Price history
2 events — show timeline
- 2026-05-12 Listed $357,000 NTREIS
- 2026-04-22 Sold (Public Records) — Public Records
Property tax history
+2.9%/yrLatest (2025): $5,567 · +5.1% YoY. Source: county tax records.
Cash-flow waterfall
monthlySold comps — $/sqft
last 12 mo · ≤1 miLoading sold comps…