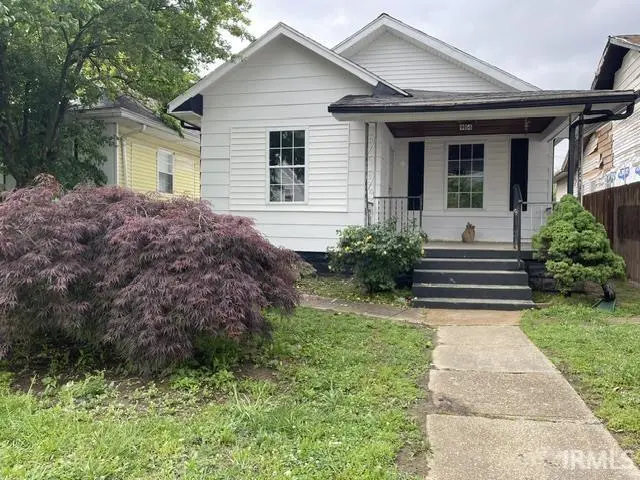
914 W Missouri St · Evansville, IN
Flood risk 1/10 · Minimal
- FEMA flood zone
- X (unshaded)
- Chance of flooding over 30 yrs
- 0.0%
- Est. flood insurance / yr
- $473 – $860
Fire risk 1/10 · Minimal
- Est. fire insurance / yr
- $717 – $1,331
Heat risk 5/10 · Moderate
- Hot days now (above 106°F)
- 7 days/yr
- Hot days in 30 yrs
- 19 days/yr
Wind risk 3/10 · Minor
- Chance of severe wind over 30 yrs
- 4.0%
Air-quality risk 4/10 · Minor
- Unhealthy air days now
- 3 days/yr
- Unhealthy air days in 30 yrs
- 5 days/yr
Risk factors via First Street. Map © Google.
Why this score? — see what drove the C+ grade
The composite is a weighted blend of 9 inputs, each scored 0–100. Each bar is that input's sub-score; the figure is the points it added to the 100-point composite (weight × sub-score).
- Cash flow +27.1/30.0
- DSCR +9.4/10.0
- ARV discount +7.5/15.0
- 1% rule +6.4/10.0
- Schools +3.3/10.0
- Livability +3.2/5.0
- Rent growth +2.5/5.0
- Condition / age +2.5/5.0
- Appreciation +0.0/10.0
$89,900
🖨 Deal sheet 📄 Offer letter ✓ Due diligence
Listing remarks MLS
GREAT INVESTMENT OPPORTUNITY. Was a 2 BR /1 bath bungalow style home. Structure has 904 sq ft and a 16x22 detached garage with carport. Home was involved in a fire and has everything down to the studs removed. Some clean-up is still needed around the yard and garage area. Property is sold "as-is". Priced to sell!
Key facts
- New plumbing
- New bathroom
- New flooring
Tags
Property features AI
Exterior
- Parking: Detached 2-car garage
- Utilities: Public water; Public sewer
- Home design: Single-family, site-built home; One story
- Construction: Wood siding; Brick/mortar foundation
- Exterior features: Level lot; Lot dimensions approximately 35 x 131
Interior
- Bathrooms: One full bathroom (main level)
- Heating & cooling: Central air conditioning; Natural gas forced-air heating
- Interior features: Partial basement; Six total rooms
- Laundry & utility: Laundry on the main level; No built-in appliances listed
Neighborhood map
What this means for you Summary
Snapshot
- This is a 2-bed/1.0-bath single-family listed at $90k.
Deal economics
- At list price, monthly cash flow is $255 ($3k/yr) — positive.
- The deal already cash-flows at list — no discount required.
- Meets the 1% rule at list price ($1k rent vs $90k).
- Recommended offer: $89k (1.5% below list) — sets the bar for market timing.
- Cap rate 9.7% vs local median 4.6% in Evansville — top-decile yield for the area; either an underpriced asset or a hidden risk that comps aren't pricing in. Stress-test before assuming the spread holds.
Location & tenants
- Location reads 63/100 on livability (#416 in IN) — a middle-class / working-renter tenant base. Strengths: cost of living A+, housing A+, health & safety A+; Watch: crime F, commute F, employment D-.
- Evansville Vanderburgh School Corporation (urban): math 36% / reading 43% proficiency, ranked #153 of 301 in IN (top 51%) — families likely to look elsewhere, expect single-tenant / working-renter base with shorter leases.
- Zoned schools: Cedar Hall Community School (math 13% / reading 19%, grade F, #854 of 994 statewide, top 86%, 509 students, 93% FRL); Central High School (math 38% / reading 74%, grade C, #73 of 369 statewide, top 20%, 1,090 students, 52% FRL) — zoned schools average 72% FRL vs 50% district-wide (23 pts higher); higher-poverty schools than district average — tighter screening recommended.
- Market conditions: 88 active listings in the ZIP; 23 comparable units currently listed for rent nearby; rentals at typical pace (median 21d on market — plan ~3-4 weeks tenant-placement turnaround); 508 units permitted in Vanderburgh County in 2024 (32 in 5+ unit buildings).
Forward outlook
- Local home prices are declining (-3.0%/yr); year-one equity from $622 of loan paydown is wiped out by about $3k of value loss. Plan a longer hold.
- At projected returns (-3.0% appreciation + 3.0% rent growth), your $25k cash investment doubles in ~10 years — after that, you're playing with house money.
Negotiation context
- It's been on market 30 days — a 2% lower offer ($89k) is reasonable based on typical stale-listing flexibility.
- 2 sale attempts with the ask held roughly flat each time — persistent listings suggest the price (not the market) is what's stuck; bring a comps-based counter.
- Current owner paid $15k; list at $90k implies a 499% gain — meaningful room to come down on a strong offer.
Risks & watch-outs
- Watch-outs: built in 1898 — expect roof / HVAC / electrical / plumbing capex.
- Climate carrying-cost: extreme-heat days projected 7→19/yr by 2055 (HVAC capex compounding) — expect insurance premiums to compound above CPI over the hold.
Questions for the listing agent
- Built in 1898 — when were the roof, HVAC, electrical panel, plumbing, and water heater last replaced?
- Is there a deadline driving the sale (1031 exchange, divorce, estate, relocation)? That informs how much negotiation room exists.
- Schools are D-rated, which usually means shorter tenancies and higher turnover. Who's the typical renter profile here, and what's been the actual vacancy rate?
- Crime grade is F in this area — have there been break-ins, vandalism, or insurance claims at this property in the last 3 years? What carrier currently insures it and at what premium?
- What's the average days-on-market for RENTAL listings here right now (not sales)? A rising rental-DOM trend means longer vacancies and softer asking-rent achievability than the comps imply.
- What's the recent tenant-quality profile in this submarket — average credit score on applications, eviction rate, late-payment / NSF rate, and stable-employment percentage? A property-management company in the area should have these aggregated.
- How much new for-sale + rental construction is in the pipeline within 1–3 miles? Heavy new supply typically softens prices + rents 12–24 months out; constrained supply supports both.
Investment metrics
- 1% rule
- 1.14% ✓
- Cap rate
- 9.70%
- Cash-on-cash
- 12.15%
- DSCR
- 1.54
- GRM
- 7.3
CMA / ARV
- ARV (on-the-fly)
- $47,008
- Comps found
- 12
Show comp detail 12 sales within ~0.75 mi
| Address | Dist | Beds/Ba | Sqft | Sold | Price | $/sf | Match |
|---|---|---|---|---|---|---|---|
| 1317 N 3rd Ave | 0.17mi | 2/1.0 | 915 (+1%) | 14mo | $100,000 | $109 | 78 |
| 808 N Fourth Ave | 0.21mi | 2/1.0 | 983 (+9%) | 2mo | $22,000 | $22 | 74 |
| 916 Edgar St | 0.25mi | 2/1.0 | 832 (-8%) | 4mo | $27,000 | $32 | 72 |
| 821 N First Ave | 0.17mi | 2/1.0 | 984 (+9%) | 14mo | $98,000 | $100 | 66 |
| 1031 N Third Ave | 0.04mi | 1/1.0 (-1) | 777 (-14%) | 6mo | $65,000 | $84 | 65 |
| 905 W Tennesee St | 0.23mi | 2/1.0 | 966 (+7%) | 17mo | $49,900 | $52 | 63 |
| 1109 W Georgia St | 0.24mi | 1/1.0 (-1) | 848 (-6%) | 15mo | $10,000 | $12 | 61 |
| 1116 Georgia St | 0.23mi | 2/1.0 | 1,032 (+14%) | 7mo | $40,000 | $39 | 60 |
| 322 W Tennessee St | 0.46mi | 2/1.0 | 864 (-4%) | 14mo | $19,000 | $22 | 60 |
| 16 W Tennessee St | 0.69mi | 2/1.0 | 894 (-1%) | 10mo | $119,000 | $133 | 58 |
| 1021 Grove St | 0.61mi | 2/2.0 | 916 (+1%) | 14mo | $49,900 | $54 | 54 |
| 1516 Uhlhorn St | 0.73mi | 2/1.0 | 784 (-13%) | 9mo | $10,500 | $13 | 37 |
Match score weights: distance 35% · size 25% · config 20% · recency 20%. Top-matched comps best support the ARV.
Projected returns pro-forma
-3.0% appreciation · 3.0% rent growth · sell at horizon
- IRR
- 1.7%
- Equity multiple
- 1.07×
- Total profit
- $1,643
- Equity at exit
- $13,404
- IRR
- 11.3%
- Equity multiple
- 1.88×
- Total profit
- $22,231
- Equity at exit
- $7,773
Cash invested: $25,172 (down + closing). Projections, not guarantees.
Landlord ↔ Tenant lean methodology
- Overall (STATE)
- 90 Strongly Landlord-Friendly
- State Indiana
- 90 Strongly Landlord-Friendly · R+11
- County
- — inherits STATE
- City
- — inherits STATE
ZIP-level market 47710
- Home prices YoY
- -29.7%
- Active inventory
- 88
- Price-to-rent
- 7.3×
Monthly cashflow live
- Estimated rent
- $1,023 high interval (Pro) →
- Mortgage (P&I)
- −$471
- Tax from tax record
- −$45 /mo · $536/yr
- Insurance
- −$37
- HOA
- −$0
- Vacancy / Maint / Mgmt
- −$215
- Net cashflow
- $255
Break-even live
UW: 25.0% down · 7.5% · 30yr · 1.5% tax · 5.0% vac · 8.0% maint · 8.0% mgmt
Financing live
Cash to close
- Down payment
- $22,475
- Closing costs
- $2,697
- Reserves months
- —
- Total cash needed
- —
Loan-product check · same deal, 3 products live
Conventional
25% down · 7.5% · 30yr
- Down + closing
- —
- Monthly P&I
- —
- Monthly cashflow
- —
- DSCR
- —
- Eligible?
- —
Personal DTI + credit; lowest rate.
DSCR
20% down · 8.5% · 30yr
- Down + closing
- —
- Monthly P&I
- —
- Monthly cashflow
- —
- DSCR
- —
- Eligible?
- —
No personal income docs; deal must DSCR.
Hard money
10% down · 12.0% · 12mo
- Down + closing
- —
- Monthly P&I
- —
- Monthly cashflow
- —
- DSCR
- —
- Eligible?
- —
Short-term bridge; refi at stabilization.
Rent comps 23 comps
| Address | Beds | Baths | Sqft | Rent | $/sqft | DOM | Units | Dist |
|---|---|---|---|---|---|---|---|---|
| 1306 W Missouri St Evansville, IN | 2.0 | 1.0 | 800 | $950 | $1.19 | 13d | 1 | 0.34mi |
| 406 Edgar St Unit 1 Evansville, IN | 1.0 | 1.0 | 530 | $1,500 | $2.83 | 21d | 1 | 0.52mi |
| 1018 Baker Ave Unit B Evansville, IN | 1.0 | 1.0 | 800 | $625 | $0.78 | 21d | 1 | 0.61mi |
| 32 W Tennessee St Evansville, IN | 2.0 | 1.0 | 864 | $925 | $1.07 | 13d | 1 | 0.65mi |
| 610 N Main St Evansville, IN | 2.0 | 1.0 | 751 | $675 | $0.90 | 21d | 1 | 0.78mi |
| 109 E Eichel Ave Unit A Evansville, IN | 1.0 | 1.0 | 675 | $745 | $1.10 | 21d | 1 | 0.87mi |
| 200 N Main St Evansville, IN | 2.0 | 1.0–2.0 | 857 | $1,599 | $1.86 | 13d | 7 | 0.87mi |
| 400 NW 5th St Unit 4 Evansville, IN | 2.0 | 1.0 | 792 | $725 | $0.92 | 21d | 1 | 0.88mi |
| 706 Court St Evansville, IN | 2.0 | 1.5 | 1100 | $850 | $0.77 | 21d | 1 | 0.91mi |
| 41 W Division St Unit 101 Evansville, IN | 1.0 | 1.0 | 634 | $1,100 | $1.74 | 21d | 1 | 0.94mi |
| 41 W Division St Apt 200 Evansville, IN | 2.0 | 2.0 | 1083 | $1,500 | $1.39 | 21d | 1 | 0.94mi |
| 2102 W Delaware St Evansville, IN | 3.0 | 1.0 | 1083 | $925 | $0.85 | 13d | 1 | 1.06mi |
| 1900 W Indiana St Evansville, IN | 3.0 | 1.0 | 960 | $995 | $1.04 | 21d | 1 | 1.07mi |
| 24 NW 6th St Apt 103 Evansville, IN | 1.0 | 1.0 | 706 | $1,300 | $1.84 | 21d | 1 | 1.09mi |
| 300 Main St Unit 1 D3 Evansville, IN | 1.0 | 1.0 | 800 | $2,000 | $2.50 | 21d | 1 | 1.19mi |
| 1151 Diamond Pl Evansville, IN | 1.0 | 1.0 | 700 | $780 | $1.11 | 21d | 1 | 1.19mi |
| 329 Main St Evansville, IN | 1.0–2.0 | 1.0–2.0 | 717 | $1,505 | $2.10 | 13d | 1 | 1.20mi |
| 101 SE 2nd St Evansville, IN | 1.0 | 1.0 | 530 | $750 | $1.42 | 13d | 1 | 1.31mi |
| 1008 Allens Ln Evansville, IN | 2.0 | 1.0 | 1081 | $750 | $0.69 | 21d | 1 | 1.32mi |
| 100 SE 1st St Evansville, IN | 1.0–2.0 | 1.0–2.0 | 715 | $1,725 | $2.41 | 13d | 17 | 1.32mi |
| 500 Richardt Ave Evansville, IN | 1.0 | 1.0 | 550 | $700 | $1.27 | 21d | 1 | 1.34mi |
| 202 SE 1st St Evansville, IN | 1.0–2.0 | 1.0 | 926 | $2,449 | $2.64 | 21d | 4 | 1.39mi |
| 322 SE 1st St Evansville, IN | 1.0–2.0 | 1.0 | 1100 | $1,700 | $1.55 | 21d | 6 | 1.49mi |
Listing history 8 events
-
2026-06-18days on market $89,900 Active 30 DOM
-
2026-06-17days on market $89,900 Active 29 DOM
-
2026-06-16remarks 230-char remark
-
2026-06-16statusdays on market $89,900 Active 28 DOM
-
2026-04-29$89,900 Active
-
2025-06-18soldstatus $15,000 Closed 324-char remark
Show marketing remark (324 chars)
GREAT INVESTMENT OPPORTUNITY. Was a 2 BR /1 bath bungalow style home. Structure has 904 sq ft and a 16x22 detached garage with carport. Home was involved in a fire and has everything down to the studs removed. Some clean-up is still needed around the yard and garage area. Property is sold "as-is". Priced to sell!
-
2025-05-15status Pending 324-char remark
Show marketing remark (324 chars)
GREAT INVESTMENT OPPORTUNITY. Was a 2 BR /1 bath bungalow style home. Structure has 904 sq ft and a 16x22 detached garage with carport. Home was involved in a fire and has everything down to the studs removed. Some clean-up is still needed around the yard and garage area. Property is sold "as-is". Priced to sell!
-
2025-05-12$17,500 Active 324-char remark
Show marketing remark (324 chars)
GREAT INVESTMENT OPPORTUNITY. Was a 2 BR /1 bath bungalow style home. Structure has 904 sq ft and a 16x22 detached garage with carport. Home was involved in a fire and has everything down to the studs removed. Some clean-up is still needed around the yard and garage area. Property is sold "as-is". Priced to sell!
ⓘ Source: listings_history table (triggers on properties + properties_extension) + one-shot
backfill from property_details.listing_events for pre-trigger history.
Tax reassessment forecast IN · Partial reset (capped growth)
- Current annual tax
- $536 · $45/mo
- Projected year-2 tax
- $650 · $54/mo
- Expected delta
- +$114/yr (+$10/mo · 21.3%)
ⓘ Screening estimate from a state-policy table — verify with the county assessor before closing.
Climate risk First Street
- Flood 1/10 Low FEMA zone X (unshaded) · 0% chance over 30 yrs
- Wildfire 1/10 Low
- Heat 5/10 Major 7 d/yr ≥106°F today · 19 d/yr by 30 yrs out
- Wind 3/10 Moderate 4% chance of damaging wind over 30 yrs
- Air quality 4/10 Moderate 3 unhealthy d/yr today · 5 by 30 yrs out
Nearby sold comps map
Loading sold comps map…
Walkable amenities ~0.75 mi
Loading nearby amenities…
Taxation est. · year 1
- Rental income
- $12,280
- − Mortgage interest
- −$5,036
- − Property taxes
- −$536
- − Insurance
- −$450
- − Repairs & maintenance
- −$982
- − Management
- −$982
- − Depreciation
- −$2,615
- Taxable income
- $1,679
- Est. tax owed @ 24.0%
- −$403
- After-tax cash flow
- $2,656/yr
For passive investors: Depreciation is non-cash, so a rental often shows a tax loss while cash-flowing — sheltering income. Rental losses are passive: they offset passive income freely, and up to $25,000/yr can offset ordinary (W-2) income if you actively participate and your MAGI is under $100k (phasing out to $0 by $150k); unused losses carry forward. On sale, claimed depreciation is recaptured at up to 25%, and gains may owe capital-gains tax (a 1031 exchange can defer both). Figures are a year-1 estimate at your 24.0% rate — not tax advice; consult a CPA.
Schools (NCES district)
- District
- Evansville Vanderburgh School Corporation
- NCES district ID
- 1803450
- Math proficiency
- 36% ▼ -7.00%
- Reading proficiency
- 43% ▼ -3.00%
- Median HH income
- $43,270
- Composite
- 33.41/100
- National rank
- #5471
- State rank
- #153 of 301 in IN
Livability — Evansville
- Score
- 63/100
- State rank
- #416
- US rank
- #15047
Category grades
Schools grade is shown separately in the Schools card above.
Census & demographics
- Census place
- Evansville, IN
- County
- Vanderburgh County · 146,793 people
- City population
- 146,793
- Metro
- Evansville, IN-KY
- Population (ZIP)
- 18,309
- Household income
- $47,292
- Rent vs Own
- Severe rent burden
- 722.0
Population outlook (Vanderburgh County) Hauer SSP2
- Today (2025)
- 187,038 people
- By 2030
- 188,907 · +1.0%
- By 2040
- 190,272 · +1.7%
- By 2050
- 188,871 · +1.0%
- By 2075
- 180,751 · -3.4%
- By 2100
- 163,015 · -12.8%
Race, ethnicity, and origin ACS 2023
- Neighborhood character
- Predominantly White (83%)
- Race & ethnicity
- White 83% Two or more races 7% Black 6% Hispanic / Latino 4%
- Common ancestry
- Scotch-Irish 2% Lithuanian 1% Slovak 1%
- Foreign-born
- 2% · Canada, China
- Languages at home
- 97% English-only · Spanish 3%
Political lean MEDSL · Vanderburgh
- 2024 margin
- R (+12.7) · D 43.0% · R 55.6% · Other 1.4%
- 2008→2024 swing
- -15.1pp toward R · 2008: 2.5pp · 2024: -12.7pp
- All cycles
- 2024: R+12.7 2020: R+9.6 2016: R+16.9 2012: R+10.8 2008: D+2.5
Not yet ingested
- Civics
- —
Market trends
- HPI YoY
- ▼ -91.84%
- Current HPI
- 217.586
- Rent YoY
- —
- Metro
- Evansville, IN-KY
- State GDP YoY
- ▲ 2.90%
- F500 in state
- 18
Industry mix (Fortune 500 HQ in IN)
| Industry | F500 HQs | Revenue |
|---|---|---|
| Industrial Machinery | 2 | $37B |
|
||
| Healthcare | 1 | $177B |
|
||
| Pharmaceuticals | 1 | $45B |
|
||
| Metals / Steel | 1 | $18B |
|
||
| Agriculture | 1 | $17B |
|
||
| Packaging | 1 | $12B |
|
||
Price history
+413.7% since first listed4 events — show timeline
- 2026-04-29 Listed $89,900 IRMLS
- 2025-06-18 Sold (MLS) $15,000 IRMLS
- 2025-05-15 Pending — IRMLS
- 2025-05-12 Listed $17,500 IRMLS
Property tax history
+4.2%/yrLatest (2024): $536 · +18.5% YoY. Source: county tax records.
Cash-flow waterfall
monthlySold comps — $/sqft
last 12 mo · ≤1 miLoading sold comps…