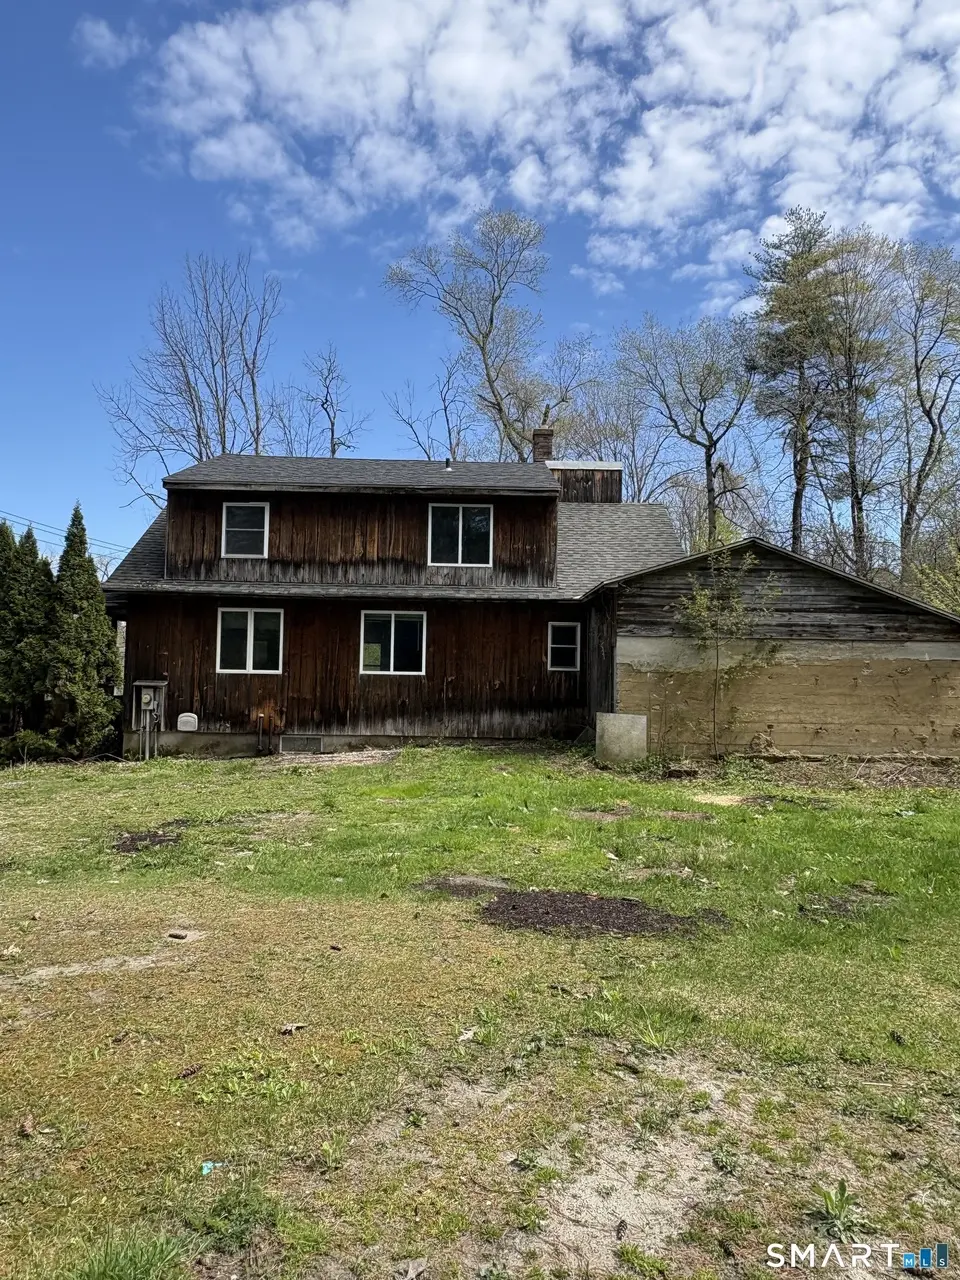
315 Salisbury Rd · Canaan, CT
Flood risk 1/10 · Minimal
- FEMA flood zone
- X (unshaded)
- Chance of flooding over 30 yrs
- 0.0%
- Est. flood insurance / yr
- $473 – $860
Fire risk 3/10 · Minor
- Est. fire insurance / yr
- $829 – $1,539
Heat risk 3/10 · Minor
- Hot days now (above 94°F)
- 7 days/yr
- Hot days in 30 yrs
- 16 days/yr
Wind risk 4/10 · Minor
- Chance of severe wind over 30 yrs
- 16.0%
Air-quality risk 2/10 · Minimal
- Unhealthy air days now
- 1 days/yr
- Unhealthy air days in 30 yrs
- 2 days/yr
Risk factors via First Street. Map © Google.
Why this score? — see what drove the C- grade
The composite is a weighted blend of 9 inputs, each scored 0–100. Each bar is that input's sub-score; the figure is the points it added to the 100-point composite (weight × sub-score).
- ARV discount +15.0/15.0
- Cash flow +10.6/30.0
- Appreciation +6.7/10.0
- Schools +4.2/10.0
- 1% rule +3.8/10.0
- DSCR +3.1/10.0
- Livability +3.1/5.0
- Rent growth +2.5/5.0
- Condition / age +2.5/5.0
$195,000
🖨 Deal sheet (PDF) 📄 Offer letter ✓ Due diligence
Listing remarks
Opportunity knocks! This 2-story Cape Cod is set on . 67 acres and offers strong potential for investors, contractors, "ideal for those looking to add value over time. " Being sold as-is, the home currently offers 3 bedrooms and 1 full bath, while town records reflect 4 bedrooms and 2 baths. The layout has been opened to create a more spacious living area and features a functional floor plan ready for your vision and updates. Interior highlights include some original hardwood flooring and laminate, along with radiant floor heat on the first level. The previous deck has been removed, and exterior improvements are needed-making this an ideal opportunity to customize and add value. A
Key facts
- Radiant floor heat
- Spacious living area
- 2 story cape cod
Tags
Property features AI
Exterior
- Utilities: Public water connected; Septic system
- Home design: Single-family home
- Construction: Frame construction; Wood siding; Asphalt shingle roof; Concrete foundation; Built with living area recorded at 1704 square feet
- Exterior features: Lightly wooded, level and open lot in a subdivision
Interior
- Bedrooms: 3 bedrooms
- Bathrooms: 1 full bathroom
- Heating & cooling: Oil-fired heat; Baseboard, hot water, radiant and radiator heating types; Fuel tank located in the basement
- Interior features: Full basement
- Laundry & utility: Washer/dryer hook-up in the kitchen; Hot water by oil-fired 40-gallon tank
Neighborhood map
What this means for you Summary
Snapshot
- This is a 4-bed/2.0-bath single-family listed at $195k.
Deal economics
- At list price, monthly cash flow is $-95 ($-1k/yr) — negative.
- To cash-flow at today's rent, offer at most $178k (8.6% below list).
- To meet the 1% rule (rent ≥ 1% of price), the offer needs to be $171k (12.2% below list).
- Recommended offer: $171k (12.2% below list) — sets the bar for 1% rule.
- Cap rate 5.7% vs local median 0.7% in Canaan — top-decile yield for the area; either an underpriced asset or a hidden risk that comps aren't pricing in. Stress-test before assuming the spread holds.
Location & tenants
- Location reads 62/100 on livability (#133 in CT) — a middle-class / working-renter tenant base. Strengths: crime A+, cost of living A; Watch: amenities F, commute F, employment F.
- Regional School District 01 (rural): math 30% / reading 60% proficiency, ranked #147 of 192 in CT (top 77%) — families likely to look elsewhere, expect single-tenant / working-renter base with shorter leases.
- Zoned schools: North Canaan Elementary School (math 42% / reading 57%, grade D, #237 of 553 statewide, top 45%, 238 students, 35% FRL); Housatonic Valley Regional High School (math 22% / reading 57%, grade F, #107 of 194 statewide, top 56%, 319 students, 33% FRL) — zoned schools at 34% FRL track the district average.
- Market conditions: 12 active listings in the ZIP; 154 units permitted in Northwest Hills Planning Region in 2024 (6 in 5+ unit buildings).
Forward outlook
- In year one you build about $8k of equity ($1k loan paydown + $7k appreciation (3.5% local appreciation)).
- By year 5, paydown + projected appreciation supports a ~$35k cash-out refi (75% LTV) — recoverable capital for the next deal without selling this one.
Negotiation context
- It's been on market 48 days — a 3% lower offer ($189k) is reasonable based on typical stale-listing flexibility.
- 5 sale attempts since 7y ago with the ask held roughly flat each time — persistent listings suggest the price (not the market) is what's stuck; bring a comps-based counter.
- Current owner paid $87k; list at $195k implies a 124% gain — meaningful room to come down on a strong offer.
Risks & watch-outs
- Watch-outs: built in 1935 — expect roof / HVAC / electrical / plumbing capex.
Questions for the listing agent
- What do current leases actually rent for vs. the listed asking? Can we see a recent rent roll and the last 12 months of T-12 income?
- It's been on market 48 days. Have you received any prior offers? Is the seller open to a 12% concession, seller financing, or rate buy-down credit?
- Built in 1935 — when were the roof, HVAC, electrical panel, plumbing, and water heater last replaced?
- Is there a deadline driving the sale (1031 exchange, divorce, estate, relocation)? That informs how much negotiation room exists.
- What's the average days-on-market for RENTAL listings here right now (not sales)? A rising rental-DOM trend means longer vacancies and softer asking-rent achievability than the comps imply.
- What's the recent tenant-quality profile in this submarket — average credit score on applications, eviction rate, late-payment / NSF rate, and stable-employment percentage? A property-management company in the area should have these aggregated.
- How much new for-sale + rental construction is in the pipeline within 1–3 miles? Heavy new supply typically softens prices + rents 12–24 months out; constrained supply supports both.
Investment metrics
- 1% rule
- 0.88% ✗
- Cap rate
- 5.71%
- Cash-on-cash
- -2.08%
- DSCR
- 0.91
- GRM
- 9.5
CMA / ARV
- ARV (on-the-fly)
- $347,616
- Comps found
- 4
Show comp detail 4 sales within ~0.75 mi
| Address | Dist | Beds/Ba | Sqft | Sold | Price | $/sf | Match |
|---|---|---|---|---|---|---|---|
| 101 Sand Rd | 0.54mi | 4/2.0 | 1,584 (-7%) | 7mo | $310,000 | $196 | 58 |
| 101 Sand Rd | 0.59mi | 3/2.0 (-1) | 1,733 (+2%) | 10mo | $365,000 | $211 | 56 |
| 7 Lawrence Ave | 0.15mi | 3/2.0 (-1) | 1,456 (-15%) | 10mo | $297,000 | $204 | 56 |
| 4 Highland Ln | 0.66mi | 4/2.5 | 1,888 (+11%) | 16mo | $240,000 | $127 | 36 |
Match score weights: distance 35% · size 25% · config 20% · recency 20%. Top-matched comps best support the ARV.
Projected returns pro-forma
3.47% appreciation · 3.0% rent growth · sell at horizon
- IRR
- 7.0%
- Equity multiple
- 1.41×
- Total profit
- $22,395
- Equity at exit
- $92,847
- IRR
- 9.5%
- Equity multiple
- 2.51×
- Total profit
- $82,436
- Equity at exit
- $147,243
Cash invested: $54,600 (down + closing). Projections, not guarantees.
Landlord ↔ Tenant lean methodology
- Overall (STATE)
- 27 Tenant-Leaning
- State Connecticut
- 27 Tenant-Leaning · D+7
- County
- — inherits STATE
- City
- — inherits STATE
ZIP-level market 06018
- Home prices YoY
- 1.2%
- Active inventory
- 12
- Price-to-rent
- 9.5×
Monthly cashflow live
- Estimated rent
- $1,711 medium interval (Pro) →
- Mortgage (P&I)
- −$1,023
- Tax from tax record
- −$343 /mo · $4,116/yr
- Insurance
- −$81
- HOA
- −$0
- Vacancy / Maint / Mgmt
- −$359
- Net cashflow
- $-95
Break-even live
Sensitivity live
| Price | -10% $16 | -5% $-40 | +0% $-95 | +5% $-150 | +10% $-205 |
|---|---|---|---|---|---|
| Rent | -10% $-230 | -5% $-162 | +0% $-95 | +5% $-27 | +10% $40 |
| Rate | -1.0pp $3 | -0.5pp $-45 | base $-95 | +0.5pp $-145 | +1.0pp $-197 |
UW: 25.0% down · 7.5% · 30yr · 1.5% tax · 5.0% vac · 8.0% maint · 8.0% mgmt
Financing live
Cash to close
- Down payment
- $48,750
- Closing costs
- $5,850
- Reserves months
- —
- Total cash needed
- —
Loan-product check · same deal, 3 products live
Conventional
25% down · 7.5% · 30yr
- Down + closing
- —
- Monthly P&I
- —
- Monthly cashflow
- —
- DSCR
- —
- Eligible?
- —
Personal DTI + credit; lowest rate.
DSCR
20% down · 8.5% · 30yr
- Down + closing
- —
- Monthly P&I
- —
- Monthly cashflow
- —
- DSCR
- —
- Eligible?
- —
No personal income docs; deal must DSCR.
Hard money
10% down · 12.0% · 12mo
- Down + closing
- —
- Monthly P&I
- —
- Monthly cashflow
- —
- DSCR
- —
- Eligible?
- —
Short-term bridge; refi at stabilization.
Listing history 27 events
-
2026-06-17status $195,000 Under Contract 48 DOM
-
2026-06-16days on market $195,000 Active 48 DOM
-
2026-06-15days on market $195,000 Active 47 DOM
-
2026-06-13days on market $195,000 Active 45 DOM
-
2026-06-12days on market $195,000 Active 44 DOM
-
2026-06-10days on market $195,000 Active 42 DOM
-
2026-06-09days on market $195,000 Active 41 DOM
-
2026-06-08days on market $195,000 Active 40 DOM
-
2026-06-07days on market $195,000 Active 39 DOM
-
2026-06-07days on market $195,000 Active 38 DOM
-
2026-06-05days on market $195,000 Active 36 DOM
-
2026-06-03days on market $195,000 Active 35 DOM
-
2026-06-02days on market $195,000 Active 34 DOM
-
2026-06-01days on market $195,000 Active 33 DOM
-
2026-05-31days on market $195,000 Active 32 DOM
-
2026-05-30days on market $195,000 Active 31 DOM
-
2026-04-29$195,000 Active
-
2019-09-30historical
-
2019-08-17status Active
-
2019-07-26historical
-
2019-05-24price $79,000
-
2019-05-08status Active
-
2019-04-30historical Under Contract - Continue to Show
-
2019-04-27status Active
-
2019-04-05historical Under Contract - Continue to Show
-
2019-03-20$89,000 Active
-
1998-06-01soldstatus $87,000
ⓘ Source: listings_history table (triggers on properties + properties_extension) + one-shot
backfill from property_details.listing_events for pre-trigger history.
Tax reassessment forecast CT · Partial reset (capped growth)
- Current annual tax
- $4,116 · $343/mo
- Projected year-2 tax
- $4,144 · $345/mo
- Expected delta
- +$28/yr (+$2/mo · 0.7%)
ⓘ Screening estimate from a state-policy table — verify with the county assessor before closing.
Climate risk First Street
- Flood 1/10 Low FEMA zone X (unshaded) · 0% chance over 30 yrs
- Wildfire 3/10 Moderate
- Heat 3/10 Moderate 7 d/yr ≥94°F today · 16 d/yr by 30 yrs out
- Wind 4/10 Moderate 16% chance of damaging wind over 30 yrs
- Air quality 2/10 Low 1 unhealthy d/yr today · 2 by 30 yrs out
Nearby sold comps map
Loading sold comps map…
Walkable amenities ~0.75 mi
Loading nearby amenities…
Taxation est. · year 1
- Rental income
- $20,537
- − Mortgage interest
- −$10,923
- − Property taxes
- −$4,116
- − Insurance
- −$975
- − Repairs & maintenance
- −$1,643
- − Management
- −$1,643
- − Depreciation
- −$5,673
- Taxable loss
- −$4,436
- Est. tax savings @ 24.0%
- +$1,065
- After-tax cash flow
- $-73/yr
For passive investors: Depreciation is non-cash, so a rental often shows a tax loss while cash-flowing — sheltering income. Rental losses are passive: they offset passive income freely, and up to $25,000/yr can offset ordinary (W-2) income if you actively participate and your MAGI is under $100k (phasing out to $0 by $150k); unused losses carry forward. On sale, claimed depreciation is recaptured at up to 25%, and gains may owe capital-gains tax (a 1031 exchange can defer both). Figures are a year-1 estimate at your 24.0% rate — not tax advice; consult a CPA.
Schools (NCES district)
- District
- Regional School District 01
- NCES district ID
- 0903600
- Math proficiency
- 30% ▬ 0.00%
- Reading proficiency
- 60% ▬ 0.00%
- Median HH income
- $66,599
- Composite
- 42.38/100
- National rank
- #6926
- State rank
- #147 of 192 in CT
Livability — Canaan
- Score
- 62/100
- State rank
- #133
- US rank
- #16567
Category grades
Schools grade is shown separately in the Schools card above.
Census & demographics
- Population (ZIP)
- 2,630
Population outlook (Northwest Hills County) Hauer SSP2
- By 2040
- 118,998
Race, ethnicity, and origin ACS 2023
- Neighborhood character
- Predominantly White (81%)
- Race & ethnicity
- White 81% Hispanic / Latino 14% Two or more races 8%
- Hispanic origin (detail)
- Mexican 11%
- Common ancestry
- Lithuanian 8% Romanian 6% Slovak 5%
- Foreign-born
- 8% · Canada
- Languages at home
- 87% English-only · Spanish 10% Other Indo-European 2% French/Haitian/Cajun 1%
Political lean MEDSL · Northwest Hills
- 2024 margin
- Toss-up / Even · D 48.6% · R 49.9% · Other 1.6%
- All cycles
- 2024: R+1.3
Not yet ingested
- Civics
- —
Market trends
- HPI YoY
- ▲ 3.47%
- Current HPI
- 292.5433
- Rent YoY
- —
- Metro
- —
- State GDP YoY
- ▲ 1.06%
- F500 in state
- 38
Industry mix (Fortune 500 HQ in CT)
| Industry | F500 HQs | Revenue |
|---|---|---|
| Industrial Machinery | 4 | $38B |
|
||
| Insurance | 3 | $71B |
|
||
| Financial Services | 2 | $25B |
|
||
| Transportation / Logistics | 2 | $18B |
|
||
| Healthcare | 1 | $247B |
|
||
| Telecommunications | 1 | $55B |
|
||
Price history
+124.1% since first listed11 events — show timeline
- 2026-04-29 Listed $195,000 Smart MLS
- 2019-09-30 Listing Removed — Smart MLS
- 2019-08-17 Relisted — Smart MLS
- 2019-07-26 Listing Removed — Smart MLS
- 2019-05-24 Price Changed $79,000 Smart MLS
- 2019-05-08 Relisted — Smart MLS
- 2019-04-30 Contingent — Smart MLS
- 2019-04-27 Relisted — Smart MLS
- 2019-04-05 Contingent — Smart MLS
- 2019-03-20 Listed $89,000 Smart MLS
- 1998-06-01 Sold (Public Records) $87,000 Public Records
Property tax history
+3.4%/yrLatest (2023): $4,116 · +15.7% YoY. Source: county tax records.
Cash-flow waterfall
monthlySold comps — $/sqft
last 12 mo · ≤1 miLoading sold comps…