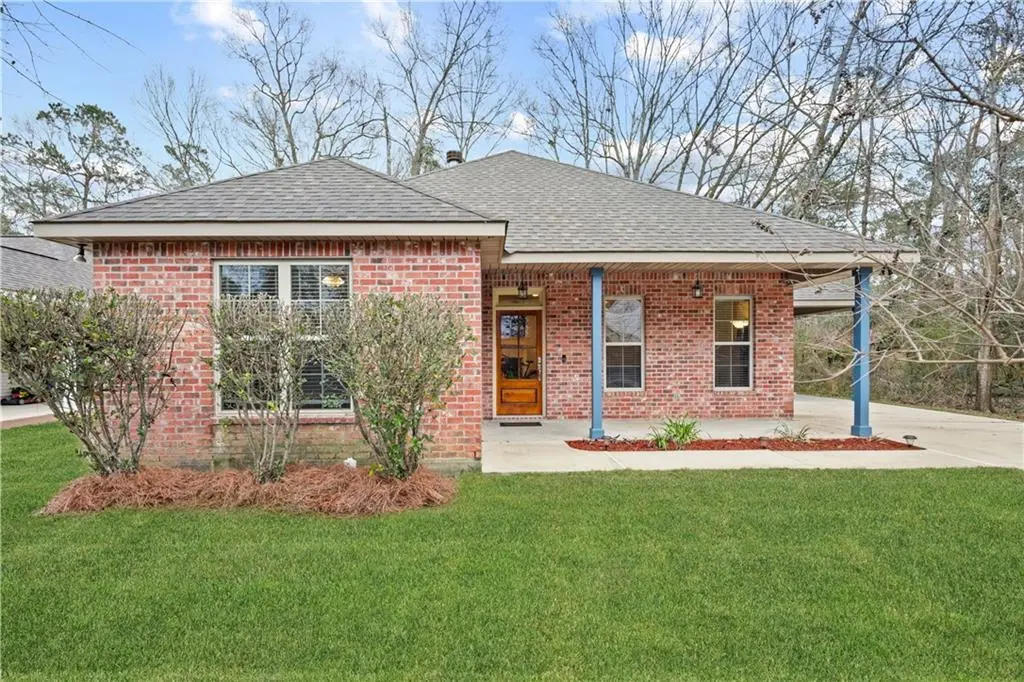
126 Inspiration Ln · Covington, LA
Flood risk 1/10 · Minimal
- FEMA flood zone
- X
- Chance of flooding over 30 yrs
- 0.0%
- Est. flood insurance / yr
- $507 – $1,088
Fire risk 4/10 · Minor
- Est. fire insurance / yr
- $1,269 – $2,357
Heat risk 9/10 · Severe
- Hot days now (above 109°F)
- 7 days/yr
- Hot days in 30 yrs
- 21 days/yr
Wind risk 9/10 · Severe
- Chance of severe wind over 30 yrs
- 99.0%
Air-quality risk 2/10 · Minimal
- Unhealthy air days now
- 0 days/yr
- Unhealthy air days in 30 yrs
- 1 days/yr
Risk factors via First Street. Map © Google.
Why this score? — see what drove the D- grade
The composite is a weighted blend of 9 inputs, each scored 0–100. Each bar is that input's sub-score; the figure is the points it added to the 100-point composite (weight × sub-score).
- Cash flow +10.9/30.0
- ARV discount +7.9/15.0
- Schools +4.3/10.0
- Livability +3.8/5.0
- Rent growth +3.6/5.0
- DSCR +3.2/10.0
- Condition / age +2.5/5.0
- 1% rule +2.3/10.0
- Appreciation +0.0/10.0
$275,000
🖨 Deal sheet (PDF) 📄 Offer letter ✓ Due diligence
Listing remarks MLS
Welcome to your dream home! This charming 3-bedroom, 2-bath gem is nestled on a quiet dead-end street, offering both privacy and comfort. The thoughtfully designed floor plan features an oversized kitchen that flows seamlessly into the dining area--great for hosting gatherings or enjoying meals. Step outside to the spacious backyard, complete with a storage shed for all your extras. Conveniently located just minutes from downtown Covington, you'll have easy access to fantastic shopping, dining, and top-rated schools. Don't miss the chance to make this wonderful home yours!
Key facts
- Spacious backyard
- Oversized kitchen
- Storage shed
Tags
Neighborhood map
What this means for you Summary
Snapshot
- This is a 3-bed/2.0-bath single-family listed at $275k.
Deal economics
- At list price, monthly cash flow is $-119 ($-1k/yr) — negative.
- To cash-flow at today's rent, offer at most $254k (7.6% below list).
- To meet the 1% rule (rent ≥ 1% of price), the offer needs to be $200k (27.2% below list).
- Recommended offer: $200k (27.2% below list) — sets the bar for 1% rule.
- Cap rate 5.8% vs local median 3.9% in Covington — top-decile yield for the area; either an underpriced asset or a hidden risk that comps aren't pricing in. Stress-test before assuming the spread holds.
Location & tenants
- Location reads 75/100 on livability (#17 in LA, #3,876 nationally) — a middle-class / working-renter tenant base. Strengths: employment A+, housing A+, health & safety A+; Watch: amenities F, commute F.
- St. Tammany Parish (suburban): math 43% / reading 55% proficiency, ranked #11 of 98 in LA (top 11%) — families likely to look elsewhere, expect single-tenant / working-renter base with shorter leases.
- Zoned schools: Covington Elementary School (math 52% / reading 52%, grade C-, #108 of 646 statewide, top 18%, 628 students, 59% FRL); Pine View Middle School (math 20% / reading 37%, grade F, #119 of 218 statewide, top 57%, 635 students, 62% FRL); Covington High School (math 32% / reading 44%, grade F, #90 of 265 statewide, top 34%, 1,660 students, 46% FRL) — zoned schools average 56% FRL vs 40% district-wide (16 pts higher); higher-poverty schools than district average — tighter screening recommended.
- Market conditions: Rents rising fast (+4.3%/yr); 530 active listings in the ZIP; 17 comparable units currently listed for rent nearby; rentals at typical pace (median 26d on market — plan ~3-4 weeks tenant-placement turnaround); 47% of comp listings sitting > 30 days — soft ceiling on asking rent; solid renter incomes; 1,064 units permitted in St. Tammany Parish in 2024 (0 in 5+ unit buildings).
Forward outlook
- Local home prices are declining (-3.0%/yr); year-one equity from $2k of loan paydown is wiped out by about $8k of value loss. Plan a longer hold.
- St. Tammany County population projected at +27% by 2050 — long-run rental-demand tailwind backs the buy-and-hold thesis.
Negotiation context
- It's been on market 69 days — a 6% lower offer ($258k) is reasonable based on typical stale-listing flexibility.
- 6 sale attempts since 13y ago with the ask held roughly flat each time — persistent listings suggest the price (not the market) is what's stuck; bring a comps-based counter.
- Current owner paid $214k; 28% above their basis — modest negotiation headroom, anchor on the comps not their cost.
Risks & watch-outs
- Climate carrying-cost: severe wind risk, 99% chance of damaging wind over 30y; extreme-heat days projected 7→21/yr by 2055 (HVAC capex compounding) — expect insurance premiums to compound above CPI over the hold.
Questions for the listing agent
- What do current leases actually rent for vs. the listed asking? Can we see a recent rent roll and the last 12 months of T-12 income?
- It's been on market 69 days. Have you received any prior offers? Is the seller open to a 27% concession, seller financing, or rate buy-down credit?
- Why hasn't it sold? Are there any deal-killer items the seller is aware of (foundation, flood, title, zoning, code violations)?
- Is there a deadline driving the sale (1031 exchange, divorce, estate, relocation)? That informs how much negotiation room exists.
- Schools are B-rated — typically a magnet for longer-tenancy family renters. What's the average tenant stay here, and is there a school-zone premium baked into asking?
- The area grade is low — what's the realistic commute time and amenity access for the typical tenant pool here? Any planned neighborhood developments (good or bad) we should know about?
- What's the average days-on-market for RENTAL listings here right now (not sales)? A rising rental-DOM trend means longer vacancies and softer asking-rent achievability than the comps imply.
- What's the recent tenant-quality profile in this submarket — average credit score on applications, eviction rate, late-payment / NSF rate, and stable-employment percentage? A property-management company in the area should have these aggregated.
- How much new for-sale + rental construction is in the pipeline within 1–3 miles? Heavy new supply typically softens prices + rents 12–24 months out; constrained supply supports both.
Investment metrics
- 1% rule
- 0.73% ✗
- Cap rate
- 5.78%
- Cash-on-cash
- -1.85%
- DSCR
- 0.92
- GRM
- 11.5
CMA / ARV
- ARV (median comp)
- $277,700
- List price
- $275,000
- Delta
- -0.97%
- Verdict
- FAIR
- Comps
- 20 within 1.0 mi
Show comp detail 12 sales within ~0.75 mi
| Address | Dist | Beds/Ba | Sqft | Sold | Price | $/sf | Match |
|---|---|---|---|---|---|---|---|
| 126 Inspiration Ln | 0.00mi | 3/2.0 | 1,641 (0%) | 1mo | $260,000 | $158 | 99 |
| 18 Pecan Grove Ct | 0.16mi | 3/2.0 | 1,675 (+2%) | 0mo | $276,000 | $165 | 89 |
| 401 Inspiration Ln | 0.14mi | 3/2.0 | 1,738 (+6%) | 2mo | $250,000 | $144 | 81 |
| 513 Somerset Ct | 0.31mi | 3/2.0 | 1,714 (+4%) | 5mo | $345,000 | $201 | 74 |
| 417 Millstone Ct | 0.26mi | 3/2.0 | 1,768 (+8%) | 2mo | $322,000 | $182 | 73 |
| 1020 W 19th Ave | 0.63mi | 3/2.5 | 1,698 (+4%) | 3mo | $272,000 | $160 | 60 |
| 1108 W 16th Ave | 0.62mi | 3/2.0 | 1,727 (+5%) | 2mo | $287,000 | $166 | 60 |
| 527 S Filmore St | 0.72mi | 3/2.0 | 1,554 (-5%) | 0mo | $249,000 | $160 | 58 |
| 306 Autumn Woods Dr | 0.36mi | 3/2.0 | 1,856 (+13%) | 7mo | $320,000 | $172 | 55 |
| 428 N Pierce St | 0.68mi | 4/2.0 (+1) | 1,487 (-9%) | 1mo | $190,000 | $128 | 47 |
| 1017 W 23rd Ave | 0.65mi | 3/2.0 | 1,424 (-13%) | 4mo | $255,000 | $179 | 44 |
| 1028 W 23rd Ave | 0.64mi | 4/2.0 (+1) | 1,865 (+14%) | 5mo | $290,000 | $155 | 38 |
Match score weights: distance 35% · size 25% · config 20% · recency 20%. Top-matched comps best support the ARV.
Projected returns pro-forma
-3.0% appreciation · 4.31% rent growth · sell at horizon
- IRR
- -18.1%
- Equity multiple
- 0.36×
- Total profit
- $-49,538
- Equity at exit
- $41,003
- IRR
- -8.3%
- Equity multiple
- 0.45×
- Total profit
- $-41,984
- Equity at exit
- $23,777
Cash invested: $77,000 (down + closing). Projections, not guarantees.
Landlord ↔ Tenant lean methodology
- Overall (STATE)
- 90 Strongly Landlord-Friendly
- State Louisiana
- 90 Strongly Landlord-Friendly · R+12
- County
- — inherits STATE
- City
- — inherits STATE
ZIP-level market 70433
- Rents YoY
- 4.3%
- Active inventory
- 530
- Price-to-rent
- 11.5×
Monthly cashflow live
- Estimated rent
- $2,001 high interval (Pro) →
- Mortgage (P&I)
- −$1,442
- Tax from tax record
- −$143 /mo · $1,712/yr
- Insurance
- −$115
- HOA
- −$0
- Vacancy / Maint / Mgmt
- −$420
- Net cashflow
- $-119
Break-even live
Sensitivity live
| Price | -10% $37 | -5% $-41 | +0% $-119 | +5% $-196 | +10% $-274 |
|---|---|---|---|---|---|
| Rent | -10% $-277 | -5% $-198 | +0% $-119 | +5% $-40 | +10% $39 |
| Rate | -1.0pp $20 | -0.5pp $-49 | base $-119 | +0.5pp $-190 | +1.0pp $-262 |
UW: 25.0% down · 7.5% · 30yr · 1.5% tax · 5.0% vac · 8.0% maint · 8.0% mgmt
Financing live
Cash to close
- Down payment
- $68,750
- Closing costs
- $8,250
- Reserves months
- —
- Total cash needed
- —
Loan-product check · same deal, 3 products live
Conventional
25% down · 7.5% · 30yr
- Down + closing
- —
- Monthly P&I
- —
- Monthly cashflow
- —
- DSCR
- —
- Eligible?
- —
Personal DTI + credit; lowest rate.
DSCR
20% down · 8.5% · 30yr
- Down + closing
- —
- Monthly P&I
- —
- Monthly cashflow
- —
- DSCR
- —
- Eligible?
- —
No personal income docs; deal must DSCR.
Hard money
10% down · 12.0% · 12mo
- Down + closing
- —
- Monthly P&I
- —
- Monthly cashflow
- —
- DSCR
- —
- Eligible?
- —
Short-term bridge; refi at stabilization.
Rent comps 17 comps
| Address | Beds | Baths | Sqft | Rent | $/sqft | DOM | Units | Dist |
|---|---|---|---|---|---|---|---|---|
| 312 N Buchanan St Covington, LA | 3.0 | 2.0 | 1100 | $1,600 | $1.45 | 45d | 1 | 0.57mi |
| 2000 Pine Crest Ave Covington, LA | 2.0–4.0 | 2.0 | 1121 | $1,411 | $1.26 | 25d | 1 | 0.81mi |
| 719 W 18th Ave Covington, LA | 3.0 | 3.0 | 1926 | $3,600 | $1.87 | 13d | 1 | 0.84mi |
| 715 W 18th Ave Covington, LA | 3.0 | 3.0 | 1926 | $3,600 | $1.87 | 13d | 1 | 0.86mi |
| 619 W 25th Ave Covington, LA | 3.0 | 2.0 | 1200 | $1,700 | $1.42 | 45d | 1 | 0.95mi |
| 910 W 11th Ave Covington, LA | 3.0 | 2.0 | 1200 | $1,600 | $1.33 | 45d | 1 | 0.97mi |
| 720 N Tyler St Covington, LA | 3.0 | 2.0 | 1336 | $1,500 | $1.12 | 45d | 1 | 1.02mi |
| 1016 Ronald Reagan Hwy Covington, LA | 1.0–3.0 | 1.0–2.0 | 1081 | $1,745 | $1.61 | 3d | 24 | 1.04mi |
| 313 W 20th Ave Covington, LA | 2.0 | 2.0 | 1200 | $1,600 | $1.33 | 25d | 1 | 1.11mi |
| 17361 Regina Coeli Rd Covington, LA | 2.0 | 1.5 | 1100 | $1,350 | $1.23 | 25d | 1 | 1.17mi |
| 19638 Calden CT Covington, LA | 3.0 | 2.0 | 1451 | $2,250 | $1.55 | 25d | 1 | 1.26mi |
| 19638 Calden CT Covington, LA | 3.0 | 2.0 | 1451 | $2,250 | $1.55 | 12d | 1 | 1.26mi |
| 19690 Calden CT Covington, LA | 4.0 | 2.5 | 1826 | $2,300 | $1.26 | 45d | 1 | 1.26mi |
| 209 W 31st Ave Covington, LA | 3.0 | 2.0 | 1100 | $1,450 | $1.32 | 16d | 1 | 1.37mi |
| 222 W 9th Ave Covington, LA | 2.0 | 2.0 | 1229 | $1,600 | $1.30 | 45d | 1 | 1.40mi |
| 217 W 9th Ave Covington, LA | 2.0 | 2.5 | 1400 | $1,550 | $1.11 | 45d | 1 | 1.43mi |
| 215 W 9th Ave Covington, LA | 2.0 | 2.5 | 1100 | $1,500 | $1.36 | 45d | 1 | 1.43mi |
Listing history 14 events
-
2026-05-07status Pending 579-char remark
Show marketing remark (584 chars)
Welcome to your dream home! This charming 3-bedroom, 2-bath gem is nestled on a quiet dead-end street, offering both privacy and comfort. The thoughtfully designed floor plan features an oversized kitchen that flows seamlessly into the dining area—great for hosting gatherings or enjoying meals. Step outside to the spacious backyard, complete with a storage shed for all your extras. Conveniently located just minutes from downtown Covington, you'll have easy access to fantastic shopping, dining, and top-rated schools. Don't miss the chance to make this wonderful home yours!
-
2026-05-07status Pending 584-char remark
Show marketing remark (584 chars)
Welcome to your dream home! This charming 3-bedroom, 2-bath gem is nestled on a quiet dead-end street, offering both privacy and comfort. The thoughtfully designed floor plan features an oversized kitchen that flows seamlessly into the dining area—great for hosting gatherings or enjoying meals. Step outside to the spacious backyard, complete with a storage shed for all your extras. Conveniently located just minutes from downtown Covington, you'll have easy access to fantastic shopping, dining, and top-rated schools. Don't miss the chance to make this wonderful home yours!
-
2026-02-27$275,000 Active 579-char remark
Show marketing remark (584 chars)
Welcome to your dream home! This charming 3-bedroom, 2-bath gem is nestled on a quiet dead-end street, offering both privacy and comfort. The thoughtfully designed floor plan features an oversized kitchen that flows seamlessly into the dining area—great for hosting gatherings or enjoying meals. Step outside to the spacious backyard, complete with a storage shed for all your extras. Conveniently located just minutes from downtown Covington, you'll have easy access to fantastic shopping, dining, and top-rated schools. Don't miss the chance to make this wonderful home yours!
-
2026-02-27$275,000 Active 584-char remark
Show marketing remark (584 chars)
Welcome to your dream home! This charming 3-bedroom, 2-bath gem is nestled on a quiet dead-end street, offering both privacy and comfort. The thoughtfully designed floor plan features an oversized kitchen that flows seamlessly into the dining area—great for hosting gatherings or enjoying meals. Step outside to the spacious backyard, complete with a storage shed for all your extras. Conveniently located just minutes from downtown Covington, you'll have easy access to fantastic shopping, dining, and top-rated schools. Don't miss the chance to make this wonderful home yours!
-
2019-07-08soldstatus $214,500
-
2019-06-21soldstatus $214,500 Closed
-
2019-05-22status Pending
-
2019-05-09price $207,000
-
2019-04-27$207,000
-
2019-04-27$214,000 Active
-
2014-01-10soldstatus $182,000
-
2013-09-16$178,800
-
2013-09-16$178,800
-
2013-05-03soldstatus $71,000
ⓘ Source: listings_history table (triggers on properties + properties_extension) + one-shot
backfill from property_details.listing_events for pre-trigger history.
Tax reassessment forecast LA · Resets to sale price
- Current annual tax
- $1,712 · $143/mo
- Projected year-2 tax
- $1,712 · $143/mo
- Expected delta
- $0/yr ($0/mo · 0.0%)
ⓘ Screening estimate from a state-policy table — verify with the county assessor before closing.
Climate risk First Street
- Flood 1/10 Low FEMA zone X · 0% chance over 30 yrs
- Wildfire 4/10 Moderate
- Heat 9/10 Extreme 7 d/yr ≥109°F today · 21 d/yr by 30 yrs out
- Wind 9/10 Extreme 99% chance of damaging wind over 30 yrs
- Air quality 2/10 Low 0 unhealthy d/yr today · 1 by 30 yrs out
Nearby sold comps map
Loading sold comps map…
Walkable amenities ~0.75 mi
Loading nearby amenities…
Taxation est. · year 1
- Rental income
- $24,012
- − Mortgage interest
- −$15,404
- − Property taxes
- −$1,712
- − Insurance
- −$1,375
- − Repairs & maintenance
- −$1,921
- − Management
- −$1,921
- − Depreciation
- −$8,000
- Taxable loss
- −$6,322
- Est. tax savings @ 24.0%
- +$1,517
- After-tax cash flow
- $94/yr
For passive investors: Depreciation is non-cash, so a rental often shows a tax loss while cash-flowing — sheltering income. Rental losses are passive: they offset passive income freely, and up to $25,000/yr can offset ordinary (W-2) income if you actively participate and your MAGI is under $100k (phasing out to $0 by $150k); unused losses carry forward. On sale, claimed depreciation is recaptured at up to 25%, and gains may owe capital-gains tax (a 1031 exchange can defer both). Figures are a year-1 estimate at your 24.0% rate — not tax advice; consult a CPA.
Schools (NCES district)
- District
- St. Tammany Parish
- NCES district ID
- 2201650
- Math proficiency
- 43% ▼ -32.00%
- Reading proficiency
- 55% ▼ -26.00%
- Median HH income
- $61,752
- Composite
- 43.04/100
- National rank
- #3098
- State rank
- #11 of 98 in LA
Livability — Covington
- Score
- 75/100
- State rank
- #17
- US rank
- #3876
Category grades
Schools grade is shown separately in the Schools card above.
Census & demographics
- Census place
- Covington, LA
- County
- Saint Tammany Parish · 228,296 people
- City population
- 64,351
- Metro
- New Orleans-Metairie, LA
- Population (ZIP)
- 41,876
- Household income
- $81,241
- Rent vs Own
- Severe rent burden
- 1287.0
Population outlook (St. Tammany County) Hauer SSP2
- Today (2025)
- 286,725 people
- By 2030
- 304,175 · +6.1%
- By 2040
- 336,203 · +17.3%
- By 2050
- 364,590 · +27.2%
- By 2075
- 433,362 · +51.1%
- By 2100
- 470,333 · +64.0%
Race, ethnicity, and origin ACS 2023
- Neighborhood character
- Predominantly White (78%)
- Race & ethnicity
- White 78% Black 9% Hispanic / Latino 7% Two or more races 7% Native American 1% Asian 1%
- Hispanic origin (detail)
- Mexican 2%
- Common ancestry
- Lithuanian 17% Italian 2% Slovak 2%
- Foreign-born
- 5% · Canada, Vietnam
- Languages at home
- 92% English-only · Spanish 5% French/Haitian/Cajun 1% Vietnamese 1%
Political lean MEDSL · St. Tammany
- 2024 margin
- Solid R (+43.8) · D 27.3% · R 71.1% · Other 1.6%
- 2008→2024 swing
- +9.6pp toward D · 2008: -53.4pp · 2024: -43.8pp
- All cycles
- 2024: R+43.8 2020: R+44.2 2016: R+50.8 2012: R+52.2 2008: R+53.4
Not yet ingested
- Civics
- —
Market trends
- HPI YoY
- ▼ -112.14%
- Current HPI
- 181.8348
- Rent YoY
- ▲ 4.31%
- Metro
- New Orleans-Metairie, LA
- State GDP YoY
- ▲ 3.29%
- F500 in state
- 10
Industry mix (Fortune 500 HQ in LA)
| Industry | F500 HQs | Revenue |
|---|---|---|
| Telecommunications | 2 | $23B |
|
||
| Utilities | 1 | $12B |
|
||
| Wholesale / Distribution | 1 | $5B |
|
||
| Advertising | 1 | $2B |
|
||
Price history
+287.3% since first listed14 events — show timeline
- 2026-05-07 Pending — AcadianaMLS
- 2026-05-07 Pending — GSREIN
- 2026-02-27 Listed $275,000 GSREIN
- 2026-02-27 Listed $275,000 AcadianaMLS
- 2019-07-08 Sold (Public Records) $214,500 Public Records
- 2019-06-21 Sold (MLS) $214,500 GSREIN
- 2019-05-22 Pending — GSREIN
- 2019-05-09 Price Changed $207,000 GSREIN
- 2019-04-27 Listed $214,000 GSREIN
- 2019-04-27 Listed $207,000 AcadianaMLS
- 2014-01-10 Sold (MLS) $182,000 GSREIN
- 2013-09-16 Listed $178,800 AcadianaMLS
- 2013-09-16 Listed $178,800 GSREIN
- 2013-05-03 Sold (Public Records) $71,000 Public Records
Property tax history
-1.3%/yrLatest (2025): $1,712 · -3.7% YoY. Source: county tax records.
Cash-flow waterfall
monthlySold comps — $/sqft
last 12 mo · ≤1 miLoading sold comps…