315 Nice Ct · North Merritt Island, FL
Flood risk 9/10 · Severe
- FEMA flood zone
- X (shaded)
- Chance of flooding over 30 yrs
- 0.99%
- Est. flood insurance / yr
- $507 – $1,088
Fire risk 3/10 · Minor
- Est. fire insurance / yr
- $947 – $1,759
Heat risk 10/10 · Severe
- Hot days now (above 105°F)
- 7 days/yr
- Hot days in 30 yrs
- 22 days/yr
Wind risk 10/10 · Severe
- Chance of severe wind over 30 yrs
- 99.0%
Air-quality risk 2/10 · Minimal
- Unhealthy air days now
- 1 days/yr
- Unhealthy air days in 30 yrs
- 1 days/yr
Risk factors via First Street. Map © Google.
Why this score? — see what drove the C grade
The composite is a weighted blend of 9 inputs, each scored 0–100. Each bar is that input's sub-score; the figure is the points it added to the 100-point composite (weight × sub-score).
- Cash flow +25.1/30.0
- DSCR +8.2/10.0
- ARV discount +7.5/15.0
- 1% rule +6.1/10.0
- Schools +4.7/10.0
- Rent growth +3.0/5.0
- Livability +2.5/5.0
- Condition / age +2.5/5.0
- Appreciation +0.0/10.0
$223,000
🖨 Deal sheet 📄 Offer letter ✓ Due diligence
Listing remarks MLS
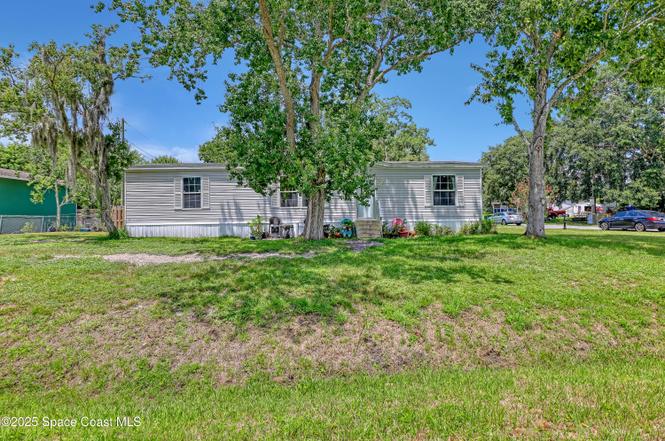
Cleared corner lot, ready to put your manufactured home. Power available and on City Water. Just minutes away from the Space Center.
Key facts
- 9,148 sq ft lot
- Built 2022
- Listed 324 days
Property features AI
Exterior
- Parking: Off-street parking
- Utilities: Septic tank; Water connected; Electricity connected; Cable available
- Home design: Manufactured home; One story; Entry level: 1; East-facing
- Construction: Frame construction with vinyl siding; Shingle roof; Built as manufactured/residential; Living area approximately 1,512
- Exterior features: Front porch; Side porch; Chain link fencing; Corner lot; Asphalt road access
Interior
- Kitchen: Dishwasher; Electric range; Refrigerator
- Bedrooms: 3 bedrooms
- Flooring: Laminate flooring
- Bathrooms: 2 full bathrooms
- Heating & cooling: Central heating (electric); Central air conditioning (electric)
- Interior features: Ceiling fans; Kitchen island; Open floor plan; Split bedroom layout; Walk-in closet(s)
- Laundry & utility: In-unit washer and dryer; Electric water heater
Neighborhood map
What this means for you Summary
Snapshot
- This is a 3-bed/1.0-bath manufactured listed at $223k.
Deal economics
- At list price, monthly cash flow is $428 ($5k/yr) — positive.
- The deal already cash-flows at list — no discount required.
- Meets the 1% rule at list price ($2k rent vs $223k).
- Recommended offer: $196k (12.0% below list) — sets the bar for market timing.
Location & tenants
- Location reads: area grade C — affects rentability + tenant quality, not the cash-flow math above.
- Brevard (suburban): math 53% / reading 57% proficiency, ranked #19 of 73 in FL (top 26%) — acceptable for families but not a draw, mixed tenant base, ~2y average lease.
- Zoned schools: Lewis Carroll Elementary School (math 72% / reading 70%, grade A-, #320 of 2,144 statewide, top 15%, 626 students, 38% FRL); Thomas Jefferson Middle School (math 63% / reading 55%, grade B, #144 of 571 statewide, top 26%, 608 students, 43% FRL); Merritt Island High School (math 32% / reading 55%, grade F, #248 of 667 statewide, top 38%, 1,546 students, 35% FRL) — zoned schools at 39% FRL track the district average.
- Market conditions: Rents rising (+2.1%/yr); 219 active listings in the ZIP; 2 comparable units currently listed for rent nearby; solid renter incomes; 4,602 units permitted in Brevard County in 2024 (702 in 5+ unit buildings).
- This rent runs 34% of the median local income ($87k/yr) — at the standard rent-burdened threshold; future hikes will face affordability resistance.
Forward outlook
- Local home prices are declining (-3.0%/yr); year-one equity from $2k of loan paydown is wiped out by about $7k of value loss. Plan a longer hold.
- Brevard County population projected at +15% by 2050 — modest demand growth; plan on rents tracking national, not racing it.
Negotiation context
- It's been on market 324 days — a 12% lower offer ($196k) is reasonable based on typical stale-listing flexibility.
- 2 sale attempts since 5y ago; this cycle's ask has dropped $27k (11%) from the opening price — seller is motivated, your offer sets the floor, not the list.
- Current owner paid $32k; list at $223k implies a 597% gain — meaningful room to come down on a strong offer.
Risks & watch-outs
- Watch-outs: flood insurance adds $66/mo.
- Climate carrying-cost: severe flood risk; severe wind risk, 99% chance of damaging wind over 30y; extreme-heat days projected 7→22/yr by 2055 (HVAC capex compounding) — expect insurance premiums to compound above CPI over the hold.
Questions for the listing agent
- It's been on market 324 days. Have you received any prior offers? Is the seller open to a 12% concession, seller financing, or rate buy-down credit?
- What's the actual annual flood-insurance premium (NFIP or private), and is the property in a SFHA with mandatory coverage?
- Why hasn't it sold? Are there any deal-killer items the seller is aware of (foundation, flood, title, zoning, code violations)?
- Is there a deadline driving the sale (1031 exchange, divorce, estate, relocation)? That informs how much negotiation room exists.
- What's the average days-on-market for RENTAL listings here right now (not sales)? A rising rental-DOM trend means longer vacancies and softer asking-rent achievability than the comps imply.
- What's the recent tenant-quality profile in this submarket — average credit score on applications, eviction rate, late-payment / NSF rate, and stable-employment percentage? A property-management company in the area should have these aggregated.
- How much new for-sale + rental construction is in the pipeline within 1–3 miles? Heavy new supply typically softens prices + rents 12–24 months out; constrained supply supports both.
Investment metrics
- 1% rule
- 1.11% ✓
- Cap rate
- 8.95%
- Cash-on-cash
- 9.50%
- DSCR
- 1.42
- GRM
- 7.5
CMA / ARV
No comps found within radius.
Projected returns pro-forma
-3.0% appreciation · 2.12% rent growth · sell at horizon
- IRR
- -4.8%
- Equity multiple
- 0.82×
- Total profit
- $-11,025
- Equity at exit
- $33,250
- IRR
- 3.9%
- Equity multiple
- 1.27×
- Total profit
- $16,847
- Equity at exit
- $19,281
Cash invested: $62,440 (down + closing). Projections, not guarantees.
Landlord ↔ Tenant lean methodology
- Overall (STATE)
- 87 Strongly Landlord-Friendly
- State Florida
- 87 Strongly Landlord-Friendly · R+3
- County
- — inherits STATE
- City
- — inherits STATE
ZIP-level market 32953
- Home prices YoY
- -34.5%
- Rents YoY
- 2.1%
- Active inventory
- 219
- Price-to-rent
- 7.5×
Monthly cashflow live
- Estimated rent
- $2,481 medium interval (Pro) →
- Mortgage (P&I)
- −$1,169
- Tax from tax record
- −$203 /mo · $2,438/yr
- Insurance
- −$93
- Flood insurance flood zone
- −$66 /mo · $798/yr
- HOA
- −$0
- Vacancy / Maint / Mgmt
- −$521
- Net cashflow
- $428
Break-even live
UW: 25.0% down · 7.5% · 30yr · 1.5% tax · 5.0% vac · 8.0% maint · 8.0% mgmt
Financing live
Cash to close
- Down payment
- $55,750
- Closing costs
- $6,690
- Reserves months
- —
- Total cash needed
- —
Loan-product check · same deal, 3 products live
Conventional
25% down · 7.5% · 30yr
- Down + closing
- —
- Monthly P&I
- —
- Monthly cashflow
- —
- DSCR
- —
- Eligible?
- —
Personal DTI + credit; lowest rate.
DSCR
20% down · 8.5% · 30yr
- Down + closing
- —
- Monthly P&I
- —
- Monthly cashflow
- —
- DSCR
- —
- Eligible?
- —
No personal income docs; deal must DSCR.
Hard money
10% down · 12.0% · 12mo
- Down + closing
- —
- Monthly P&I
- —
- Monthly cashflow
- —
- DSCR
- —
- Eligible?
- —
Short-term bridge; refi at stabilization.
Rent comps 2 comps
| Address | Beds | Baths | Sqft | Rent | $/sqft | DOM | Units | Dist |
|---|---|---|---|---|---|---|---|---|
| 5870 N Courtenay Pkwy Unit 1 Merritt Island, FL | 3.0 | 2.0 | 2000 | $2,900 | $1.45 | 23d | 1 | 0.92mi |
| 1045 Pine Island Rd Merritt Island, FL | 3.0 | 2.0 | 1725 | $2,450 | $1.42 | 23d | 1 | 1.15mi |
Listing history 24 events
-
2026-06-18days on market $223,000 Active 324 DOM
-
2026-06-17days on market $223,000 Active 323 DOM
-
2026-06-16days on market $223,000 Active 322 DOM
-
2026-06-15days on market $223,000 Active 321 DOM
-
2026-06-14days on market $223,000 Active 319 DOM
-
2026-06-10days on market $223,000 Active 316 DOM
-
2026-06-08days on market $223,000 Active 314 DOM
-
2026-06-07days on market $223,000 Active 313 DOM
-
2026-06-05days on market $223,000 Active 310 DOM
-
2026-06-03days on market $223,000 Active 309 DOM
-
2026-06-02days on market $223,000 Active 308 DOM
-
2026-06-01days on market $223,000 Active 307 DOM
-
2026-05-31days on market $223,000 Active 306 DOM
-
2026-05-31days on market $223,000 Active 305 DOM
-
2026-04-01price $223,000
-
2026-01-22price $224,000
-
2025-12-01price $225,000
-
2025-10-09price $235,000
-
2025-09-03price $245,000
-
2025-07-29$250,000 Active
-
2025-07-29historical $250,000
-
2022-01-24soldstatus $32,000 Closed 132-char remark
Show marketing remark (132 chars)
Cleared corner lot, ready to put your manufactured home. Power available and on City Water. Just minutes away from the Space Center.
-
2021-12-29historical Contingent 132-char remark
Show marketing remark (132 chars)
Cleared corner lot, ready to put your manufactured home. Power available and on City Water. Just minutes away from the Space Center.
-
2021-09-14$44,900 Active 132-char remark
Show marketing remark (132 chars)
Cleared corner lot, ready to put your manufactured home. Power available and on City Water. Just minutes away from the Space Center.
ⓘ Source: listings_history table (triggers on properties + properties_extension) + one-shot
backfill from property_details.listing_events for pre-trigger history.
Tax reassessment forecast FL · Resets to sale price
- Current annual tax
- $2,438 · $203/mo
- Projected year-2 tax
- $2,438 · $203/mo
- Expected delta
- $0/yr ($0/mo · 0.0%)
ⓘ Screening estimate from a state-policy table — verify with the county assessor before closing.
Climate risk First Street
- Flood 9/10 Extreme FEMA zone X (shaded) · 99% chance over 30 yrs
- Wildfire 3/10 Moderate
- Heat 10/10 Extreme 7 d/yr ≥105°F today · 22 d/yr by 30 yrs out
- Wind 10/10 Extreme 99% chance of damaging wind over 30 yrs
- Air quality 2/10 Low 1 unhealthy d/yr today · 1 by 30 yrs out
Nearby sold comps map
Loading sold comps map…
Walkable amenities ~0.75 mi
Loading nearby amenities…
Taxation est. · year 1
- Rental income
- $29,772
- − Mortgage interest
- −$12,491
- − Property taxes
- −$2,438
- − Insurance
- −$1,912
- − Repairs & maintenance
- −$2,382
- − Management
- −$2,382
- − Depreciation
- −$6,487
- Taxable income
- $1,678
- Est. tax owed @ 24.0%
- −$403
- After-tax cash flow
- $4,733/yr
For passive investors: Depreciation is non-cash, so a rental often shows a tax loss while cash-flowing — sheltering income. Rental losses are passive: they offset passive income freely, and up to $25,000/yr can offset ordinary (W-2) income if you actively participate and your MAGI is under $100k (phasing out to $0 by $150k); unused losses carry forward. On sale, claimed depreciation is recaptured at up to 25%, and gains may owe capital-gains tax (a 1031 exchange can defer both). Figures are a year-1 estimate at your 24.0% rate — not tax advice; consult a CPA.
Schools (NCES district)
- District
- Brevard
- NCES district ID
- 1200150
- Math proficiency
- 53% ▼ -9.00%
- Reading proficiency
- 57% ▼ -4.00%
- Median HH income
- $49,426
- Composite
- 46.86/100
- National rank
- #2370
- State rank
- #19 of 73 in FL
Livability — North Merritt Island
No livability data for this city. (Only ~50 U.S. cities are tracked.)
Census & demographics
- Census place
- North Merritt Island, FL
- County
- Brevard County · 602,871 people
- City population
- 24,834
- Metro
- Palm Bay-Melbourne-Titusville, FL
- Population (ZIP)
- 24,759
- Household income
- $87,262
- Rent vs Own
- Severe rent burden
- 849.0
Population outlook (Brevard County) Hauer SSP2
- Today (2025)
- 623,254 people
- By 2030
- 648,420 · +4.0%
- By 2040
- 690,009 · +10.7%
- By 2050
- 715,669 · +14.8%
- By 2075
- 775,744 · +24.5%
- By 2100
- 776,687 · +24.6%
Race, ethnicity, and origin ACS 2023
- Neighborhood character
- Predominantly White (77%)
- Race & ethnicity
- White 77% Hispanic / Latino 13% Two or more races 7% Black 4% Asian 3%
- Hispanic origin (detail)
- Mexican 2% Puerto Rican 6%
- Common ancestry
- Slovak 3% Romanian 3% Lithuanian 3%
- Foreign-born
- 9% · Canada, China, Jamaica
- Languages at home
- 87% English-only · Spanish 8% Tagalog/Filipino 2% French/Haitian/Cajun 1%
Political lean MEDSL · Brevard
- 2024 margin
- Strong R (+20.8) · D 39.1% · R 59.9% · Other 1.0%
- 2008→2024 swing
- -10.4pp toward R · 2008: -10.4pp · 2024: -20.8pp
- All cycles
- 2024: R+20.8 2020: R+16.4 2016: R+19.8 2012: R+12.7 2008: R+10.4
Not yet ingested
- Civics
- —
Market trends
- HPI YoY
- ▼ -168.76%
- Current HPI
- 320.1966
- Rent YoY
- ▲ 2.12%
- Metro
- Palm Bay-Melbourne-Titusville, FL
- State GDP YoY
- ▲ 3.28%
- F500 in state
- 36
Industry mix (Fortune 500 HQ in FL)
| Industry | F500 HQs | Revenue |
|---|---|---|
| Industrial Technology | 2 | $29B |
|
||
| Insurance | 2 | $17B |
|
||
| Retail | 1 | $60B |
|
||
| Technology Distribution | 1 | $58B |
|
||
| Homebuilding | 1 | $35B |
|
||
| Technology Manufacturing | 1 | $35B |
|
||
Price history
+396.7% since first listed10 events — show timeline
- 2026-04-01 Price Changed $223,000 SCMLS
- 2026-01-22 Price Changed $224,000 SCMLS
- 2025-12-01 Price Changed $225,000 SCMLS
- 2025-10-09 Price Changed $235,000 SCMLS
- 2025-09-03 Price Changed $245,000 SCMLS
- 2025-07-29 Listed $250,000 SCMLS
- 2025-07-29 Coming Soon $250,000 SCMLS
- 2022-01-24 Sold (MLS) $32,000 SCMLS
- 2021-12-29 Contingent — SCMLS
- 2021-09-14 Listed $44,900 SCMLS
Property tax history
+19.1%/yrLatest (2025): $2,438 · +15.3% YoY. Source: county tax records.
Cash-flow waterfall
monthlySold comps — $/sqft
last 12 mo · ≤1 miLoading sold comps…