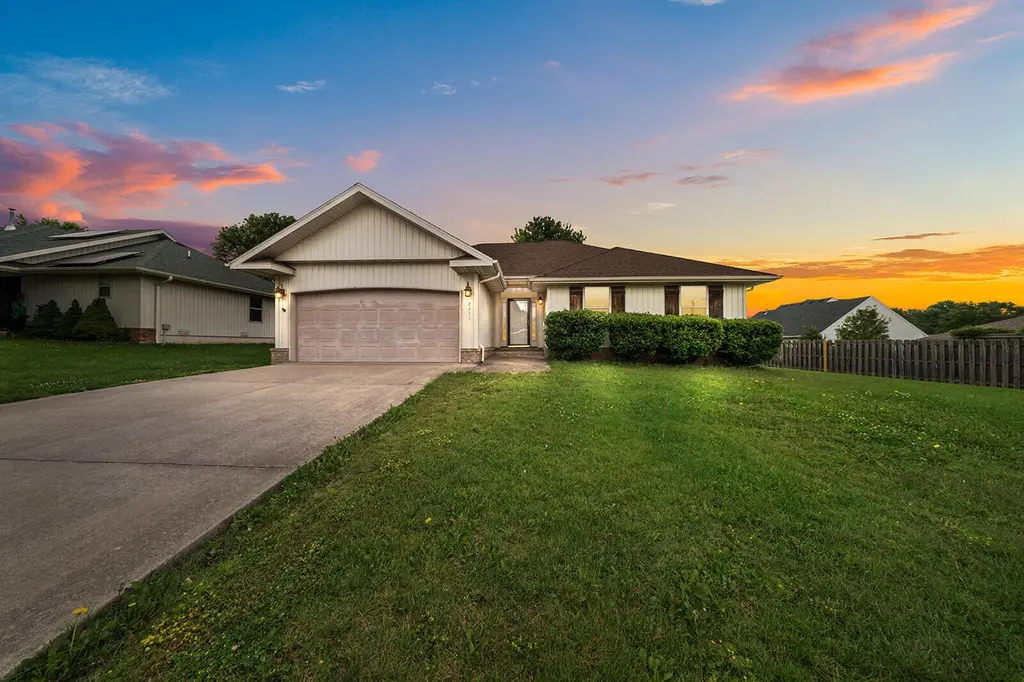
2323 E Logan St · Republic, MO
Flood risk 1/10 · Minimal
- FEMA flood zone
- X (unshaded)
- Chance of flooding over 30 yrs
- 0.0%
- Est. flood insurance / yr
- $507 – $1,088
Fire risk 4/10 · Minor
- Est. fire insurance / yr
- $1,054 – $1,958
Heat risk 5/10 · Moderate
- Hot days now (above 105°F)
- 7 days/yr
- Hot days in 30 yrs
- 20 days/yr
Wind risk 2/10 · Minimal
- Chance of severe wind over 30 yrs
- 1.0%
Air-quality risk 1/10 · Minimal
- Unhealthy air days now
- 0 days/yr
- Unhealthy air days in 30 yrs
- 0 days/yr
Risk factors via First Street. Map © Google.
Why this score? — see what drove the D grade
The composite is a weighted blend of 9 inputs, each scored 0–100. Each bar is that input's sub-score; the figure is the points it added to the 100-point composite (weight × sub-score).
- Cash flow +12.1/30.0
- ARV discount +8.6/15.0
- Schools +4.8/10.0
- DSCR +3.6/10.0
- Livability +3.6/5.0
- Rent growth +3.4/5.0
- 1% rule +2.6/10.0
- Condition / age +2.5/5.0
- Appreciation +0.0/10.0
$245,000
🖨 Deal sheet (PDF) 📄 Offer letter ✓ Due diligence
Listing remarks MLS
Absolutely adorable 3 bedroom 2 bath home just listed. This home has so many great features from the open layout to the great sized bedrooms with lots of extra storage. This home has a fantastic kitchen including great appliances and an eat in dining area. The back yard is oversized and features a nice storage building. Schedule your showing at this conveniently located home today and be ready to be impressed!
Key facts
- 0.28 acre lot
- 2 garage spots
- Built 2004
Property features AI
Exterior
- Parking: 2-car garage with garage door opener; garage faces front
- Security: Fire alarm
- Utilities: Public water; Public sewer
- Home design: Single-family residence; One level
- Construction: Vinyl siding
- Exterior features: Covered rear porch; Shed(s); Wood and chain-link fencing; Composition roof; Asphalt and concrete road access on a public, city-maintained street
Interior
- Kitchen: Electric cooktop; Dishwasher; Refrigerator; Gas water heater
- Bedrooms: Walk-in closet(s) in bedroom(s)
- Flooring: Tile
- Bathrooms: 2 full bathrooms
- Heating & cooling: Central heating (natural gas); Central air conditioning
- Interior features: Beamed ceilings; Walk-in closet(s); Insulated and double-pane windows with blinds, drapes and other window coverings
- Laundry & utility: Laundry area located in the garage
Neighborhood map
What this means for you Summary
Snapshot
- This is a 3-bed/2.0-bath single-family listed at $245k.
Deal economics
- At list price, monthly cash flow is $-54 ($-651/yr) — negative.
- To cash-flow at today's rent, offer at most $235k (3.9% below list).
- To meet the 1% rule (rent ≥ 1% of price), the offer needs to be $186k (24.0% below list).
- Recommended offer: $186k (24.0% below list) — sets the bar for 1% rule.
- Cap rate 6.0% vs local median 4.0% in Republic — top-decile yield for the area; either an underpriced asset or a hidden risk that comps aren't pricing in. Stress-test before assuming the spread holds.
Location & tenants
- Location reads 72/100 on livability (#92 in MO) — a middle-class / working-renter tenant base. Strengths: cost of living A+, housing A+, crime A; Watch: amenities F, commute F, health & safety F.
- Republic R-III (suburban): math 56% / reading 57% proficiency, ranked #19 of 324 in MO (top 6%) — acceptable for families but not a draw, mixed tenant base, ~2y average lease.
- Zoned schools: Lyon Elementary (math 56% / reading 56%, grade C+, #180 of 1,115 statewide, top 16%, 437 students, 41% FRL); Republic Middle (math 50% / reading 53%, grade C, #57 of 391 statewide, top 15%, 1,146 students, 39% FRL); Republic High (math 56% / reading 60%, grade C, #48 of 521 statewide, top 9%, 1,542 students, 31% FRL) — zoned schools at 37% FRL track the district average.
- Market conditions: Rents rising (+3.6%/yr); 480 active listings in the ZIP; 17 comparable units currently listed for rent nearby; rentals lingering (median 45d on market — plan ~5-8 weeks vacancy on turnover, expect pricing pressure); 71% of comp listings sitting > 30 days — soft ceiling on asking rent; 1,302 units permitted in Greene County in 2024 (250 in 5+ unit buildings).
- This rent runs 33% of the median local income ($68k/yr) — at the standard rent-burdened threshold; future hikes will face affordability resistance.
Forward outlook
- Local home prices are declining (-3.0%/yr); year-one equity from $2k of loan paydown is wiped out by about $7k of value loss. Plan a longer hold.
- Greene County population projected at +25% by 2050 — long-run rental-demand tailwind backs the buy-and-hold thesis.
Negotiation context
- It's been on market 22 days — a 2% lower offer ($241k) is reasonable based on typical stale-listing flexibility.
- 2 sale attempts since 9y ago with the ask held roughly flat each time — persistent listings suggest the price (not the market) is what's stuck; bring a comps-based counter.
Risks & watch-outs
- Climate carrying-cost: extreme-heat days projected 7→20/yr by 2055 (HVAC capex compounding) — expect insurance premiums to compound above CPI over the hold.
Questions for the listing agent
- What do current leases actually rent for vs. the listed asking? Can we see a recent rent roll and the last 12 months of T-12 income?
- Is there a deadline driving the sale (1031 exchange, divorce, estate, relocation)? That informs how much negotiation room exists.
- Schools are B-rated — typically a magnet for longer-tenancy family renters. What's the average tenant stay here, and is there a school-zone premium baked into asking?
- The area grade is low — what's the realistic commute time and amenity access for the typical tenant pool here? Any planned neighborhood developments (good or bad) we should know about?
- What's the average days-on-market for RENTAL listings here right now (not sales)? A rising rental-DOM trend means longer vacancies and softer asking-rent achievability than the comps imply.
- What's the recent tenant-quality profile in this submarket — average credit score on applications, eviction rate, late-payment / NSF rate, and stable-employment percentage? A property-management company in the area should have these aggregated.
- How much new for-sale + rental construction is in the pipeline within 1–3 miles? Heavy new supply typically softens prices + rents 12–24 months out; constrained supply supports both.
Investment metrics
- 1% rule
- 0.76% ✗
- Cap rate
- 6.03%
- Cash-on-cash
- -0.95%
- DSCR
- 0.96
- GRM
- 11.0
CMA / ARV
- ARV (on-the-fly)
- $251,160
- Comps found
- 12
Show comp detail 12 sales within ~0.75 mi
| Address | Dist | Beds/Ba | Sqft | Sold | Price | $/sf | Match |
|---|---|---|---|---|---|---|---|
| 2321 E Lee St | 0.12mi | 3/2.0 | 1,404 (+2%) | 4mo | $235,000 | $167 | 88 |
| 2533 E Moonlight St | 0.23mi | 3/2.0 | 1,343 (-3%) | 3mo | $245,000 | $182 | 82 |
| 435 N Claremont Pl | 0.32mi | 3/2.0 | 1,375 (-0%) | 3mo | $237,000 | $172 | 82 |
| 2429 E Timber Oak St | 0.39mi | 3/2.0 | 1,350 (-2%) | 3mo | $262,229 | $194 | 75 |
| 2738 E Moonlight St | 0.44mi | 3/2.0 | 1,325 (-4%) | 1mo | $240,000 | $181 | 72 |
| 2418 E Terrier St | 0.41mi | 3/2.0 | 1,300 (-6%) | 2mo | $260,467 | $200 | 70 |
| 580 N Lynette Ave | 0.64mi | 3/2.0 | 1,330 (-4%) | 2mo | $219,900 | $165 | 62 |
| 761 N Lexington Ave | 0.71mi | 3/2.0 | 1,404 (+2%) | 3mo | $254,900 | $182 | 62 |
| 2462 E Beagle St | 0.56mi | 3/2.0 | 1,504 (+9%) | 3mo | $269,900 | $179 | 56 |
| 508 N Glenwood Ave | 0.55mi | 4/2.0 (+1) | 1,461 (+6%) | 4mo | $250,000 | $171 | 56 |
| 1180 N Cardinal Ave | 0.70mi | 3/2.0 | 1,501 (+9%) | 1mo | $287,500 | $192 | 52 |
| 548 N Jester Ave | 0.64mi | 3/2.0 | 1,208 (-12%) | 1mo | $235,000 | $195 | 49 |
Match score weights: distance 35% · size 25% · config 20% · recency 20%. Top-matched comps best support the ARV.
Projected returns pro-forma
-3.0% appreciation · 3.61% rent growth · sell at horizon
- IRR
- -17.3%
- Equity multiple
- 0.39×
- Total profit
- $-42,079
- Equity at exit
- $36,530
- IRR
- -8.3%
- Equity multiple
- 0.47×
- Total profit
- $-36,613
- Equity at exit
- $21,183
Cash invested: $68,600 (down + closing). Projections, not guarantees.
Landlord ↔ Tenant lean methodology
- Overall (STATE)
- 81 Strongly Landlord-Friendly
- State Missouri
- 81 Strongly Landlord-Friendly · R+10
- County
- — inherits STATE
- City
- — inherits STATE
ZIP-level market 65738
- Home prices YoY
- -32.2%
- Rents YoY
- 3.6%
- Active inventory
- 480
- Price-to-rent
- 11.0×
Monthly cashflow live
- Estimated rent
- $1,863 high interval (Pro) →
- Mortgage (P&I)
- −$1,285
- Tax from tax record
- −$139 /mo · $1,669/yr
- Insurance
- −$102
- HOA
- −$0
- Vacancy / Maint / Mgmt
- −$391
- Net cashflow
- $-54
Break-even live
Sensitivity live
| Price | -10% $84 | -5% $15 | +0% $-54 | +5% $-124 | +10% $-193 |
|---|---|---|---|---|---|
| Rent | -10% $-201 | -5% $-128 | +0% $-54 | +5% $19 | +10% $93 |
| Rate | -1.0pp $69 | -0.5pp $8 | base $-54 | +0.5pp $-118 | +1.0pp $-182 |
UW: 25.0% down · 7.5% · 30yr · 1.5% tax · 5.0% vac · 8.0% maint · 8.0% mgmt
Financing live
Cash to close
- Down payment
- $61,250
- Closing costs
- $7,350
- Reserves months
- —
- Total cash needed
- —
Loan-product check · same deal, 3 products live
Conventional
25% down · 7.5% · 30yr
- Down + closing
- —
- Monthly P&I
- —
- Monthly cashflow
- —
- DSCR
- —
- Eligible?
- —
Personal DTI + credit; lowest rate.
DSCR
20% down · 8.5% · 30yr
- Down + closing
- —
- Monthly P&I
- —
- Monthly cashflow
- —
- DSCR
- —
- Eligible?
- —
No personal income docs; deal must DSCR.
Hard money
10% down · 12.0% · 12mo
- Down + closing
- —
- Monthly P&I
- —
- Monthly cashflow
- —
- DSCR
- —
- Eligible?
- —
Short-term bridge; refi at stabilization.
Rent comps 17 comps
| Address | Beds | Baths | Sqft | Rent | $/sqft | DOM | Units | Dist |
|---|---|---|---|---|---|---|---|---|
| 644 N Cox Ave Republic, MO | 3.0 | 2.0 | 1375 | $1,595 | $1.16 | 45d | 1 | 0.21mi |
| 625 Turner Ave Republic, MO | 2.0–3.0 | 2.5 | 1609 | $1,895 | $1.18 | 15d | 6 | 0.33mi |
| 922 N Blake Ave Republic, MO | 2.0 | 2.0 | 1400 | $2,300 | $1.64 | 45d | 1 | 0.39mi |
| 923 N Blake AVE Republic, MO | 2.0 | 2.0 | 1400 | $2,300 | $1.64 | 45d | 1 | 0.39mi |
| 928 N Blake Ave Republic, MO | 2.0 | 2.0 | 1400 | $2,300 | $1.64 | 45d | 1 | 0.40mi |
| 929 N Blake Ave Republic, MO | 2.0 | 2.0 | 1400 | $2,300 | $1.64 | 45d | 1 | 0.41mi |
| 937 N Blake Ave Republic, MO | 2.0 | 2.0 | 1400 | $2,300 | $1.64 | 45d | 1 | 0.41mi |
| 2488 Timber Oak St Republic, MO | 4.0 | 2.0 | 1550 | $1,895 | $1.22 | 45d | 1 | 0.43mi |
| 101 S Basswood Ave Republic, MO | 3.0 | 1.0 | 1060 | $1,250 | $1.18 | 45d | 1 | 0.46mi |
| 810 N Oakwood Ave Republic, MO | 2.0–3.0 | 2.0 | 1239 | $924 | $0.75 | 15d | 4 | 0.47mi |
| 1031 N Blake Ave Republic, MO | 2.0 | 2.0 | 1400 | $2,300 | $1.64 | 45d | 1 | 0.51mi |
| 1605 E Hines St Republic, MO | 1.0–2.0 | 1.0–2.0 | 840 | $1,060 | $1.26 | 15d | 10 | 0.58mi |
| 1090 N Northwood Ave Republic, MO | 3.0 | 2.0 | 1321 | $1,200 | $0.91 | 15d | 1 | 0.62mi |
| 1740 E Hamilton St Republic, MO | 1.0–3.0 | 1.0–2.0 | 1110 | $1,395 | $1.26 | 45d | 7 | 0.70mi |
| 109 N Allen Ave Republic, MO | 3.0 | 1.0 | 1141 | $1,295 | $1.13 | 45d | 1 | 0.87mi |
| 1413 N Lyon Ave Republic, MO | 3.0 | 2.0 | 1571 | $1,799 | $1.15 | 45d | 1 | 1.18mi |
| 2983 Heritage St Republic, MO | 3.0 | 2.0 | 1571 | $1,799 | $1.15 | 25d | 1 | 1.20mi |
Listing history 21 events
-
2026-06-21statusdays on market $245,000 Pending 22 DOM
-
2026-06-18days on market $245,000 Active 20 DOM
-
2026-06-17days on market $245,000 Active 19 DOM
-
2026-06-16days on market $245,000 Active 18 DOM
-
2026-06-15days on market $245,000 Active 17 DOM
-
2026-06-14days on market $245,000 Active 15 DOM
-
2026-06-13pricedays on market $245,000 Active 14 DOM
-
2026-06-10days on market $250,000 Active 12 DOM
-
2026-06-09days on market $250,000 Active 11 DOM
-
2026-06-08days on market $250,000 Active 10 DOM
-
2026-06-07days on market $250,000 Active 9 DOM
-
2026-06-05days on market $250,000 Active 6 DOM
-
2026-06-03days on market $250,000 Active 5 DOM
-
2026-06-02days on market $250,000 Active 4 DOM
-
2026-06-01days on market $250,000 Active 3 DOM
-
2026-05-31days on market $250,000 Active 2 DOM
-
2026-05-29$250,000 Active
-
2019-08-20soldstatus
-
2017-10-24soldstatus
-
2017-10-20soldstatus 413-char remark
Show marketing remark (413 chars)
Absolutely adorable 3 bedroom 2 bath home just listed. This home has so many great features from the open layout to the great sized bedrooms with lots of extra storage. This home has a fantastic kitchen including great appliances and an eat in dining area. The back yard is oversized and features a nice storage building. Schedule your showing at this conveniently located home today and be ready to be impressed!
-
2017-09-12$124,900 413-char remark
Show marketing remark (413 chars)
Absolutely adorable 3 bedroom 2 bath home just listed. This home has so many great features from the open layout to the great sized bedrooms with lots of extra storage. This home has a fantastic kitchen including great appliances and an eat in dining area. The back yard is oversized and features a nice storage building. Schedule your showing at this conveniently located home today and be ready to be impressed!
ⓘ Source: listings_history table (triggers on properties + properties_extension) + one-shot
backfill from property_details.listing_events for pre-trigger history.
Tax reassessment forecast MO · Resets to sale price
- Current annual tax
- $1,669 · $139/mo
- Projected year-2 tax
- $2,376 · $198/mo
- Expected delta
- +$707/yr (+$59/mo · 42.4%)
ⓘ Screening estimate from a state-policy table — verify with the county assessor before closing.
Climate risk First Street
- Flood 1/10 Low FEMA zone X (unshaded) · 0% chance over 30 yrs
- Wildfire 4/10 Moderate
- Heat 5/10 Major 7 d/yr ≥105°F today · 20 d/yr by 30 yrs out
- Wind 2/10 Low 100% chance of damaging wind over 30 yrs
- Air quality 1/10 Low 0 unhealthy d/yr today · 0 by 30 yrs out
Nearby sold comps map
Loading sold comps map…
Walkable amenities ~0.75 mi
Loading nearby amenities…
Taxation est. · year 1
- Rental income
- $22,356
- − Mortgage interest
- −$13,724
- − Property taxes
- −$1,669
- − Insurance
- −$1,225
- − Repairs & maintenance
- −$1,788
- − Management
- −$1,788
- − Depreciation
- −$7,127
- Taxable loss
- −$4,966
- Est. tax savings @ 24.0%
- +$1,192
- After-tax cash flow
- $541/yr
For passive investors: Depreciation is non-cash, so a rental often shows a tax loss while cash-flowing — sheltering income. Rental losses are passive: they offset passive income freely, and up to $25,000/yr can offset ordinary (W-2) income if you actively participate and your MAGI is under $100k (phasing out to $0 by $150k); unused losses carry forward. On sale, claimed depreciation is recaptured at up to 25%, and gains may owe capital-gains tax (a 1031 exchange can defer both). Figures are a year-1 estimate at your 24.0% rate — not tax advice; consult a CPA.
Schools (NCES district)
- District
- Republic R-III
- NCES district ID
- 2926220
- Math proficiency
- 56% ▲ 2.00%
- Reading proficiency
- 57% ▼ -1.00%
- Median HH income
- $51,329
- Composite
- 48.3/100
- National rank
- #2152
- State rank
- #19 of 324 in MO
Livability — Republic
- Score
- 72/100
- State rank
- #92
- US rank
- #6228
Category grades
Schools grade is shown separately in the Schools card above.
Census & demographics
- Census place
- Republic, MO
- County
- Greene County · 244,327 people
- City population
- 21,283
- Metro
- Springfield, MO
- Population (ZIP)
- 21,283
- Household income
- $67,841
- Rent vs Own
- Severe rent burden
- 461.0
Population outlook (Greene County) Hauer SSP2
- Today (2025)
- 319,054 people
- By 2030
- 335,135 · +5.0%
- By 2040
- 366,186 · +14.8%
- By 2050
- 397,431 · +24.6%
- By 2075
- 477,035 · +49.5%
- By 2100
- 520,828 · +63.2%
Race, ethnicity, and origin ACS 2023
- Neighborhood character
- Predominantly White (91%)
- Race & ethnicity
- White 91% Two or more races 4% Hispanic / Latino 3% Black 1%
- Common ancestry
- Italian 2% Lithuanian 2% Portuguese 2%
- Foreign-born
- 1% · Canada, China
- Languages at home
- 98% English-only · Spanish 1%
Political lean MEDSL · Greene
- 2024 margin
- Strong R (+20.8) · D 38.9% · R 59.7% · Other 1.4%
- 2008→2024 swing
- -5.0pp toward R · 2008: -15.8pp · 2024: -20.8pp
- All cycles
- 2024: R+20.8 2020: R+20.1 2016: R+27.4 2012: R+24.4 2008: R+15.8
Not yet ingested
- Civics
- —
Market trends
- HPI YoY
- ▼ -102.93%
- Current HPI
- 217.1512
- Rent YoY
- ▲ 3.61%
- Metro
- Springfield, MO
- State GDP YoY
- ▲ 1.84%
- F500 in state
- 20
Industry mix (Fortune 500 HQ in MO)
| Industry | F500 HQs | Revenue |
|---|---|---|
| Healthcare | 1 | $163B |
|
||
| Insurance | 1 | $21B |
|
||
| Industrial Technology | 1 | $17B |
|
||
| Retail | 1 | $16B |
|
||
| Industrial Distribution | 1 | $10B |
|
||
| Utilities | 1 | $9B |
|
||
Price history
+100.2% since first listed5 events — show timeline
- 2026-05-29 Listed $250,000 SOMO
- 2019-08-20 Sold (Public Records) — Public Records
- 2017-10-24 Sold (Public Records) — Public Records
- 2017-10-20 Sold (MLS) — SOMO
- 2017-09-12 Listed $124,900 SOMO
Property tax history
+3.5%/yrLatest (2025): $1,669 · +7.9% YoY. Source: county tax records.
Cash-flow waterfall
monthlySold comps — $/sqft
last 12 mo · ≤1 miLoading sold comps…