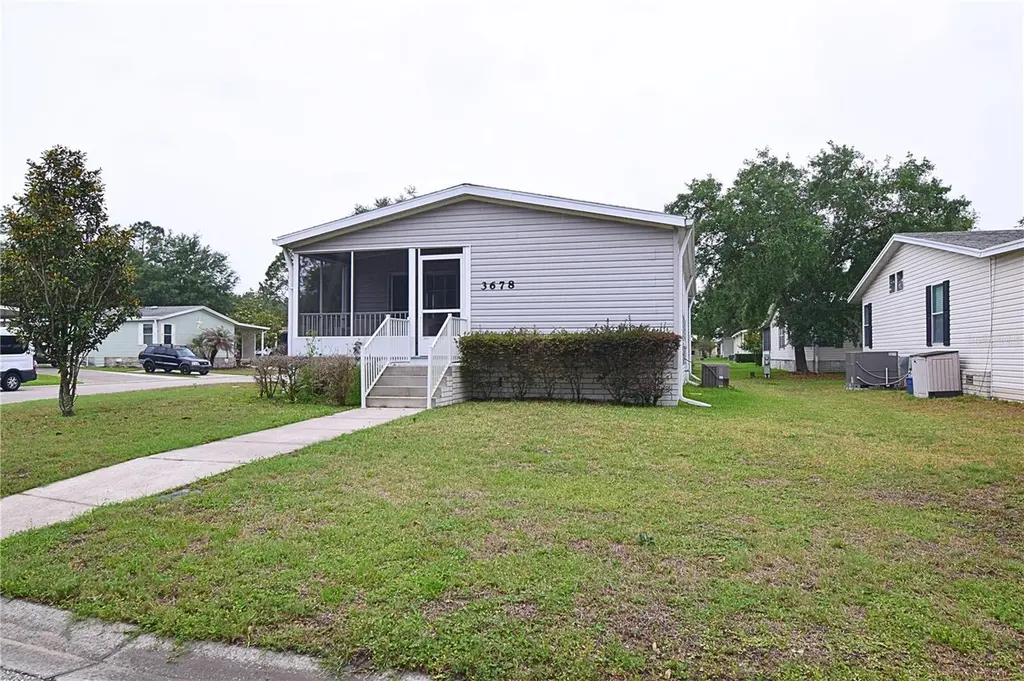
3678 Coconut Palm Cir · Oviedo, FL
Flood risk 1/10 · Minimal
- FEMA flood zone
- X (unshaded)
- Chance of flooding over 30 yrs
- 0.0%
- Est. flood insurance / yr
- $507 – $1,088
Fire risk 4/10 · Minor
- Est. fire insurance / yr
- $947 – $1,759
Heat risk 9/10 · Severe
- Hot days now (above 108°F)
- 7 days/yr
- Hot days in 30 yrs
- 22 days/yr
Wind risk 9/10 · Severe
- Chance of severe wind over 30 yrs
- 99.0%
Air-quality risk 2/10 · Minimal
- Unhealthy air days now
- 2 days/yr
- Unhealthy air days in 30 yrs
- 2 days/yr
Risk factors via First Street. Map © Google.
Why this score? — see what drove the B grade
The composite is a weighted blend of 9 inputs, each scored 0–100. Each bar is that input's sub-score; the figure is the points it added to the 100-point composite (weight × sub-score).
- Cash flow +30.0/30.0
- 1% rule +10.0/10.0
- DSCR +10.0/10.0
- ARV discount +7.5/15.0
- Schools +5.1/10.0
- Livability +4.0/5.0
- Rent growth +2.5/5.0
- Condition / age +2.5/5.0
- Appreciation +0.0/10.0
$85,900
🖨 Deal sheet 📄 Offer letter ✓ Due diligence
Listing remarks
Welcome Home to this beautifully maintained home located in the heart of Oviedo! This spacious residence features an OPEN FLOOR PLAN, HIGH CEILINGS, abundant natural light, and a large kitchen with plenty of cabinet and counter space perfect for entertaining or everyday living. Enjoy generously sized bedrooms, ample closet storage, and inviting indoor and outdoor living spaces designed for comfort and relaxation. Conveniently located near major shopping, restaurants, hospitals, parks, and top-rated schools with easy access to major roadways, this home offers the perfect combination of comfort and convenience. Whether you are looking for your next primary residence or simply a place to enjoy
Key facts
- Open floor plan
- Ample closet storage
- Large kitchen
Tags
Property features AI
Finance
- Other: Zoned residential
- Financial info: Land lease: $1,040
- HOA & community: Has HOA (Association: Susan Haupt); Senior community; Pets allowed
Exterior
- Parking: Has carport (1 space)
- Utilities: Private sewer; Water connected; Sewer connected; Electricity connected; Cable available
- Home design: Manufactured home (double wide); Single-story; Faces north; Entry level: One
- Construction: Metal siding; Shingle roof; Crawlspace foundation; Built as a manufactured home
- Exterior features: Outdoor lighting; Storage
Interior
- Kitchen: Dishwasher; Range; Range hood; Refrigerator
- Bedrooms: 2 bedrooms
- Flooring: Carpet; Linoleum
- Bathrooms: 2 full bathrooms
- Heating & cooling: Central heating; Central air conditioning
- Interior features: Cathedral ceilings; Ceiling fans; Eat-in kitchen; High ceilings; Open floorplan; Window treatments
- Laundry & utility: Washer; Dryer; Laundry inside
Neighborhood map
What this means for you Summary
Snapshot
- This is a 2-bed/2.0-bath single-family listed at $86k.
Deal economics
- At list price, monthly cash flow is $1k ($13k/yr) — positive.
- The deal already cash-flows at list — no discount required.
- Meets the 1% rule at list price ($2k rent vs $86k).
- Recommended offer: $85k (1.5% below list) — sets the bar for market timing.
- Cap rate 21.0% vs local median 3.0% in Oviedo — top-decile yield for the area; either an underpriced asset or a hidden risk that comps aren't pricing in. Stress-test before assuming the spread holds.
Location & tenants
- Location reads 80/100 on livability (#112 in FL, #1,732 nationally) — a professional / high-income tenant draw. Strengths: crime A+, employment A+, housing A+; Watch: amenities C-, cost of living D, commute F.
- Seminole (suburban): math 57% / reading 61% proficiency, ranked #13 of 73 in FL (top 18%) — acceptable for families but not a draw, mixed tenant base, ~2y average lease.
- Zoned schools: Carillon Elementary School (math 67% / reading 72%, grade A-, #364 of 2,144 statewide, top 19%, 985 students, 29% FRL); Hagerty High School (math 67% / reading 74%, grade B+, #55 of 667 statewide, top 8%, 2,495 students, 23% FRL).
- Market conditions: Rents flat; 446 active listings in the ZIP; 25 comparable units currently listed for rent nearby; rentals leasing fast (median 13d on market — plan ~1-2 weeks tenant-placement turnaround); solid renter incomes; 1,979 units permitted in Seminole County in 2024 (1,191 in 5+ unit buildings).
Forward outlook
- Local home prices are declining (-3.0%/yr); year-one equity from $594 of loan paydown is wiped out by about $3k of value loss. Plan a longer hold.
- Seminole County population projected at +24% by 2050 — long-run rental-demand tailwind backs the buy-and-hold thesis.
- At projected returns (-3.0% appreciation + 0.2% rent growth), your $24k cash investment doubles in ~3 years — after that, you're playing with house money.
Negotiation context
- It's been on market 28 days — a 2% lower offer ($85k) is reasonable based on typical stale-listing flexibility.
Risks & watch-outs
- Climate carrying-cost: severe wind risk, 99% chance of damaging wind over 30y; extreme-heat days projected 7→22/yr by 2055 (HVAC capex compounding) — expect insurance premiums to compound above CPI over the hold.
Questions for the listing agent
- Is there a deadline driving the sale (1031 exchange, divorce, estate, relocation)? That informs how much negotiation room exists.
- Schools are A-rated — typically a magnet for longer-tenancy family renters. What's the average tenant stay here, and is there a school-zone premium baked into asking?
- What's the average days-on-market for RENTAL listings here right now (not sales)? A rising rental-DOM trend means longer vacancies and softer asking-rent achievability than the comps imply.
- What's the recent tenant-quality profile in this submarket — average credit score on applications, eviction rate, late-payment / NSF rate, and stable-employment percentage? A property-management company in the area should have these aggregated.
- How much new for-sale + rental construction is in the pipeline within 1–3 miles? Heavy new supply typically softens prices + rents 12–24 months out; constrained supply supports both.
Investment metrics
- 1% rule
- 2.43% ✓
- Cap rate
- 21.01%
- Cash-on-cash
- 52.55%
- DSCR
- 3.34
- GRM
- 3.4
CMA / ARV
- ARV (on-the-fly)
- $332,748
- Comps found
- 7
Show comp detail 7 sales within ~0.75 mi
| Address | Dist | Beds/Ba | Sqft | Sold | Price | $/sf | Match |
|---|---|---|---|---|---|---|---|
| 3452 Kayla Cir | 0.39mi | 3/2.0 (+1) | 1,372 (-2%) | 15mo | $315,000 | $230 | 61 |
| 3650 Palm Valley Dr | 0.43mi | 2/2.0 | 1,279 (-9%) | 16mo | $9,750 | $8 | 52 |
| 527 Stillwater Dr | 0.69mi | 3/2.0 (+1) | 1,460 (+4%) | 10mo | $455,000 | $312 | 48 |
| 3501 Bermuda Cir | 0.42mi | 3/2.0 (+1) | 1,272 (-9%) | 18mo | $95,000 | $75 | 44 |
| 652 Carrigan Ave | 0.62mi | 3/2.0 (+1) | 1,608 (+14%) | 1mo | $459,900 | $286 | 41 |
| 761 Lagoon Dr | 0.75mi | 3/2.0 (+1) | 1,482 (+6%) | 18mo | $419,900 | $283 | 36 |
| 3872 Becontree Pl | 0.65mi | 3/2.0 (+1) | 1,603 (+14%) | 21mo | $380,000 | $237 | 24 |
Match score weights: distance 35% · size 25% · config 20% · recency 20%. Top-matched comps best support the ARV.
Projected returns pro-forma
-3.0% appreciation · 0.18% rent growth · sell at horizon
- IRR
- 47.3%
- Equity multiple
- 2.97×
- Total profit
- $47,437
- Equity at exit
- $12,808
- IRR
- 51.8%
- Equity multiple
- 5.39×
- Total profit
- $105,498
- Equity at exit
- $7,427
Cash invested: $24,052 (down + closing). Projections, not guarantees.
Landlord ↔ Tenant lean methodology
- Overall (STATE)
- 87 Strongly Landlord-Friendly
- State Florida
- 87 Strongly Landlord-Friendly · R+3
- County
- — inherits STATE
- City
- — inherits STATE
ZIP-level market 32765
- Home prices YoY
- -19.6%
- Rents YoY
- 0.2%
- Active inventory
- 446
- Price-to-rent
- 3.4×
Monthly cashflow live
- Estimated rent
- $2,085 high interval (Pro) →
- Mortgage (P&I)
- −$450
- Tax est. 1.5%
- −$107 /mo · $1,288/yr
- Insurance
- −$36
- HOA
- −$0
- Vacancy / Maint / Mgmt
- −$438
- Net cashflow
- $1,053
Break-even live
UW: 25.0% down · 7.5% · 30yr · 1.5% tax · 5.0% vac · 8.0% maint · 8.0% mgmt
Financing live
Cash to close
- Down payment
- $21,475
- Closing costs
- $2,577
- Reserves months
- —
- Total cash needed
- —
Loan-product check · same deal, 3 products live
Conventional
25% down · 7.5% · 30yr
- Down + closing
- —
- Monthly P&I
- —
- Monthly cashflow
- —
- DSCR
- —
- Eligible?
- —
Personal DTI + credit; lowest rate.
DSCR
20% down · 8.5% · 30yr
- Down + closing
- —
- Monthly P&I
- —
- Monthly cashflow
- —
- DSCR
- —
- Eligible?
- —
No personal income docs; deal must DSCR.
Hard money
10% down · 12.0% · 12mo
- Down + closing
- —
- Monthly P&I
- —
- Monthly cashflow
- —
- DSCR
- —
- Eligible?
- —
Short-term bridge; refi at stabilization.
Rent comps 25 comps
| Address | Beds | Baths | Sqft | Rent | $/sqft | DOM | Units | Dist |
|---|---|---|---|---|---|---|---|---|
| 3404 Kayla Cir Oviedo, FL | 3.0 | 2.0 | 1806 | $2,495 | $1.38 | 16d | 1 | 0.52mi |
| 3420 Harrow Ln Oviedo, FL | 2.0 | 2.5 | 1136 | $1,995 | $1.76 | 23d | 1 | 0.62mi |
| 3431 Harrow Ln Oviedo, FL | 3.0 | 2.0 | 1136 | $2,145 | $1.89 | 23d | 1 | 0.65mi |
| 505 Walnut Grove Pl Oviedo, FL | 3.0 | 2.0 | 1360 | $2,150 | $1.58 | 23d | 1 | 0.77mi |
| 3755 Collingwood Ln Oviedo, FL | 3.0 | 2.5 | 1828 | $2,200 | $1.20 | 5d | 1 | 0.88mi |
| 1029 Beckstrom Dr Oviedo, FL | 3.0 | 2.0 | 1446 | $2,465 | $1.70 | 3d | 1 | 0.96mi |
| 3812 Silverbell Loop Oviedo, FL | 3.0 | 2.5 | 1480 | $2,450 | $1.66 | 5d | 1 | 0.96mi |
| 4647 Lacebark Trl Oviedo, FL | 3.0 | 2.5 | 1480 | $950 | $0.64 | 23d | 1 | 1.03mi |
| 4338 Aristocrat Pt Oviedo, FL | 3.0 | 2.5 | 1480 | $2,200 | $1.49 | 5d | 1 | 1.06mi |
| 3426 Caruso Pl Oviedo, FL | 3.0 | 3.5 | 1480 | $2,200 | $1.49 | 23d | 1 | 1.06mi |
| 116 Reserve Cir #204 Oviedo, FL | 2.0 | 2.0 | 975 | $1,000 | $1.03 | 23d | 1 | 1.07mi |
| 2980 Grandeville Cir Oviedo, FL | 1.0–3.0 | 1.0–2.0 | 1365 | $2,042 | $1.50 | 2d | 31 | 1.09mi |
| 2590 Greenhill Way Oviedo, FL | 1.0–2.0 | 1.0–2.0 | 1062 | $2,020 | $1.90 | 1d | 18 | 1.14mi |
| 144 Reserve Cir #100 Oviedo, FL | 2.0 | 2.0 | 1098 | $1,599 | $1.46 | 14d | 1 | 1.17mi |
| 141 Reserve Cir #213 Oviedo, FL | 2.0 | 2.0 | 985 | $1,700 | $1.73 | 10d | 1 | 1.19mi |
| 141 Reserve Cir #213 Oviedo, FL | 2.0 | 2.0 | 985 | $1,700 | $1.73 | 5d | 1 | 1.19mi |
| 209 Reserve Cir Unit 101 Oviedo, FL | 2.0 | 2.0 | 975 | $2,000 | $2.05 | 23d | 1 | 1.19mi |
| 2352 Sunny View Dr Oviedo, FL | 2.0 | 1.0 | 1184 | $2,000 | $1.69 | 3d | 1 | 1.21mi |
| 2352 Sunny View Dr Oviedo, FL | 2.0 | 1.0 | 1184 | $1,950 | $1.65 | 3d | 1 | 1.21mi |
| 149 Reserve Cir #201 Oviedo, FL | 2.0 | 2.0 | 985 | $1,499 | $1.52 | 10d | 1 | 1.21mi |
| 1007 Cutoff Branch Ct Oviedo, FL | 3.0 | 2.0 | 1247 | $2,340 | $1.88 | 12d | 1 | 1.33mi |
| 1007 Cutoff Branch Ct Oviedo, FL | 3.0 | 2.0 | 1247 | $2,340 | $1.88 | 14d | 1 | 1.33mi |
| 1046 Whittier Cir Oviedo, FL | 3.0 | 2.5 | 1428 | $2,480 | $1.74 | 23d | 1 | 1.37mi |
| 3548 Stonefield Dr Orlando, FL | 3.0 | 2.0 | 1264 | $2,150 | $1.70 | 3d | 1 | 1.49mi |
| 3548 Stonefield Dr Orlando, FL | 3.0 | 2.0 | 1264 | $2,150 | $1.70 | 23d | 1 | 1.49mi |
Listing history 16 events
-
2026-06-18days on market $85,900 Active 28 DOM
-
2026-06-17price $85,900 Active 27 DOM
-
2026-06-17days on market $89,900 Active 27 DOM
-
2026-06-16days on market $89,900 Active 26 DOM
-
2026-06-15days on market $89,900 Active 25 DOM
-
2026-06-13days on market $89,900 Active 23 DOM
-
2026-06-10price $89,900 Active 19 DOM
-
2026-06-09days on market $95,000 Active 19 DOM
-
2026-06-08days on market $95,000 Active 18 DOM
-
2026-06-07pricedays on market $95,000 Active 17 DOM
-
2026-06-04days on market $99,000 Active 14 DOM
-
2026-06-03days on market $99,000 Active 13 DOM
-
2026-06-02days on market $99,000 Active 12 DOM
-
2026-06-01days on market $99,000 Active 11 DOM
-
2026-05-31days on market $99,000 Active 10 DOM
-
2026-05-22$99,000 Active
ⓘ Source: listings_history table (triggers on properties + properties_extension) + one-shot
backfill from property_details.listing_events for pre-trigger history.
Climate risk First Street
- Flood 1/10 Low FEMA zone X (unshaded) · 0% chance over 30 yrs
- Wildfire 4/10 Moderate
- Heat 9/10 Extreme 7 d/yr ≥108°F today · 22 d/yr by 30 yrs out
- Wind 9/10 Extreme 99% chance of damaging wind over 30 yrs
- Air quality 2/10 Low 2 unhealthy d/yr today · 2 by 30 yrs out
Nearby sold comps map
Loading sold comps map…
Walkable amenities ~0.75 mi
Loading nearby amenities…
Taxation est. · year 1
- Rental income
- $25,015
- − Mortgage interest
- −$4,812
- − Property taxes
- −$1,288
- − Insurance
- −$430
- − Repairs & maintenance
- −$2,001
- − Management
- −$2,001
- − Depreciation
- −$2,499
- Taxable income
- $11,984
- Est. tax owed @ 24.0%
- −$2,876
- After-tax cash flow
- $9,762/yr
For passive investors: Depreciation is non-cash, so a rental often shows a tax loss while cash-flowing — sheltering income. Rental losses are passive: they offset passive income freely, and up to $25,000/yr can offset ordinary (W-2) income if you actively participate and your MAGI is under $100k (phasing out to $0 by $150k); unused losses carry forward. On sale, claimed depreciation is recaptured at up to 25%, and gains may owe capital-gains tax (a 1031 exchange can defer both). Figures are a year-1 estimate at your 24.0% rate — not tax advice; consult a CPA.
Schools (NCES district)
- District
- Seminole
- NCES district ID
- 1201710
- Math proficiency
- 57% ▼ -7.00%
- Reading proficiency
- 61% ▼ -1.00%
- Median HH income
- $58,478
- Composite
- 51.05/100
- National rank
- #1769
- State rank
- #13 of 73 in FL
Livability — Oviedo
- Score
- 80/100
- State rank
- #112
- US rank
- #1732
Category grades
Schools grade is shown separately in the Schools card above.
Census & demographics
- County
- Seminole County · 436,154 people
- City population
- 80,698
- Metro
- Orlando-Kissimmee-Sanford, FL
- Population (ZIP)
- 64,477
- Household income
- $102,167
- Rent vs Own
- Severe rent burden
- 2059.0
Population outlook (Seminole County) Hauer SSP2
- Today (2025)
- 515,494 people
- By 2030
- 545,713 · +5.9%
- By 2040
- 598,068 · +16.0%
- By 2050
- 640,663 · +24.3%
- By 2075
- 724,461 · +40.5%
- By 2100
- 755,530 · +46.6%
Race, ethnicity, and origin ACS 2023
- Neighborhood character
- Diverse neighborhood (Simpson 0.60)
- Race & ethnicity
- White 58% Hispanic / Latino 23% Two or more races 15% Black 8% Asian 6%
- Hispanic origin (detail)
- Mexican 3% Puerto Rican 9% Cuban 3% Dominican 1%
- Common ancestry
- Romanian 3% Lithuanian 3% Italian 2%
- Foreign-born
- 14% · Canada, China, Jamaica
- Languages at home
- 76% English-only · Spanish 16% Other Indo-European 2% Chinese 2%
Political lean MEDSL · Seminole
- 2024 margin
- Toss-up / Even · D 47.6% · R 51.1% · Other 1.3%
- 2008→2024 swing
- -0.8pp no change · 2008: -2.8pp · 2024: -3.5pp
- All cycles
- 2024: R+3.5 2020: D+2.8 2016: R+1.6 2012: R+6.5 2008: R+2.8
Not yet ingested
- Civics
- —
Market trends
- HPI YoY
- ▼ -76.94%
- Current HPI
- 315.5484
- Rent YoY
- ▲ 0.18%
- Metro
- Orlando-Kissimmee-Sanford, FL
- State GDP YoY
- ▲ 3.28%
- F500 in state
- 36
Industry mix (Fortune 500 HQ in FL)
| Industry | F500 HQs | Revenue |
|---|---|---|
| Industrial Technology | 2 | $29B |
|
||
| Insurance | 2 | $17B |
|
||
| Retail | 1 | $60B |
|
||
| Technology Distribution | 1 | $58B |
|
||
| Homebuilding | 1 | $35B |
|
||
| Technology Manufacturing | 1 | $35B |
|
||
Price history
1 event — show timeline
- 2026-05-22 Listed $99,000 Stellar MLS as Distributed by MLS Grid
Cash-flow waterfall
monthlySold comps — $/sqft
last 12 mo · ≤1 miLoading sold comps…