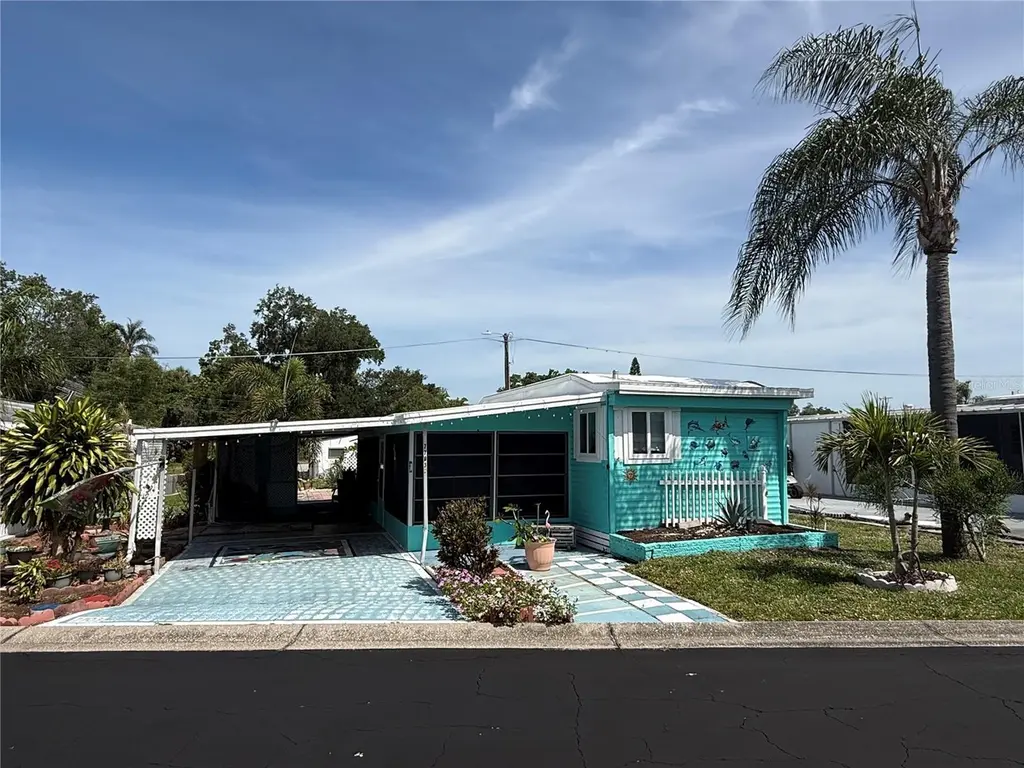
7703 Audry Ln · Bradenton, FL
Flood risk 3/10 · Minor
- FEMA flood zone
- X (unshaded)
- Chance of flooding over 30 yrs
- 0.2%
- Est. flood insurance / yr
- $507 – $1,088
Fire risk 1/10 · Minimal
- Est. fire insurance / yr
- $947 – $1,759
Heat risk 10/10 · Severe
- Hot days now (above 107°F)
- 7 days/yr
- Hot days in 30 yrs
- 29 days/yr
Wind risk 10/10 · Severe
- Chance of severe wind over 30 yrs
- 99.0%
Air-quality risk 3/10 · Minor
- Unhealthy air days now
- 3 days/yr
- Unhealthy air days in 30 yrs
- 3 days/yr
Risk factors via First Street. Map © Google.
Why this score? — see what drove the B grade
The composite is a weighted blend of 9 inputs, each scored 0–100. Each bar is that input's sub-score; the figure is the points it added to the 100-point composite (weight × sub-score).
- Cash flow +30.0/30.0
- 1% rule +10.0/10.0
- DSCR +10.0/10.0
- ARV discount +9.6/15.0
- Schools +4.4/10.0
- Livability +4.0/5.0
- Rent growth +2.5/5.0
- Condition / age +2.5/5.0
- Appreciation +0.0/10.0
$78,500
🖨 Deal sheet (PDF) 📄 Offer letter ✓ Due diligence
Listing remarks
Welcome to 7703 Audrey Lane, a charming and comfortable home located in the well-established Terrace Siesta Mobile Home Park, a 55+ community, right in the heart of Ellenton with convenient access to US-301 and Erie Road. This 2-bedroom, 1-bath home offers a functional layout with a warm, lived-in feel and plenty of character throughout. One of the standout features is the large enclosed front porch, complete with its own A/C, providing additional living space that can be used as a sitting area, hobby room, or a relaxing spot to enjoy your morning coffee year-round. Inside, the home features a comfortable kitchen with ample space for daily use, along with a layout that flows easily from roo
Key facts
- Covered carport
- Two clubhouses
- Private hot tub
Tags
Property features AI
Finance
- Other: Partially furnished; Third‑party listing; Living area reported as 624 sq ft
- Financial info: Lease restrictions apply; Total annual fees listed as $2,532
- HOA & community: Homeowners association (monthly fee $211); Association requires approval; Association amenities include clubhouse, laundry, pool, pickleball and shuffleboard courts; Association fee covers common area taxes, pool, private road, recreational facilities, sewer, trash and water; Community features: buyer approval required, deed restrictions, dog park, golf carts allowed; Senior community; Pets allowed (cats and dogs) with limits — max pet weight 25 lbs
Exterior
- Parking: Has a 1-space carport
- Utilities: Public water; Public sewer; Broadband/high‑speed internet available; Cable available; Electricity available and connected
- Home design: Mobile home (single wide); One story; Faces southwest; Completed condition
- Construction: Metal siding; Membrane roof; Other foundation type
- Exterior features: Covered, enclosed front porch; Shed(s) on property
Interior
- Kitchen: Microwave; Range; Refrigerator
- Bedrooms: 2 bedrooms
- Flooring: Carpet; Linoleum
- Bathrooms: 1 full bathroom
- Heating & cooling: Electric heating; Wall/window air conditioning units
- Interior features: No interior special features listed
- Laundry & utility: Laundry located outside
Neighborhood map
What this means for you Summary
Snapshot
- This is a 2-bed/1.0-bath manufactured listed at $78k.
Deal economics
- At list price, monthly cash flow is $798 ($10k/yr) — positive.
- The deal already cash-flows at list — no discount required.
- Meets the 1% rule at list price ($2k rent vs $78k).
- Recommended offer: $76k (3.0% below list) — sets the bar for market timing.
- Cap rate 18.5% vs local median 3.6% in Bradenton — top-decile yield for the area; either an underpriced asset or a hidden risk that comps aren't pricing in. Stress-test before assuming the spread holds.
Location & tenants
- Location reads 81/100 on livability (#101 in FL, #1,528 nationally) — a professional / high-income tenant draw. Strengths: commute A+, cost of living A+, housing A+; Watch: employment D+, crime D, amenities F.
- Manatee (suburban): math 54% / reading 50% proficiency, ranked #26 of 73 in FL (top 36%) — acceptable for families but not a draw, mixed tenant base, ~2y average lease.
- Zoned schools: Virgil Mills Elementary School (math 69% / reading 65%, grade B+, #450 of 2,144 statewide, top 22%, 818 students, 43% FRL); Palmetto High School (math 22% / reading 36%, grade F, #456 of 667 statewide, top 68%, 2,100 students, 61% FRL) — zoned schools at 52% FRL track the district average.
- Market conditions: 182 active listings in the ZIP; 1 comparable units currently listed for rent nearby; 7,472 units permitted in Manatee County in 2024 (1,782 in 5+ unit buildings).
- This rent runs 35% of the median local income ($64k/yr) — at the standard rent-burdened threshold; future hikes will face affordability resistance.
Forward outlook
- Local home prices are declining (-3.0%/yr); year-one equity from $543 of loan paydown is wiped out by about $2k of value loss. Plan a longer hold.
- Manatee County population projected at +43% by 2050 — long-run rental-demand tailwind backs the buy-and-hold thesis.
- At projected returns (-3.0% appreciation + 3.0% rent growth), your $22k cash investment doubles in ~3 years — after that, you're playing with house money.
Negotiation context
- It's been on market 42 days — a 3% lower offer ($76k) is reasonable based on typical stale-listing flexibility.
- Current owner paid $14k; list at $78k implies a 445% gain — meaningful room to come down on a strong offer.
Risks & watch-outs
- Climate carrying-cost: severe wind risk, 99% chance of damaging wind over 30y; extreme-heat days projected 7→29/yr by 2055 (HVAC capex compounding) — expect insurance premiums to compound above CPI over the hold.
Questions for the listing agent
- It's been on market 42 days. Have you received any prior offers? Is the seller open to a 3% concession, seller financing, or rate buy-down credit?
- Built in 1965 — when were the roof, HVAC, electrical panel, plumbing, and water heater last replaced?
- What does the HOA fee cover, when was the last increase, and are there any pending special assessments or reserve-fund shortfalls?
- Is there a deadline driving the sale (1031 exchange, divorce, estate, relocation)? That informs how much negotiation room exists.
- Crime grade is D in this area — have there been break-ins, vandalism, or insurance claims at this property in the last 3 years? What carrier currently insures it and at what premium?
- What's the average days-on-market for RENTAL listings here right now (not sales)? A rising rental-DOM trend means longer vacancies and softer asking-rent achievability than the comps imply.
- What's the recent tenant-quality profile in this submarket — average credit score on applications, eviction rate, late-payment / NSF rate, and stable-employment percentage? A property-management company in the area should have these aggregated.
- How much new for-sale + rental construction is in the pipeline within 1–3 miles? Heavy new supply typically softens prices + rents 12–24 months out; constrained supply supports both.
Investment metrics
- 1% rule
- 2.38% ✓
- Cap rate
- 18.49%
- Cash-on-cash
- 43.57%
- DSCR
- 2.94
- GRM
- 3.5
CMA / ARV
- ARV (on-the-fly)
- $82,368
- Comps found
- 3
Show comp detail 3 sales within ~0.75 mi
| Address | Dist | Beds/Ba | Sqft | Sold | Price | $/sf | Match |
|---|---|---|---|---|---|---|---|
| 7704 Terra Siesta Blvd | 0.02mi | 2/1.0 | 612 (-2%) | 2mo | $81,000 | $132 | 94 |
| 3109 Cynthia Pl | 0.10mi | 1/1.0 (-1) | 600 (-4%) | 1mo | $87,000 | $145 | 83 |
| 3107 Darnea Ln | 0.17mi | 2/2.0 | 672 (+8%) | 0mo | $89,000 | $132 | 75 |
Match score weights: distance 35% · size 25% · config 20% · recency 20%. Top-matched comps best support the ARV.
Projected returns pro-forma
-3.0% appreciation · 3.0% rent growth · sell at horizon
- IRR
- 40.5%
- Equity multiple
- 2.74×
- Total profit
- $38,219
- Equity at exit
- $11,705
- IRR
- 46.8%
- Equity multiple
- 5.51×
- Total profit
- $99,181
- Equity at exit
- $6,787
Cash invested: $21,980 (down + closing). Projections, not guarantees.
Landlord ↔ Tenant lean methodology
- Overall (STATE)
- 87 Strongly Landlord-Friendly
- State Florida
- 87 Strongly Landlord-Friendly · R+3
- County
- — inherits STATE
- City
- — inherits STATE
ZIP-level market 34222
- Home prices YoY
- -26.9%
- Active inventory
- 182
- Price-to-rent
- 3.5×
Monthly cashflow live
- Estimated rent
- $1,868 medium interval (Pro) →
- Mortgage (P&I)
- −$412
- Tax from tax record
- −$22 /mo · $264/yr
- Insurance
- −$33
- HOA
- −$211
- Vacancy / Maint / Mgmt
- −$392
- Net cashflow
- $798
Break-even live
Sensitivity live
| Price | -10% $842 | -5% $820 | +0% $798 | +5% $776 | +10% $754 |
|---|---|---|---|---|---|
| Rent | -10% $651 | -5% $724 | +0% $798 | +5% $872 | +10% $946 |
| Rate | -1.0pp $838 | -0.5pp $818 | base $798 | +0.5pp $778 | +1.0pp $757 |
UW: 25.0% down · 7.5% · 30yr · 1.5% tax · 5.0% vac · 8.0% maint · 8.0% mgmt
Financing live
Cash to close
- Down payment
- $19,625
- Closing costs
- $2,355
- Reserves months
- —
- Total cash needed
- —
Loan-product check · same deal, 3 products live
Conventional
25% down · 7.5% · 30yr
- Down + closing
- —
- Monthly P&I
- —
- Monthly cashflow
- —
- DSCR
- —
- Eligible?
- —
Personal DTI + credit; lowest rate.
DSCR
20% down · 8.5% · 30yr
- Down + closing
- —
- Monthly P&I
- —
- Monthly cashflow
- —
- DSCR
- —
- Eligible?
- —
No personal income docs; deal must DSCR.
Hard money
10% down · 12.0% · 12mo
- Down + closing
- —
- Monthly P&I
- —
- Monthly cashflow
- —
- DSCR
- —
- Eligible?
- —
Short-term bridge; refi at stabilization.
Rent comps 1 comps
| Address | Beds | Baths | Sqft | Rent | $/sqft | DOM | Units | Dist |
|---|---|---|---|---|---|---|---|---|
| 5942 Factory Shops Blvd Ellenton, FL | 1.0–3.0 | 1.0–2.0 | 953 | $2,362 | $2.48 | 2d | 67 | 1.22mi |
HOA detail
- Monthly dues
- $211 · $2,532/yr
Listing history 17 events
-
2026-06-18days on market $78,500 Active 42 DOM
-
2026-06-17days on market $78,500 Active 41 DOM
-
2026-06-16days on market $78,500 Active 40 DOM
-
2026-06-15days on market $78,500 Active 39 DOM
-
2026-06-13days on market $78,500 Active 37 DOM
-
2026-06-13days on market $78,500 Active 36 DOM
-
2026-06-10pricedays on market $78,500 Active 34 DOM
-
2026-06-09days on market $86,000 Active 33 DOM
-
2026-06-08days on market $86,000 Active 32 DOM
-
2026-06-08days on market $86,000 Active 31 DOM
-
2026-06-03days on market $86,000 Active 27 DOM
-
2026-06-02days on market $86,000 Active 26 DOM
-
2026-06-01days on market $86,000 Active 25 DOM
-
2026-05-31days on market $86,000 Active 24 DOM
-
2026-05-07$86,000 Active
-
2003-08-11soldstatus $14,400
-
1993-12-21soldstatus $19,000
ⓘ Source: listings_history table (triggers on properties + properties_extension) + one-shot
backfill from property_details.listing_events for pre-trigger history.
Tax reassessment forecast FL · Resets to sale price
- Current annual tax
- $264 · $22/mo
- Projected year-2 tax
- $652 · $54/mo
- Expected delta
- +$387/yr (+$32/mo · 146.4%)
ⓘ Screening estimate from a state-policy table — verify with the county assessor before closing.
Climate risk First Street
- Flood 3/10 Moderate FEMA zone X (unshaded) · 20% chance over 30 yrs
- Wildfire 1/10 Low
- Heat 10/10 Extreme 7 d/yr ≥107°F today · 29 d/yr by 30 yrs out
- Wind 10/10 Extreme 99% chance of damaging wind over 30 yrs
- Air quality 3/10 Moderate 3 unhealthy d/yr today · 3 by 30 yrs out
Nearby sold comps map
Loading sold comps map…
Walkable amenities ~0.75 mi
Loading nearby amenities…
Taxation est. · year 1
- Rental income
- $22,412
- − Mortgage interest
- −$4,397
- − Property taxes
- −$264
- − Insurance
- −$392
- − Repairs & maintenance
- −$1,793
- − Management
- −$1,793
- − HOA
- −$2,532
- − Depreciation
- −$2,284
- Taxable income
- $8,956
- Est. tax owed @ 24.0%
- −$2,150
- After-tax cash flow
- $7,427/yr
For passive investors: Depreciation is non-cash, so a rental often shows a tax loss while cash-flowing — sheltering income. Rental losses are passive: they offset passive income freely, and up to $25,000/yr can offset ordinary (W-2) income if you actively participate and your MAGI is under $100k (phasing out to $0 by $150k); unused losses carry forward. On sale, claimed depreciation is recaptured at up to 25%, and gains may owe capital-gains tax (a 1031 exchange can defer both). Figures are a year-1 estimate at your 24.0% rate — not tax advice; consult a CPA.
Schools (NCES district)
- District
- Manatee
- NCES district ID
- 1201230
- Math proficiency
- 54% ▼ -6.00%
- Reading proficiency
- 50% ▼ -2.00%
- Median HH income
- $49,607
- Composite
- 44.43/100
- National rank
- #2806
- State rank
- #26 of 73 in FL
Livability — Bradenton
- Score
- 81/100
- State rank
- #101
- US rank
- #1528
Category grades
Schools grade is shown separately in the Schools card above.
Census & demographics
- County
- Manatee County · 416,364 people
- City population
- 227,091
- Metro
- North Port-Sarasota-Bradenton, FL
- Population (ZIP)
- 14,819
- Household income
- $64,355
- Rent vs Own
- Severe rent burden
- 313.0
Population outlook (Manatee County) Hauer SSP2
- Today (2025)
- 447,342 people
- By 2030
- 488,911 · +9.3%
- By 2040
- 567,934 · +27.0%
- By 2050
- 637,995 · +42.6%
- By 2075
- 781,970 · +74.8%
- By 2100
- 848,272 · +89.6%
Race, ethnicity, and origin ACS 2023
- Neighborhood character
- Predominantly White (70%)
- Race & ethnicity
- White 70% Hispanic / Latino 17% Two or more races 13% Black 7% Native American 2% Asian 1%
- Hispanic origin (detail)
- Mexican 8% Puerto Rican 2%
- Common ancestry
- Romanian 3% Slovak 2% Lithuanian 2%
- Foreign-born
- 8% · Canada, Jamaica, Vietnam
- Languages at home
- 88% English-only · Spanish 10% Other Indo-European 1% Vietnamese 1%
Political lean MEDSL · Manatee
- 2024 margin
- Strong R (+23.5) · D 37.9% · R 61.4%
- 2008→2024 swing
- -16.5pp toward R · 2008: -7.0pp · 2024: -23.5pp
- All cycles
- 2024: R+23.5 2020: R+16.1 2016: R+17.1 2012: R+12.5 2008: R+7.0
Not yet ingested
- Civics
- —
Market trends
- HPI YoY
- ▼ -107.75%
- Current HPI
- 293.2597
- Rent YoY
- —
- Metro
- North Port-Sarasota-Bradenton, FL
- State GDP YoY
- ▲ 3.28%
- F500 in state
- 36
Industry mix (Fortune 500 HQ in FL)
| Industry | F500 HQs | Revenue |
|---|---|---|
| Industrial Technology | 2 | $29B |
|
||
| Insurance | 2 | $17B |
|
||
| Retail | 1 | $60B |
|
||
| Technology Distribution | 1 | $58B |
|
||
| Homebuilding | 1 | $35B |
|
||
| Technology Manufacturing | 1 | $35B |
|
||
Price history
+352.6% since first listed3 events — show timeline
- 2026-05-07 Listed $86,000 Stellar MLS as Distributed by MLS Grid
- 2003-08-11 Sold (Public Records) $14,400 Public Records
- 1993-12-21 Sold (Public Records) $19,000 Public Records
Property tax history
+4.8%/yrLatest (2025): $264 · +7.5% YoY. Source: county tax records.
Cash-flow waterfall
monthlySold comps — $/sqft
last 12 mo · ≤1 miLoading sold comps…