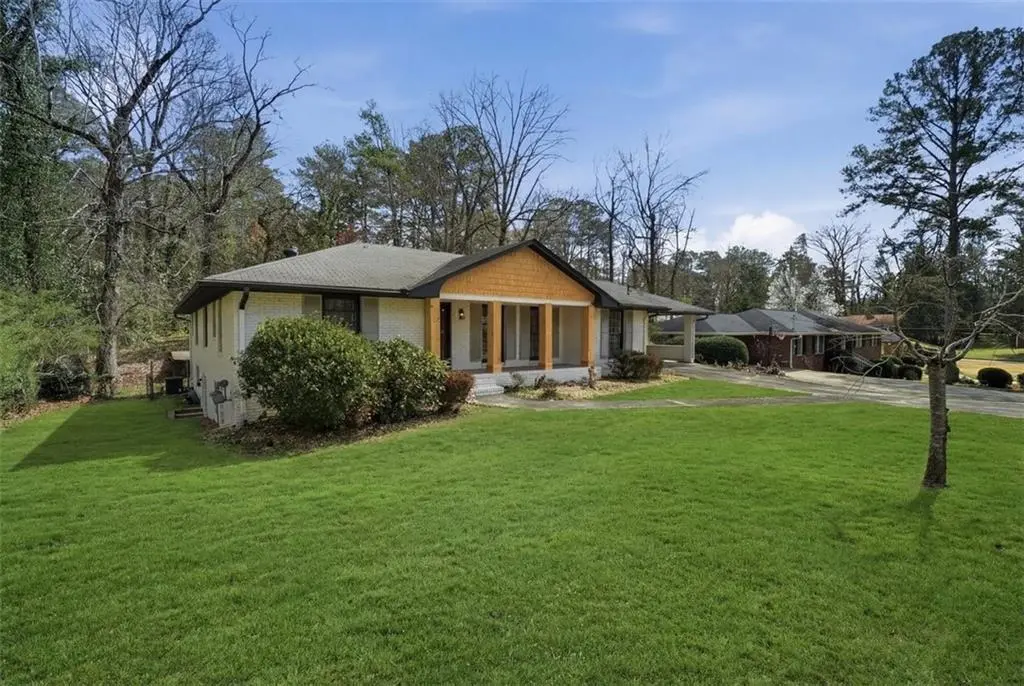
1006 Burnt Hickory Dr SW · Atlanta, GA
Flood risk 1/10 · Minimal
- FEMA flood zone
- X (unshaded)
- Chance of flooding over 30 yrs
- 0.0%
- Est. flood insurance / yr
- $473 – $860
Fire risk 1/10 · Minimal
- Est. fire insurance / yr
- $963 – $1,789
Heat risk 5/10 · Moderate
- Hot days now (above 103°F)
- 7 days/yr
- Hot days in 30 yrs
- 18 days/yr
Wind risk 4/10 · Minor
- Chance of severe wind over 30 yrs
- 24.0%
Air-quality risk 3/10 · Minor
- Unhealthy air days now
- 3 days/yr
- Unhealthy air days in 30 yrs
- 3 days/yr
Risk factors via First Street. Map © Google.
Why this score? — see what drove the D grade
The composite is a weighted blend of 9 inputs, each scored 0–100. Each bar is that input's sub-score; the figure is the points it added to the 100-point composite (weight × sub-score).
- ARV discount +15.0/15.0
- Cash flow +10.2/30.0
- Livability +4.2/5.0
- DSCR +2.9/10.0
- Schools +2.7/10.0
- Rent growth +2.5/5.0
- Condition / age +2.5/5.0
- 1% rule +1.9/10.0
- Appreciation +0.0/10.0
$317,000
🖨 Deal sheet (PDF) 📄 Offer letter ✓ Due diligence
Listing remarks MLS
Welcome to this Brick front spacious 3bed 2 bath home with open and bright concept..level front yard with lots of space with fenced backyard..NO HOA...Easy access to I-285, Mercedes Benz Stadium and Westside Beltline, offering the best in town living
Key facts
- 0.41 acre lot
- 2 parking spots
- Built 1960
Neighborhood map
What this means for you Summary
Snapshot
- This is a 3-bed/2.0-bath single-family listed at $317k.
Deal economics
- At list price, monthly cash flow is $-181 ($-2k/yr) — negative.
- To cash-flow at today's rent, offer at most $285k (10.1% below list).
- To meet the 1% rule (rent ≥ 1% of price), the offer needs to be $219k (30.8% below list).
- Recommended offer: $219k (30.8% below list) — sets the bar for 1% rule.
- Cap rate 5.6% vs local median 3.1% in Atlanta — top-decile yield for the area; either an underpriced asset or a hidden risk that comps aren't pricing in. Stress-test before assuming the spread holds.
Location & tenants
- Location reads 83/100 on livability (#6 in GA, #919 nationally) — a professional / high-income tenant draw. Strengths: amenities A+, commute A+, housing A+; Watch: cost of living C-.
- Atlanta Public Schools (urban): math 28% / reading 35% proficiency, ranked #80 of 174 in GA (top 46%) — families likely to look elsewhere, expect single-tenant / working-renter base with shorter leases; 71% free/reduced lunch — lower-income household profile, screen leases tightly.
- Zoned schools: Kipp Ways Primary Charter School (math 5% / reading 5%, grade F, #1,160 of 1,228 statewide, top 98%, 477 students, 100% FRL, charter); Jean Childs Young Middle School (math 2% / reading 12%, grade F, #449 of 470 statewide, top 97%, 747 students, 100% FRL); Benjamin E. Mays High School (math 22% / reading 15%, grade F, #254 of 424 statewide, top 61%, 1,337 students, 100% FRL) — zoned schools average 100% FRL vs 71% district-wide (29 pts higher); higher-poverty schools than district average — tighter screening recommended.
- Zoned-school proficiency averages 10% at this address vs 32% district-wide (-21 pts) — the specific schools serving this property underperform the Atlanta Public Schools average; the district grade overstates school quality for this exact location.
- Market conditions: Rents soft (-0.2%/yr); 250 active listings in the ZIP; 30 comparable units currently listed for rent nearby; rentals at typical pace (median 27d on market — plan ~3-4 weeks tenant-placement turnaround); 11,565 units permitted in Fulton County in 2024 (8,159 in 5+ unit buildings).
- At $2,193/mo this rent would consume 52% of the median local household income ($51k/yr) (locally 2825% of renters already pay >50% of income on rent) — very limited rent-growth headroom before tenants either downsize or default.
Forward outlook
- Local home prices are declining (-3.0%/yr); year-one equity from $2k of loan paydown is wiped out by about $10k of value loss. Plan a longer hold.
- Fulton County population projected at +38% by 2050 — long-run rental-demand tailwind backs the buy-and-hold thesis.
Negotiation context
- It's been on market 120 days — a 9% lower offer ($288k) is reasonable based on typical stale-listing flexibility.
- Current owner paid $240k; 32% above their basis — modest negotiation headroom, anchor on the comps not their cost.
Risks & watch-outs
- Climate carrying-cost: extreme-heat days projected 7→18/yr by 2055 (HVAC capex compounding) — expect insurance premiums to compound above CPI over the hold.
Questions for the listing agent
- What do current leases actually rent for vs. the listed asking? Can we see a recent rent roll and the last 12 months of T-12 income?
- It's been on market 120 days. Have you received any prior offers? Is the seller open to a 31% concession, seller financing, or rate buy-down credit?
- Built in 1960 — when were the roof, HVAC, electrical panel, plumbing, and water heater last replaced?
- Why hasn't it sold? Are there any deal-killer items the seller is aware of (foundation, flood, title, zoning, code violations)?
- Is there a deadline driving the sale (1031 exchange, divorce, estate, relocation)? That informs how much negotiation room exists.
- The area grade is low — what's the realistic commute time and amenity access for the typical tenant pool here? Any planned neighborhood developments (good or bad) we should know about?
- What's the average days-on-market for RENTAL listings here right now (not sales)? A rising rental-DOM trend means longer vacancies and softer asking-rent achievability than the comps imply.
- What's the recent tenant-quality profile in this submarket — average credit score on applications, eviction rate, late-payment / NSF rate, and stable-employment percentage? A property-management company in the area should have these aggregated.
- How much new for-sale + rental construction is in the pipeline within 1–3 miles? Heavy new supply typically softens prices + rents 12–24 months out; constrained supply supports both.
Investment metrics
- 1% rule
- 0.69% ✗
- Cap rate
- 5.61%
- Cash-on-cash
- -2.44%
- DSCR
- 0.89
- GRM
- 12.0
CMA / ARV
- ARV (median comp)
- $486,321
- List price
- $317,000
- Delta
- -34.82%
- Verdict
- UNDERPRICED
- Comps
- 20 within 1.0 mi
Show comp detail 12 sales within ~0.75 mi
| Address | Dist | Beds/Ba | Sqft | Sold | Price | $/sf | Match |
|---|---|---|---|---|---|---|---|
| 3457 Spreading Oak Dr SW | 0.34mi | 3/2.0 | 1,564 (-2%) | 7mo | $205,000 | $131 | 75 |
| 3330 SW Pamlico Dr | 0.36mi | 3/2.0 | 1,502 (-6%) | 6mo | $280,000 | $186 | 69 |
| 3137 Ardley Rd SW | 0.33mi | 4/2.0 (+1) | 1,665 (+5%) | 8mo | $259,900 | $156 | 65 |
| 3280 Hazelwood Dr SW | 0.10mi | 3/2.0 | 1,826 (+15%) | 9mo | $355,000 | $194 | 64 |
| 3219 W Manor Ln | 0.64mi | 3/2.0 | 1,592 (+0%) | 9mo | $349,000 | $219 | 62 |
| 835 Lynn Cir SW | 0.68mi | 3/3.0 | 1,634 (+3%) | 1mo | $363,000 | $222 | 59 |
| 3281 Annelaine Dr SW | 0.51mi | 3/2.5 | 1,733 (+9%) | 2mo | $330,000 | $190 | 58 |
| 1026 Lynhurst Dr SW | 0.48mi | 3/2.0 | 1,728 (+9%) | 15mo | $285,000 | $165 | 50 |
| 3195 Benjamin E Mays Dr SW | 0.53mi | 3/2.0 | 1,826 (+15%) | 11mo | $230,000 | $126 | 42 |
| 3209 W Manor Cir SW | 0.65mi | 2/1.0 (-1) | 1,389 (-13%) | 0mo | $160,000 | $115 | 39 |
| 970 Tuckawanna Dr | 0.66mi | 3/1.0 | 1,471 (-8%) | 17mo | $250,000 | $170 | 39 |
| 3175 W Manor Cir SW | 0.69mi | 4/2.5 (+1) | 1,811 (+14%) | 8mo | $395,000 | $218 | 31 |
Match score weights: distance 35% · size 25% · config 20% · recency 20%. Top-matched comps best support the ARV.
Projected returns pro-forma
-3.0% appreciation · 0.0% rent growth · sell at horizon
- IRR
- -23.3%
- Equity multiple
- 0.22×
- Total profit
- $-69,449
- Equity at exit
- $47,266
- IRR
- -27.1%
- Equity multiple
- -0.13×
- Total profit
- $-100,702
- Equity at exit
- $27,408
Cash invested: $88,760 (down + closing). Projections, not guarantees.
Landlord ↔ Tenant lean methodology
- Overall (STATE)
- 90 Strongly Landlord-Friendly
- State Georgia
- 90 Strongly Landlord-Friendly · R+3
- County
- — inherits STATE
- City
- — inherits STATE
ZIP-level market 30311
- Home prices YoY
- -33.3%
- Rents YoY
- -0.2%
- Active inventory
- 250
- Price-to-rent
- 12.0×
Monthly cashflow live
- Estimated rent
- $2,193 high interval (Pro) →
- Mortgage (P&I)
- −$1,662
- Tax from tax record
- −$119 /mo · $1,428/yr
- Insurance
- −$132
- HOA
- −$0
- Vacancy / Maint / Mgmt
- −$461
- Net cashflow
- $-181
Break-even live
Sensitivity live
| Price | -10% $-1 | -5% $-91 | +0% $-181 | +5% $-271 | +10% $-360 |
|---|---|---|---|---|---|
| Rent | -10% $-354 | -5% $-267 | +0% $-181 | +5% $-94 | +10% $-8 |
| Rate | -1.0pp $-21 | -0.5pp $-100 | base $-181 | +0.5pp $-263 | +1.0pp $-347 |
UW: 25.0% down · 7.5% · 30yr · 1.5% tax · 5.0% vac · 8.0% maint · 8.0% mgmt
Financing live
Cash to close
- Down payment
- $79,250
- Closing costs
- $9,510
- Reserves months
- —
- Total cash needed
- —
Loan-product check · same deal, 3 products live
Conventional
25% down · 7.5% · 30yr
- Down + closing
- —
- Monthly P&I
- —
- Monthly cashflow
- —
- DSCR
- —
- Eligible?
- —
Personal DTI + credit; lowest rate.
DSCR
20% down · 8.5% · 30yr
- Down + closing
- —
- Monthly P&I
- —
- Monthly cashflow
- —
- DSCR
- —
- Eligible?
- —
No personal income docs; deal must DSCR.
Hard money
10% down · 12.0% · 12mo
- Down + closing
- —
- Monthly P&I
- —
- Monthly cashflow
- —
- DSCR
- —
- Eligible?
- —
Short-term bridge; refi at stabilization.
Rent comps 30 comps
| Address | Beds | Baths | Sqft | Rent | $/sqft | DOM | Units | Dist |
|---|---|---|---|---|---|---|---|---|
| 871 Laurelmont Dr SW Atlanta, GA | 3.0 | 2.0 | 1210 | $1,750 | $1.45 | 0d | 1 | 0.33mi |
| 1026 Lynhurst Dr SW Atlanta, GA | 3.0 | 2.0 | 1728 | $2,500 | $1.45 | 14d | 1 | 0.50mi |
| 1026 Lynhurst Dr SW Atlanta, GA | 3.0 | 2.0 | 1728 | $2,500 | $1.45 | 1d | 1 | 0.50mi |
| 1284 Lynhurst Dr SW Atlanta, GA | 3.0 | 2.0 | 1978 | $2,050 | $1.04 | 20d | 1 | 0.74mi |
| 3311 Rabun Dr SW Atlanta, GA | 3.0 | 2.0 | 1523 | $2,350 | $1.54 | 26d | 1 | 0.85mi |
| 3039 Lynn Dr SW Atlanta, GA | 3.0 | 2.0 | 1756 | $2,300 | $1.31 | 26d | 1 | 0.86mi |
| 3606 Ginnis Dr SW #8 Atlanta, GA | 2.0 | 2.5 | 1224 | $1,411 | $1.15 | 9d | 1 | 0.89mi |
| 3616 Utoy Dr SW Atlanta, GA | 3.0 | 3.5 | 1496 | $1,950 | $1.30 | 45d | 1 | 0.91mi |
| 513 Constellation Overlook SW Atlanta, GA | 3.0 | 2.5 | 1446 | $2,300 | $1.59 | 26d | 1 | 1.01mi |
| 658 Providence Pl SW Atlanta, GA | 3.0 | 3.5 | 1571 | $2,100 | $1.34 | 26d | 1 | 1.07mi |
| 200 Suttles Dr SW Atlanta, GA | 3.0 | 2.5 | 1900 | $2,123 | $1.12 | 26d | 1 | 1.08mi |
| 778 Nehemiah Ln SW Atlanta, GA | 2.0 | 2.5 | 1576 | $1,950 | $1.24 | 26d | 1 | 1.09mi |
| 648 Providence Pl SW #37 Atlanta, GA | 3.0 | 3.5 | 1416 | $2,195 | $1.55 | 1d | 1 | 1.09mi |
| 648 Providence Pl SW #37 Atlanta, GA | 3.0 | 3.5 | 1416 | $2,195 | $1.55 | 26d | 1 | 1.09mi |
| 751 Fairburn Rd SW Atlanta, GA | 1.0–3.0 | 1.0–2.0 | 1162 | $2,170 | $1.87 | 1d | 31 | 1.12mi |
| 1580 Childress Dr SW Atlanta, GA | 4.0 | 2.0 | 1746 | $2,250 | $1.29 | 16d | 1 | 1.12mi |
| 708 Crestwell Cir SW Atlanta, GA | 2.0 | 2.5 | 1236 | $1,645 | $1.33 | 26d | 1 | 1.22mi |
| 722 Crestwell Cir #722 Atlanta, GA | 2.0 | 3.0 | 1440 | $2,279 | $1.58 | 22d | 1 | 1.24mi |
| 755 Crestwell Cir SW Atlanta, GA | 2.0 | 2.5 | 1546 | $1,800 | $1.16 | 26d | 1 | 1.26mi |
| 897 Ambient Way SW Atlanta, GA | 2.0 | 2.5 | 1500 | $2,155 | $1.44 | 26d | 1 | 1.26mi |
| 887 Ambient Way SW Atlanta, GA | 2.0 | 2.5 | 1344 | $2,250 | $1.67 | 26d | 1 | 1.27mi |
| 975 Society Cir SW Atlanta, GA | 4.0 | 3.5 | 1700 | $2,350 | $1.38 | 4d | 1 | 1.27mi |
| 832 Ambient Way SW Atlanta, GA | 2.0 | 2.5 | 1500 | $2,250 | $1.50 | 26d | 1 | 1.32mi |
| 841 Ambient Way SW Atlanta, GA | 2.0 | 2.5 | 1344 | $1,895 | $1.41 | 1d | 1 | 1.33mi |
| 841 Ambient Way SW Atlanta, GA | 2.0 | 2.5 | 1344 | $1,895 | $1.41 | 19d | 1 | 1.33mi |
| 865 Society Cir SW Atlanta, GA | 4.0 | 3.5 | 1440 | $2,700 | $1.88 | 1d | 1 | 1.35mi |
| 900 Society Cir SW Atlanta, GA | 4.0 | 3.5 | 1710 | $2,500 | $1.46 | 26d | 1 | 1.35mi |
| 415 Fairburn Rd SW Atlanta, GA | 1.0–3.0 | 1.0–2.0 | 890 | $1,490 | $1.67 | 1d | 31 | 1.38mi |
| 3230 Cushman Cir SW Atlanta, GA | 2.0 | 1.0 | 1143 | $1,200 | $1.05 | 9d | 1 | 1.43mi |
| 460 Peyton Rd SW Unit B Atlanta, GA | 2.0 | 2.0 | 1500 | $2,000 | $1.33 | 26d | 1 | 1.49mi |
Listing history 22 events
-
2026-06-21pricedays on market $317,000 Active 120 DOM
-
2026-06-18days on market $337,000 Active 117 DOM
-
2026-06-17days on market $337,000 Active 116 DOM
-
2026-06-16days on market $337,000 Active 115 DOM
-
2026-06-15days on market $337,000 Active 114 DOM
-
2026-06-13days on market $337,000 Active 112 DOM
-
2026-06-13days on market $337,000 Active 111 DOM
-
2026-06-09days on market $337,000 Active 108 DOM
-
2026-06-08days on market $337,000 Active 107 DOM
-
2026-06-07days on market $337,000 Active 106 DOM
-
2026-06-04days on market $337,000 Active 103 DOM
-
2026-06-03days on market $337,000 Active 102 DOM
-
2026-06-02days on market $337,000 Active 101 DOM
-
2026-05-31days on market $337,000 Active 100 DOM
-
2026-05-14price $357,000 250-char remark
Show marketing remark (250 chars)
Welcome to this Brick front spacious 3bed 2 bath home with open and bright concept..level front yard with lots of space with fenced backyard..NO HOA...Easy access to I-285, Mercedes Benz Stadium and Westside Beltline, offering the best in town living
-
2026-04-07price $367,000 250-char remark
Show marketing remark (250 chars)
Welcome to this Brick front spacious 3bed 2 bath home with open and bright concept..level front yard with lots of space with fenced backyard..NO HOA...Easy access to I-285, Mercedes Benz Stadium and Westside Beltline, offering the best in town living
-
2026-03-18price $377,000 250-char remark
Show marketing remark (250 chars)
Welcome to this Brick front spacious 3bed 2 bath home with open and bright concept..level front yard with lots of space with fenced backyard..NO HOA...Easy access to I-285, Mercedes Benz Stadium and Westside Beltline, offering the best in town living
-
2026-02-20$387,000 Active 250-char remark
Show marketing remark (250 chars)
Welcome to this Brick front spacious 3bed 2 bath home with open and bright concept..level front yard with lots of space with fenced backyard..NO HOA...Easy access to I-285, Mercedes Benz Stadium and Westside Beltline, offering the best in town living
-
2026-02-19historical $387,000 250-char remark
Show marketing remark (250 chars)
Welcome to this Brick front spacious 3bed 2 bath home with open and bright concept..level front yard with lots of space with fenced backyard..NO HOA...Easy access to I-285, Mercedes Benz Stadium and Westside Beltline, offering the best in town living
-
2025-04-21soldstatus $240,000
-
2025-04-15soldstatus $220,000
-
1975-07-31soldstatus $47,000
ⓘ Source: listings_history table (triggers on properties + properties_extension) + one-shot
backfill from property_details.listing_events for pre-trigger history.
Tax reassessment forecast GA · Resets to sale price
- Current annual tax
- $1,428 · $119/mo
- Projected year-2 tax
- $2,916 · $243/mo
- Expected delta
- +$1,488/yr (+$124/mo · 104.2%)
ⓘ Screening estimate from a state-policy table — verify with the county assessor before closing.
Climate risk First Street
- Flood 1/10 Low FEMA zone X (unshaded) · 0% chance over 30 yrs
- Wildfire 1/10 Low
- Heat 5/10 Major 7 d/yr ≥103°F today · 18 d/yr by 30 yrs out
- Wind 4/10 Moderate 24% chance of damaging wind over 30 yrs
- Air quality 3/10 Moderate 3 unhealthy d/yr today · 3 by 30 yrs out
Nearby sold comps map
Loading sold comps map…
Walkable amenities ~0.75 mi
Loading nearby amenities…
Taxation est. · year 1
- Rental income
- $26,319
- − Mortgage interest
- −$17,757
- − Property taxes
- −$1,428
- − Insurance
- −$1,585
- − Repairs & maintenance
- −$2,106
- − Management
- −$2,106
- − Depreciation
- −$9,222
- Taxable loss
- −$7,884
- Est. tax savings @ 24.0%
- +$1,892
- After-tax cash flow
- $-278/yr
For passive investors: Depreciation is non-cash, so a rental often shows a tax loss while cash-flowing — sheltering income. Rental losses are passive: they offset passive income freely, and up to $25,000/yr can offset ordinary (W-2) income if you actively participate and your MAGI is under $100k (phasing out to $0 by $150k); unused losses carry forward. On sale, claimed depreciation is recaptured at up to 25%, and gains may owe capital-gains tax (a 1031 exchange can defer both). Figures are a year-1 estimate at your 24.0% rate — not tax advice; consult a CPA.
Schools (NCES district)
- District
- Atlanta Public Schools
- NCES district ID
- 1300120
- Math proficiency
- 28% ▼ -6.00%
- Reading proficiency
- 35% ▼ -2.00%
- Median HH income
- $48,306
- Composite
- 27.27/100
- National rank
- #7006
- State rank
- #80 of 174 in GA
Livability — Atlanta
- Score
- 83/100
- State rank
- #6
- US rank
- #919
Category grades
Schools grade is shown separately in the Schools card above.
Census & demographics
- Census place
- Atlanta, GA
- County
- Fulton County · 1,094,430 people
- City population
- 629,525
- Metro
- Atlanta-Sandy Springs-Alpharetta, GA
- Population (ZIP)
- 34,953
- Household income
- $50,649
- Rent vs Own
- Severe rent burden
- 2825.0
Population outlook (Fulton County) Hauer SSP2
- Today (2025)
- 1,203,707 people
- By 2030
- 1,299,706 · +8.0%
- By 2040
- 1,488,256 · +23.6%
- By 2050
- 1,664,580 · +38.3%
- By 2075
- 2,036,072 · +69.2%
- By 2100
- 2,222,402 · +84.6%
Race, ethnicity, and origin ACS 2023
- Neighborhood character
- Predominantly Black (89%)
- Race & ethnicity
- Black 89% Hispanic / Latino 4% Two or more races 4% White 3%
- Common ancestry
- Hispanic 1%
- Foreign-born
- 5% · Canada
- Languages at home
- 93% English-only · Spanish 3% French/Haitian/Cajun 1% Korean 1%
Political lean MEDSL · Fulton
- 2024 margin
- Solid D (+44.9) · D 71.9% · R 27.0% · Other 1.1%
- 2008→2024 swing
- +9.8pp toward D · 2008: 35.0pp · 2024: 44.9pp
- All cycles
- 2024: D+44.9 2020: D+46.4 2016: D+42.1 2012: D+29.6 2008: D+35.0
Not yet ingested
- Civics
- —
Market trends
- HPI YoY
- ▼ -129.99%
- Current HPI
- 259.954
- Rent YoY
- ▼ -0.19%
- Metro
- Atlanta-Sandy Springs-Alpharetta, GA
- State GDP YoY
- ▲ 2.66%
- F500 in state
- 28
Industry mix (Fortune 500 HQ in GA)
| Industry | F500 HQs | Revenue |
|---|---|---|
| Paper / Packaging | 2 | $29B |
|
||
| Retail | 1 | $160B |
|
||
| Transportation / Logistics | 1 | $91B |
|
||
| Airlines | 1 | $62B |
|
||
| Consumer Goods | 1 | $47B |
|
||
| Utilities | 1 | $25B |
|
||
Price history
+659.6% since first listed8 events — show timeline
- 2026-05-14 Price Changed $357,000 FMLS
- 2026-04-07 Price Changed $367,000 FMLS
- 2026-03-18 Price Changed $377,000 FMLS
- 2026-02-20 Listed $387,000 FMLS
- 2026-02-19 Coming Soon $387,000 FMLS
- 2025-04-21 Sold (Public Records) $240,000 Public Records
- 2025-04-15 Sold (Public Records) $220,000 Public Records
- 1975-07-31 Sold (Public Records) $47,000 Public Records
Property tax history
-2.7%/yrLatest (2025): $1,428 · -7.5% YoY. Source: county tax records.
Cash-flow waterfall
monthlySold comps — $/sqft
last 12 mo · ≤1 miLoading sold comps…