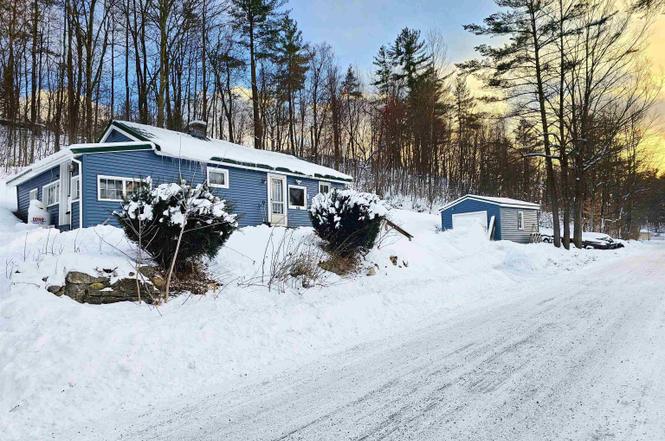
818 Old Depot Rd · Arlington, VT
Flood risk 1/10 · Minimal
- FEMA flood zone
- X (unshaded)
- Chance of flooding over 30 yrs
- 0.0%
- Est. flood insurance / yr
- $507 – $1,088
Fire risk 3/10 · Minor
- Est. fire insurance / yr
- $480 – $892
Heat risk 2/10 · Minimal
- Hot days now (above 87°F)
- 7 days/yr
- Hot days in 30 yrs
- 17 days/yr
Wind risk 3/10 · Minor
- Chance of severe wind over 30 yrs
- 5.0%
Air-quality risk 2/10 · Minimal
- Unhealthy air days now
- 0 days/yr
- Unhealthy air days in 30 yrs
- 1 days/yr
Risk factors via First Street. Map © Google.
Why this score? — see what drove the B grade
The composite is a weighted blend of 9 inputs, each scored 0–100. Each bar is that input's sub-score; the figure is the points it added to the 100-point composite (weight × sub-score).
- Cash flow +30.0/30.0
- DSCR +10.0/10.0
- 1% rule +8.4/10.0
- ARV discount +7.5/15.0
- Appreciation +5.0/10.0
- Schools +5.0/10.0
- Livability +2.9/5.0
- Rent growth +2.5/5.0
- Condition / age +2.5/5.0
$120,000
🖨 Deal sheet 📄 Offer letter ✓ Due diligence
Listing remarks MLS
I bedroom cabin with a drive through garage being sold furnished as is
Key facts
- Many hiking trails
- Newer furnace
- Ski areas
Tags
Property features AI
Exterior
- Parking: Detached garage with capacity for 1 car
- Utilities: Private water source; Septic system; Circuit breaker electrical service; High-speed internet available; Telephone at site
- Home design: Ranch style; Existing property; Blue exterior; Metal roof; One-story entry (primary living on main level)
- Construction: Built in 1940; Wood frame construction; Vinyl siding; Metal roof; Unknown survey status
- Exterior features: Country setting; Sloping lot; Wooded; Crushed stone driveway; Public road frontage (approx. 175 ft); Two driveways
Interior
- Kitchen: Kitchen on main level (19 x 11); Range - Gas; Refrigerator; Dishwasher
- Bedrooms: Bedroom on main level (18 x 8)
- Flooring: Carpet; Vinyl
- Bathrooms: 1 full bathroom (11 x 6) on main level
- Heating & cooling: Oil heating; Forced air
- Interior features: 4 total rooms; Basement with exterior walk-up access, partial and unfinished
- Laundry & utility: Washer; Dryer
Neighborhood map
What this means for you Summary
Snapshot
- This is a 1-bed/1.0-bath single-family listed at $120k.
Deal economics
- At list price, monthly cash flow is $456 ($5k/yr) — positive.
- The deal already cash-flows at list — no discount required.
- Meets the 1% rule at list price ($2k rent vs $120k).
- Recommended offer: $106k (12.0% below list) — sets the bar for market timing.
Location & tenants
- Location reads 58/100 on livability (#104 in VT) — a working-class tenant base; expect higher turnover. Strengths: crime A+, housing B+, cost of living B; Watch: schools C-, employment C-, health & safety D.
- Market conditions: 19 active listings in the ZIP; 59 units permitted in Bennington County in 2024 (0 in 5+ unit buildings).
Forward outlook
- In year one you build about $889 of equity ($830 loan paydown + $59 appreciation (0.1% local appreciation)).
- Bennington County population projected at -23% by 2050 — secular population decline; favor cash flow + early exit over multi-decade hold.
- At projected returns (0.1% appreciation + 3.0% rent growth), your $34k cash investment doubles in ~5 years — after that, you're playing with house money.
Negotiation context
- It's been on market 132 days — a 12% lower offer ($106k) is reasonable based on typical stale-listing flexibility.
- 2 sale attempts since 4y ago with the ask held roughly flat each time — persistent listings suggest the price (not the market) is what's stuck; bring a comps-based counter.
- Current owner paid $79k; list at $120k implies a 52% gain — meaningful room to come down on a strong offer.
Risks & watch-outs
- Watch-outs: built in 1940 — expect roof / HVAC / electrical / plumbing capex.
Questions for the listing agent
- It's been on market 132 days. Have you received any prior offers? Is the seller open to a 12% concession, seller financing, or rate buy-down credit?
- Built in 1940 — when were the roof, HVAC, electrical panel, plumbing, and water heater last replaced?
- Why hasn't it sold? Are there any deal-killer items the seller is aware of (foundation, flood, title, zoning, code violations)?
- Is there a deadline driving the sale (1031 exchange, divorce, estate, relocation)? That informs how much negotiation room exists.
- What's the average days-on-market for RENTAL listings here right now (not sales)? A rising rental-DOM trend means longer vacancies and softer asking-rent achievability than the comps imply.
- What's the recent tenant-quality profile in this submarket — average credit score on applications, eviction rate, late-payment / NSF rate, and stable-employment percentage? A property-management company in the area should have these aggregated.
- How much new for-sale + rental construction is in the pipeline within 1–3 miles? Heavy new supply typically softens prices + rents 12–24 months out; constrained supply supports both.
Investment metrics
- 1% rule
- 1.34% ✓
- Cap rate
- 10.85%
- Cash-on-cash
- 16.28%
- DSCR
- 1.72
- GRM
- 6.2
CMA / ARV
No comps found within radius.
Projected returns pro-forma
0.05% appreciation · 3.0% rent growth · sell at horizon
- IRR
- 15.9%
- Equity multiple
- 1.77×
- Total profit
- $25,809
- Equity at exit
- $35,139
- IRR
- 20.4%
- Equity multiple
- 3.26×
- Total profit
- $75,963
- Equity at exit
- $42,475
Cash invested: $33,600 (down + closing). Projections, not guarantees.
Landlord ↔ Tenant lean methodology
- Overall (STATE)
- 41 Moderately Tenant-Leaning
- State Vermont
- 41 Moderately Tenant-Leaning · D+15
- County
- — inherits STATE
- City
- — inherits STATE
ZIP-level market 05262
- Home prices YoY
- 0.0%
- Active inventory
- 19
- Price-to-rent
- 6.2×
Monthly cashflow live
- Estimated rent
- $1,603 medium interval (Pro) →
- Mortgage (P&I)
- −$629
- Tax from tax record
- −$131 /mo · $1,577/yr
- Insurance
- −$50
- HOA
- −$0
- Vacancy / Maint / Mgmt
- −$337
- Net cashflow
- $456
Break-even live
UW: 25.0% down · 7.5% · 30yr · 1.5% tax · 5.0% vac · 8.0% maint · 8.0% mgmt
Financing live
Cash to close
- Down payment
- $30,000
- Closing costs
- $3,600
- Reserves months
- —
- Total cash needed
- —
Loan-product check · same deal, 3 products live
Conventional
25% down · 7.5% · 30yr
- Down + closing
- —
- Monthly P&I
- —
- Monthly cashflow
- —
- DSCR
- —
- Eligible?
- —
Personal DTI + credit; lowest rate.
DSCR
20% down · 8.5% · 30yr
- Down + closing
- —
- Monthly P&I
- —
- Monthly cashflow
- —
- DSCR
- —
- Eligible?
- —
No personal income docs; deal must DSCR.
Hard money
10% down · 12.0% · 12mo
- Down + closing
- —
- Monthly P&I
- —
- Monthly cashflow
- —
- DSCR
- —
- Eligible?
- —
Short-term bridge; refi at stabilization.
Listing history 12 events
-
2026-06-07statusdays on market $120,000 Pending 132 DOM
-
2026-06-04days on market $120,000 Active 131 DOM
-
2026-06-02days on market $120,000 Active 130 DOM
-
2026-06-01days on market $120,000 Active 129 DOM
-
2026-05-31days on market $120,000 Active 128 DOM
-
2026-05-31days on market $120,000 Active 127 DOM
-
2026-01-24$120,000 Active
-
2022-09-06soldstatus $79,000
-
2022-08-31soldstatus $79,000 Closed 70-char remark
Show marketing remark (70 chars)
I bedroom cabin with a drive through garage being sold furnished as is
-
2022-08-11historical Active with Contract 70-char remark
Show marketing remark (70 chars)
I bedroom cabin with a drive through garage being sold furnished as is
-
2022-06-08price $89,000 70-char remark
Show marketing remark (70 chars)
I bedroom cabin with a drive through garage being sold furnished as is
-
2022-04-07$99,000 Active 70-char remark
Show marketing remark (70 chars)
I bedroom cabin with a drive through garage being sold furnished as is
ⓘ Source: listings_history table (triggers on properties + properties_extension) + one-shot
backfill from property_details.listing_events for pre-trigger history.
Tax reassessment forecast VT · Partial reset (capped growth)
- Current annual tax
- $1,577 · $131/mo
- Projected year-2 tax
- $1,928 · $161/mo
- Expected delta
- +$352/yr (+$29/mo · 22.3%)
ⓘ Screening estimate from a state-policy table — verify with the county assessor before closing.
Climate risk First Street
- Flood 1/10 Low FEMA zone X (unshaded) · 0% chance over 30 yrs
- Wildfire 3/10 Moderate
- Heat 2/10 Low 7 d/yr ≥87°F today · 17 d/yr by 30 yrs out
- Wind 3/10 Moderate 5% chance of damaging wind over 30 yrs
- Air quality 2/10 Low 0 unhealthy d/yr today · 1 by 30 yrs out
Nearby sold comps map
Loading sold comps map…
Walkable amenities ~0.75 mi
Loading nearby amenities…
Taxation est. · year 1
- Rental income
- $19,238
- − Mortgage interest
- −$6,722
- − Property taxes
- −$1,577
- − Insurance
- −$600
- − Repairs & maintenance
- −$1,539
- − Management
- −$1,539
- − Depreciation
- −$3,491
- Taxable income
- $3,770
- Est. tax owed @ 24.0%
- −$905
- After-tax cash flow
- $4,565/yr
For passive investors: Depreciation is non-cash, so a rental often shows a tax loss while cash-flowing — sheltering income. Rental losses are passive: they offset passive income freely, and up to $25,000/yr can offset ordinary (W-2) income if you actively participate and your MAGI is under $100k (phasing out to $0 by $150k); unused losses carry forward. On sale, claimed depreciation is recaptured at up to 25%, and gains may owe capital-gains tax (a 1031 exchange can defer both). Figures are a year-1 estimate at your 24.0% rate — not tax advice; consult a CPA.
Schools (NCES district)
No district data.
Livability — Arlington
- Score
- 58/100
- State rank
- #104
- US rank
- #21059
Category grades
Schools grade is shown separately in the Schools card above.
Census & demographics
- Population (ZIP)
- 1,979
Population outlook (Bennington County) Hauer SSP2
- Today (2025)
- 34,407 people
- By 2030
- 32,975 · -4.2%
- By 2040
- 29,711 · -13.6%
- By 2050
- 26,638 · -22.6%
- By 2075
- 21,318 · -38.0%
- By 2100
- 16,086 · -53.2%
Race, ethnicity, and origin ACS 2023
- Neighborhood character
- Predominantly White (95%)
- Race & ethnicity
- White 95% Two or more races 5%
- Common ancestry
- Lithuanian 21% Scottish 2% Iranian 2%
Political lean MEDSL · Bennington
- 2024 margin
- Strong D (+22.5) · D 60.0% · R 37.5% · Other 2.6%
- 2008→2024 swing
- -10.9pp toward R · 2008: 33.4pp · 2024: 22.5pp
- All cycles
- 2024: D+22.5 2020: D+27.3 2016: D+22.1 2012: D+33.3 2008: D+33.4
Not yet ingested
- Civics
- —
Market trends
- HPI YoY
- ▬ 0.05%
- Current HPI
- 344.1934
- Rent YoY
- —
- Metro
- —
- State GDP YoY
- —
- F500 in state
- 0
Price history
+21.2% since first listed6 events — show timeline
- 2026-01-24 Listed $120,000 PrimeMLS
- 2022-09-06 Sold (Public Records) $79,000 Public Records
- 2022-08-31 Sold (MLS) $79,000 PrimeMLS
- 2022-08-11 Contingent — PrimeMLS
- 2022-06-08 Price Changed $89,000 PrimeMLS
- 2022-04-07 Listed $99,000 PrimeMLS
Property tax history
+1.1%/yrLatest (2024): $1,577 · +9.4% YoY. Source: county tax records.
Cash-flow waterfall
monthlySold comps — $/sqft
last 12 mo · ≤1 miLoading sold comps…