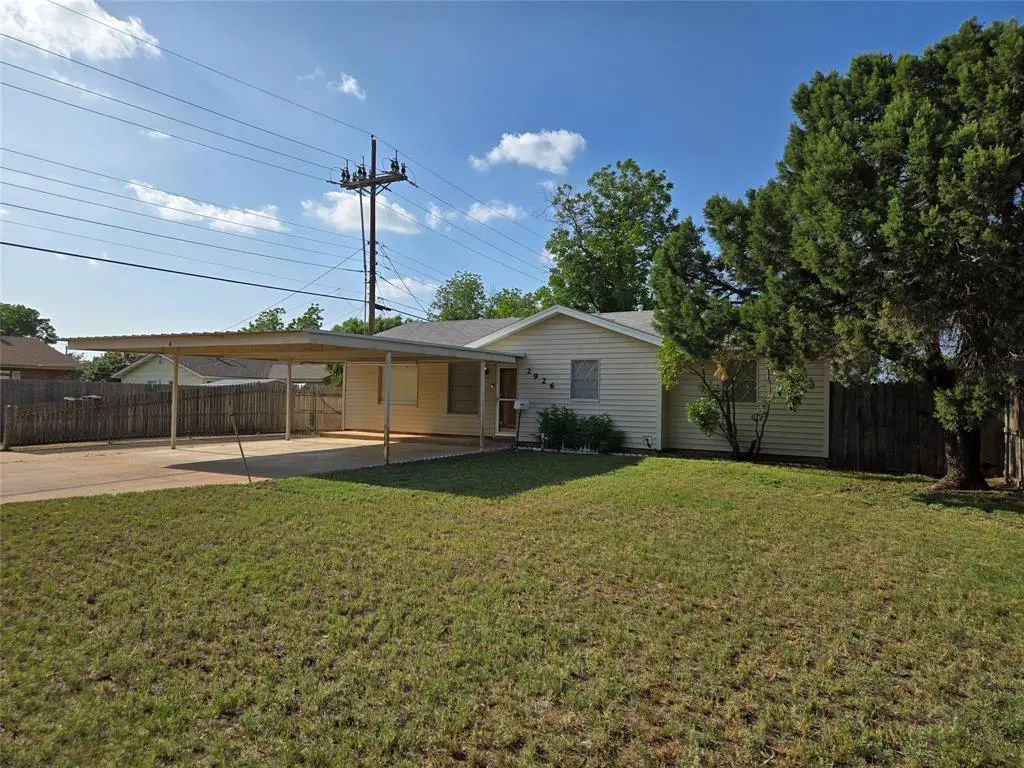
2926 S 23rd St · Abilene, TX
Flood risk 1/10 · Minimal
- FEMA flood zone
- X (unshaded)
- Chance of flooding over 30 yrs
- 0.0%
- Est. flood insurance / yr
- $507 – $1,088
Fire risk 1/10 · Minimal
- Est. fire insurance / yr
- $1,222 – $2,270
Heat risk 7/10 · Major
- Hot days now (above 103°F)
- 7 days/yr
- Hot days in 30 yrs
- 23 days/yr
Wind risk 4/10 · Minor
- Chance of severe wind over 30 yrs
- 11.0%
Air-quality risk 1/10 · Minimal
- Unhealthy air days now
- 0 days/yr
- Unhealthy air days in 30 yrs
- 0 days/yr
Risk factors via First Street. Map © Google.
Why this score? — see what drove the B grade
The composite is a weighted blend of 9 inputs, each scored 0–100. Each bar is that input's sub-score; the figure is the points it added to the 100-point composite (weight × sub-score).
- Cash flow +28.3/30.0
- ARV discount +14.4/15.0
- DSCR +10.0/10.0
- 1% rule +8.0/10.0
- Rent growth +5.0/5.0
- Livability +3.8/5.0
- Schools +2.8/10.0
- Condition / age +2.5/5.0
- Appreciation +0.0/10.0
$189,900
🖨 Deal sheet (PDF) 📄 Offer letter ✓ Due diligence
Listing remarks
South-side 4 bedroom, 1 bath on a corner lot. 1624 sq. ft. per CAD. High efficiency central HVAC replacement in 2025 adding long-term value and lowering utilities. Large glassed in patio great for year-round entertaining, potted plant garden, or crafts. Workshop with electric and metal storage building. Alley accessed double-hung gate to backyard. Heavy gauge 2 car carport. Large primary bedroom or could serve as second living. Mature pecan trees in backyard. Currently all electric but still plumbed for gas. Conveniently located near shopping and major thoroughfares for quicker commute around town. Ideal for first time buyers, handyman, or investors seeking a solid property in a great locat
Key facts
- Mature pecan trees
- Corner lot
- Glassed in patio
Tags
Property features AI
Finance
- Financial info: Listing accepts Cash, Conventional, FHA, VA loan
- HOA & community: No homeowners association
Exterior
- Parking: Attached carport; Covered carport for 2 vehicles
- Utilities: City water; City sewer; Electricity connected; Natural gas available; Overhead utilities; Curbs; Phone available
- Home design: Single family residence; One story; Residential property
- Construction: Built in 1961; Vinyl siding; Composition roof; Slab foundation
- Exterior features: Chain link fencing; Enclosed patio; Front porch; Shed(s); Workshop with electric; Few trees; Interior lot
Interior
- Kitchen: Dishwasher; Electric range
- Bedrooms: 4 bedrooms (primary bedroom on level 1)
- Flooring: Carpet; Vinyl
- Bathrooms: 1 full bathroom
- Heating & cooling: Central heating (electric); Central air; Ceiling fans
- Interior features: Cable TV available; High-speed internet available; Window coverings
Neighborhood map
What this means for you Summary
Snapshot
- This is a 4-bed/1.0-bath single-family listed at $190k.
Deal economics
- At list price, monthly cash flow is $610 ($7k/yr) — positive.
- The deal already cash-flows at list — no discount required.
- Meets the 1% rule at list price ($2k rent vs $190k).
- Recommended offer: $187k (1.5% below list) — sets the bar for market timing.
- Cap rate 10.1% vs local median 6.8% in Abilene — top-decile yield for the area; either an underpriced asset or a hidden risk that comps aren't pricing in. Stress-test before assuming the spread holds.
Location & tenants
- Location reads 75/100 on livability (#142 in TX, #4,037 nationally) — a middle-class / working-renter tenant base. Strengths: cost of living A+, housing A+, health & safety A+; Watch: crime D, commute F.
- Abilene ISD (urban): math 32% / reading 34% proficiency, ranked #575 of 826 in TX (top 70%) — families likely to look elsewhere, expect single-tenant / working-renter base with shorter leases.
- Zoned schools: Alcorta El (math 35% / reading 28%, grade F, #2,396 of 4,322 statewide, top 56%, 451 students, 70% FRL).
- Market conditions: Rents rising fast (+32.1%/yr); 118 active listings in the ZIP; 7 comparable units currently listed for rent nearby; rentals at typical pace (median 23d on market — plan ~3-4 weeks tenant-placement turnaround); 43% of comp listings sitting > 30 days — soft ceiling on asking rent; 508 units permitted in Taylor County in 2024 (0 in 5+ unit buildings).
- At $2,471/mo this rent would consume 47% of the median local household income ($63k/yr) (locally 1096% of renters already pay >50% of income on rent) — very limited rent-growth headroom before tenants either downsize or default.
Forward outlook
- Local home prices are declining (-3.0%/yr); year-one equity from $1k of loan paydown is wiped out by about $6k of value loss. Plan a longer hold.
- Taylor County population projected at +16% by 2050 — long-run rental-demand tailwind backs the buy-and-hold thesis.
- At projected returns (-3.0% appreciation + 8.0% rent growth), your $53k cash investment doubles in ~7 years — after that, you're playing with house money.
Negotiation context
- It's been on market 16 days — a 2% lower offer ($187k) is reasonable based on typical stale-listing flexibility.
Risks & watch-outs
- Climate carrying-cost: extreme-heat days projected 7→23/yr by 2055 (HVAC capex compounding) — expect insurance premiums to compound above CPI over the hold.
Questions for the listing agent
- Built in 1961 — when were the roof, HVAC, electrical panel, plumbing, and water heater last replaced?
- Is there a deadline driving the sale (1031 exchange, divorce, estate, relocation)? That informs how much negotiation room exists.
- Schools are D-rated, which usually means shorter tenancies and higher turnover. Who's the typical renter profile here, and what's been the actual vacancy rate?
- Crime grade is D in this area — have there been break-ins, vandalism, or insurance claims at this property in the last 3 years? What carrier currently insures it and at what premium?
- What's the average days-on-market for RENTAL listings here right now (not sales)? A rising rental-DOM trend means longer vacancies and softer asking-rent achievability than the comps imply.
- What's the recent tenant-quality profile in this submarket — average credit score on applications, eviction rate, late-payment / NSF rate, and stable-employment percentage? A property-management company in the area should have these aggregated.
- How much new for-sale + rental construction is in the pipeline within 1–3 miles? Heavy new supply typically softens prices + rents 12–24 months out; constrained supply supports both.
Investment metrics
- 1% rule
- 1.30% ✓
- Cap rate
- 10.14%
- Cash-on-cash
- 13.76%
- DSCR
- 1.61
- GRM
- 6.4
CMA / ARV
- ARV (on-the-fly)
- $224,112
- Comps found
- 12
Show comp detail 12 sales within ~0.75 mi
| Address | Dist | Beds/Ba | Sqft | Sold | Price | $/sf | Match |
|---|---|---|---|---|---|---|---|
| 2926 S 23rd St | 0.00mi | 4/1.0 | 1,624 (0%) | 0mo | $189,900 | $117 | 100 |
| 3309 S 21st St | 0.41mi | 3/2.0 (-1) | 1,650 (+2%) | 3mo | $249,000 | $151 | 66 |
| 2833 Shepherd St | 0.43mi | 3/2.0 (-1) | 1,704 (+5%) | 0mo | $239,900 | $141 | 62 |
| 2502 Marshall St | 0.19mi | 3/3.0 (-1) | 1,763 (+9%) | 2mo | $269,900 | $153 | 62 |
| 3211 Columbia Dr | 0.29mi | 3/2.0 (-1) | 1,727 (+6%) | 6mo | $225,000 | $130 | 62 |
| 3340 S 21st St | 0.48mi | 3/2.0 (-1) | 1,728 (+6%) | 2mo | $225,000 | $130 | 56 |
| 2318 Glenwood Dr | 0.49mi | 3/2.0 (-1) | 1,752 (+8%) | 0mo | $215,000 | $123 | 55 |
| 2701 S 27th St | 0.34mi | 3/2.0 (-1) | 1,440 (-11%) | 1mo | $165,000 | $115 | 55 |
| 2526 Edgemont Dr | 0.50mi | 3/2.0 (-1) | 1,405 (-14%) | 2mo | $190,000 | $135 | 44 |
| 2026 S 20th St | 0.67mi | 3/2.0 (-1) | 1,448 (-11%) | 1mo | $199,900 | $138 | 41 |
| 1618 Wychwood Dr | 0.67mi | 3/2.0 (-1) | 1,800 (+11%) | 5mo | $270,000 | $150 | 38 |
| 2117 Regent Dr | 0.71mi | 3/2.0 (-1) | 1,859 (+14%) | 1mo | $295,000 | $159 | 33 |
Match score weights: distance 35% · size 25% · config 20% · recency 20%. Top-matched comps best support the ARV.
Projected returns pro-forma
-3.0% appreciation · 8.0% rent growth · sell at horizon
- IRR
- 9.5%
- Equity multiple
- 1.40×
- Total profit
- $21,164
- Equity at exit
- $28,315
- IRR
- 22.6%
- Equity multiple
- 3.41×
- Total profit
- $128,078
- Equity at exit
- $16,419
Cash invested: $53,172 (down + closing). Projections, not guarantees.
Landlord ↔ Tenant lean methodology
- Overall (STATE)
- 87 Strongly Landlord-Friendly
- State Texas
- 87 Strongly Landlord-Friendly · R+5
- County
- — inherits STATE
- City
- — inherits STATE
ZIP-level market 79605
- Rents YoY
- 32.1%
- Active inventory
- 118
- Price-to-rent
- 6.4×
Monthly cashflow live
- Estimated rent
- $2,471 high interval (Pro) →
- Mortgage (P&I)
- −$996
- Tax from tax record
- −$268 /mo · $3,210/yr
- Insurance
- −$79
- HOA
- −$0
- Vacancy / Maint / Mgmt
- −$519
- Net cashflow
- $610
Break-even live
Sensitivity live
| Price | -10% $717 | -5% $663 | +0% $610 | +5% $556 | +10% $502 |
|---|---|---|---|---|---|
| Rent | -10% $414 | -5% $512 | +0% $610 | +5% $707 | +10% $805 |
| Rate | -1.0pp $705 | -0.5pp $658 | base $610 | +0.5pp $560 | +1.0pp $510 |
UW: 25.0% down · 7.5% · 30yr · 1.5% tax · 5.0% vac · 8.0% maint · 8.0% mgmt
Financing live
Cash to close
- Down payment
- $47,475
- Closing costs
- $5,697
- Reserves months
- —
- Total cash needed
- —
Loan-product check · same deal, 3 products live
Conventional
25% down · 7.5% · 30yr
- Down + closing
- —
- Monthly P&I
- —
- Monthly cashflow
- —
- DSCR
- —
- Eligible?
- —
Personal DTI + credit; lowest rate.
DSCR
20% down · 8.5% · 30yr
- Down + closing
- —
- Monthly P&I
- —
- Monthly cashflow
- —
- DSCR
- —
- Eligible?
- —
No personal income docs; deal must DSCR.
Hard money
10% down · 12.0% · 12mo
- Down + closing
- —
- Monthly P&I
- —
- Monthly cashflow
- —
- DSCR
- —
- Eligible?
- —
Short-term bridge; refi at stabilization.
Rent comps 7 comps
| Address | Beds | Baths | Sqft | Rent | $/sqft | DOM | Units | Dist |
|---|---|---|---|---|---|---|---|---|
| 1934 Portland Ave Abilene, TX | 3.0 | 2.0 | 1108 | $1,900 | $1.71 | 45d | 1 | 0.42mi |
| 3173 Hunt St Abilene, TX | 3.0 | 1.5 | 1300 | $2,250 | $1.73 | 45d | 1 | 0.57mi |
| 3409 High Meadows Dr Abilene, TX | 3.0 | 2.0 | 1987 | $2,995 | $1.51 | 23d | 1 | 0.69mi |
| 3533 Grand Ave Abilene, TX | 5.0 | 2.0 | 1629 | $2,200 | $1.35 | 45d | 1 | 0.98mi |
| 2301 Post Oak Rd Abilene, TX | 3.0 | 2.0 | 1915 | $3,295 | $1.72 | 23d | 1 | 1.06mi |
| 1349 Meander St Abilene, TX | 3.0 | 1.0 | 1532 | $3,800 | $2.48 | 15d | 1 | 1.11mi |
| 2701 S 40th St Abilene, TX | 3.0 | 2.0 | 1196 | $1,995 | $1.67 | 23d | 1 | 1.20mi |
Listing history 3 events
-
2026-05-24status Pending
-
2026-05-12historical Active Option Contract
-
2026-05-08$189,900 Active
ⓘ Source: listings_history table (triggers on properties + properties_extension) + one-shot
backfill from property_details.listing_events for pre-trigger history.
Tax reassessment forecast TX · Resets to sale price
- Current annual tax
- $3,210 · $268/mo
- Projected year-2 tax
- $3,475 · $290/mo
- Expected delta
- +$265/yr (+$22/mo · 8.3%)
ⓘ Screening estimate from a state-policy table — verify with the county assessor before closing.
Climate risk First Street
- Flood 1/10 Low FEMA zone X (unshaded) · 0% chance over 30 yrs
- Wildfire 1/10 Low
- Heat 7/10 Severe 7 d/yr ≥103°F today · 23 d/yr by 30 yrs out
- Wind 4/10 Moderate 11% chance of damaging wind over 30 yrs
- Air quality 1/10 Low 0 unhealthy d/yr today · 0 by 30 yrs out
Nearby sold comps map
Loading sold comps map…
Walkable amenities ~0.75 mi
Loading nearby amenities…
Taxation est. · year 1
- Rental income
- $29,651
- − Mortgage interest
- −$10,637
- − Property taxes
- −$3,210
- − Insurance
- −$950
- − Repairs & maintenance
- −$2,372
- − Management
- −$2,372
- − Depreciation
- −$5,524
- Taxable income
- $4,586
- Est. tax owed @ 24.0%
- −$1,101
- After-tax cash flow
- $6,214/yr
For passive investors: Depreciation is non-cash, so a rental often shows a tax loss while cash-flowing — sheltering income. Rental losses are passive: they offset passive income freely, and up to $25,000/yr can offset ordinary (W-2) income if you actively participate and your MAGI is under $100k (phasing out to $0 by $150k); unused losses carry forward. On sale, claimed depreciation is recaptured at up to 25%, and gains may owe capital-gains tax (a 1031 exchange can defer both). Figures are a year-1 estimate at your 24.0% rate — not tax advice; consult a CPA.
Schools (NCES district)
- District
- Abilene ISD
- NCES district ID
- 4807440
- Math proficiency
- 32% ▼ -11.00%
- Reading proficiency
- 34% ▼ -5.00%
- Median HH income
- $39,782
- Composite
- 27.71/100
- National rank
- #6909
- State rank
- #575 of 826 in TX
Livability — Abilene
- Score
- 75/100
- State rank
- #142
- US rank
- #4037
Category grades
Schools grade is shown separately in the Schools card above.
Census & demographics
- Census place
- Abilene, TX
- County
- Taylor County · 136,672 people
- City population
- 136,672
- Metro
- Abilene, TX
- Population (ZIP)
- 28,467
- Household income
- $62,929
- Rent vs Own
- Severe rent burden
- 1096.0
Population outlook (Taylor County) Hauer SSP2
- Today (2025)
- 145,270 people
- By 2030
- 150,050 · +3.3%
- By 2040
- 159,417 · +9.7%
- By 2050
- 168,883 · +16.3%
- By 2075
- 194,436 · +33.8%
- By 2100
- 203,163 · +39.9%
Race, ethnicity, and origin ACS 2023
- Neighborhood character
- Majority White (63%)
- Race & ethnicity
- White 63% Hispanic / Latino 22% Two or more races 12% Black 8% Asian 2%
- Hispanic origin (detail)
- Mexican 19%
- Common ancestry
- Slovak 2% Lithuanian 1% Serbian 1%
- Foreign-born
- 6% · Canada
- Languages at home
- 84% English-only · Spanish 14% German/W. Germanic 1% Other Asian/Pacific 0%
Political lean MEDSL · Taylor
- 2024 margin
- Solid R (+49.8) · D 24.6% · R 74.4% · Other 1.0%
- 2008→2024 swing
- -4.2pp toward R · 2008: -45.6pp · 2024: -49.8pp
- All cycles
- 2024: R+49.8 2020: R+45.3 2016: R+51.1 2012: R+53.6 2008: R+45.6
Not yet ingested
- Civics
- —
Market trends
- HPI YoY
- ▼ -181.75%
- Current HPI
- 201.2341
- Rent YoY
- ▲ 32.08%
- Metro
- Abilene, TX
- State GDP YoY
- ▲ 3.95%
- F500 in state
- 110
Industry mix (Fortune 500 HQ in TX)
| Industry | F500 HQs | Revenue |
|---|---|---|
| Energy | 16 | $1,198B |
|
||
| Technology | 5 | $198B |
|
||
| Engineering / Construction | 4 | $72B |
|
||
| Energy Services | 3 | $60B |
|
||
| Utilities | 3 | $41B |
|
||
| Healthcare | 2 | $330B |
|
||
Price history
3 events — show timeline
- 2026-05-24 Pending — NTREIS
- 2026-05-12 Contingent — NTREIS
- 2026-05-08 Listed $189,900 NTREIS
Property tax history
+5.5%/yrLatest (2025): $3,210 · +7.9% YoY. Source: county tax records.
Cash-flow waterfall
monthlySold comps — $/sqft
last 12 mo · ≤1 miLoading sold comps…