23901 Civic Center Way Unit D238 · Malibu, CA
Flood risk 1/10 · Minimal
- FEMA flood zone
- X (unshaded)
- Chance of flooding over 30 yrs
- 0.0%
- Est. flood insurance / yr
- $507 – $1,088
Fire risk 6/10 · Moderate
- Est. fire insurance / yr
- $659 – $1,223
Heat risk 6/10 · Moderate
- Hot days now (above 83°F)
- 8 days/yr
- Hot days in 30 yrs
- 22 days/yr
Wind risk 1/10 · Minimal
- Chance of severe wind over 30 yrs
- —
Air-quality risk 5/10 · Moderate
- Unhealthy air days now
- 6 days/yr
- Unhealthy air days in 30 yrs
- 8 days/yr
Risk factors via First Street. Map © Google.
Why this score? — see what drove the C- grade
The composite is a weighted blend of 9 inputs, each scored 0–100. Each bar is that input's sub-score; the figure is the points it added to the 100-point composite (weight × sub-score).
- Cash flow +13.0/30.0
- ARV discount +10.2/15.0
- Schools +6.2/10.0
- 1% rule +6.1/10.0
- Appreciation +5.3/10.0
- DSCR +3.9/10.0
- Livability +2.7/5.0
- Condition / age +2.5/5.0
- Rent growth +1.7/5.0
$750,000
🖨 Deal sheet (PDF) 📄 Offer letter ✓ Due diligence
Listing remarks MLS
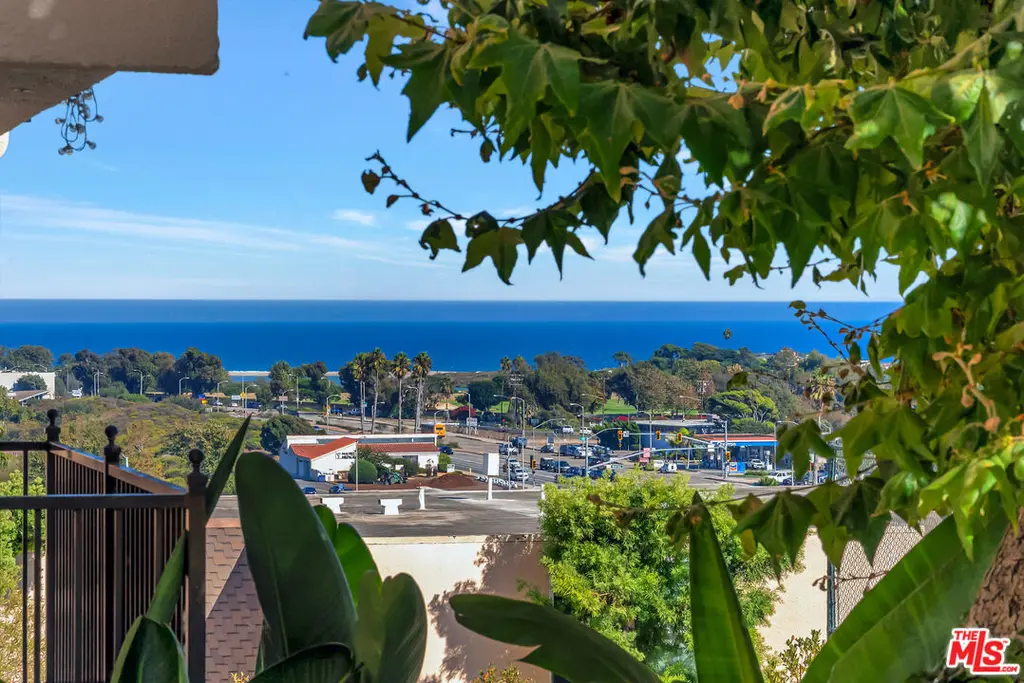
Located in the heart of central Malibu, this desirable single-level condo offers the perfect blend of comfort, convenience, and resort-style living. The thoughtfully designed floor plan features two spacious bedroom suites, a welcoming living room that flows seamlessly into the dining area, and a generous patio where you can relax and take in the ocean views. The gated complex is rich with amenities, including a heated pool with breathtaking ocean and mountain vistas, a fully equipped fitness center, and tennis courts. Two covered parking spaces and 24-hour guard security add to the ease and peace of mind. Ideally situated just moments from Malibu's best restaurants, shopping, markets, and scenic hikes, and only minutes to Pepperdine University. This home is perfect as a full-time residence, weekend getaway, or investment opportunity. Pictures that are furnished are virtually staged.
Key facts
- Gated complex
- Mountain vistas
- Fitness center
Tags
Neighborhood map
What this means for you Summary
Snapshot
- This is a 2-bed/2.0-bath condo listed at $750k.
Deal economics
- At list price, monthly cash flow is $-42 ($-505/yr) — negative.
- To cash-flow at today's rent, offer at most $743k (1.0% below list).
- Meets the 1% rule at list price ($8k rent vs $750k).
- Recommended offer: $660k (12.0% below list) — sets the bar for market timing.
- Cap rate 6.2% vs local median 0.7% in Malibu — top-decile yield for the area; either an underpriced asset or a hidden risk that comps aren't pricing in. Stress-test before assuming the spread holds.
Location & tenants
- Location reads 53/100 on livability (#979 in CA) — a working-class tenant base; expect higher turnover. Strengths: employment A+, schools B; Watch: housing C-, crime F, amenities F.
- Santa Monica-Malibu Unified (urban): math 61% / reading 74% proficiency, ranked #123 of 1,400 in CA (top 9%) — acceptable for families but not a draw, mixed tenant base, ~2y average lease.
- Market conditions: Rents falling (-3.4%/yr); 636 active listings in the ZIP; 7 comparable units currently listed for rent nearby; rentals leasing fast (median 6d on market — plan ~1-2 weeks tenant-placement turnaround); high-income renter base; 19,697 units permitted in Los Angeles County in 2024 (9,426 in 5+ unit buildings).
- At $8,308/mo this rent would consume 51% of the median local household income ($197k/yr) (locally 420% of renters already pay >50% of income on rent) — very limited rent-growth headroom before tenants either downsize or default.
Forward outlook
- In year one you build about $10k of equity ($5k loan paydown + $5k appreciation (0.6% local appreciation)).
- Los Angeles County population projected at +9% by 2050 — modest demand growth; plan on rents tracking national, not racing it.
- By year 5, paydown + projected appreciation supports a ~$48k cash-out refi (75% LTV) — recoverable capital for the next deal without selling this one.
Negotiation context
- It's been on market 142 days — a 12% lower offer ($660k) is reasonable based on typical stale-listing flexibility.
- 3 sale attempts with the ask held roughly flat each time — persistent listings suggest the price (not the market) is what's stuck; bring a comps-based counter.
- Current owner paid $520k; 44% above their basis — modest negotiation headroom, anchor on the comps not their cost.
Risks & watch-outs
- Climate carrying-cost: major wildfire risk; extreme-heat days projected 8→22/yr by 2055 (HVAC capex compounding) — expect insurance premiums to compound above CPI over the hold.
Questions for the listing agent
- What do current leases actually rent for vs. the listed asking? Can we see a recent rent roll and the last 12 months of T-12 income?
- It's been on market 142 days. Have you received any prior offers? Is the seller open to a 12% concession, seller financing, or rate buy-down credit?
- Built in 1972 — when were the roof, HVAC, electrical panel, plumbing, and water heater last replaced?
- What does the HOA fee cover, when was the last increase, and are there any pending special assessments or reserve-fund shortfalls?
- Any open or pending special assessments — roof, HVAC, plumbing, elevator, façade? What's the per-unit balance and payoff schedule, and is the seller paying it off at close or rolling it to the buyer?
- Why hasn't it sold? Are there any deal-killer items the seller is aware of (foundation, flood, title, zoning, code violations)?
- Is there a deadline driving the sale (1031 exchange, divorce, estate, relocation)? That informs how much negotiation room exists.
- Schools are B-rated — typically a magnet for longer-tenancy family renters. What's the average tenant stay here, and is there a school-zone premium baked into asking?
- Crime grade is F in this area — have there been break-ins, vandalism, or insurance claims at this property in the last 3 years? What carrier currently insures it and at what premium?
- What's the average days-on-market for RENTAL listings here right now (not sales)? A rising rental-DOM trend means longer vacancies and softer asking-rent achievability than the comps imply.
- What's the recent tenant-quality profile in this submarket — average credit score on applications, eviction rate, late-payment / NSF rate, and stable-employment percentage? A property-management company in the area should have these aggregated.
- How much new apartment / multifamily construction is in the pipeline within 1–3 miles? Heavy new supply (>2% of stock underway) typically softens rents 12–24 months out; light construction supports rent growth.
Investment metrics
- 1% rule
- 1.11% ✓
- Cap rate
- 6.23%
- Cash-on-cash
- -0.24%
- DSCR
- 0.99
- GRM
- 7.5
CMA / ARV
- ARV (median comp)
- $797,557
- List price
- $750,000
- Delta
- -5.96%
- Verdict
- FAIR
- Comps
- 20 within 1.0 mi
Projected returns pro-forma
0.62% appreciation · 0.0% rent growth · sell at horizon
- IRR
- -2.6%
- Equity multiple
- 0.88×
- Total profit
- $-25,916
- Equity at exit
- $241,236
- IRR
- 0.4%
- Equity multiple
- 1.04×
- Total profit
- $7,931
- Equity at exit
- $309,431
Cash invested: $210,000 (down + closing). Projections, not guarantees.
Landlord ↔ Tenant lean methodology
- Overall (STATE)
- 18 Strongly Tenant-Friendly
- State California
- 18 Strongly Tenant-Friendly · D+13
- County
- — inherits STATE
- City
- — inherits STATE
ZIP-level market 90265
- Home prices YoY
- 0.1%
- Rents YoY
- -3.4%
- Active inventory
- 636
- Price-to-rent
- 7.5×
Monthly cashflow live
- Estimated rent
- $8,308 high interval (Pro) →
- Mortgage (P&I)
- −$3,933
- Tax from tax record
- −$1,059 /mo · $12,708/yr
- Insurance
- −$312
- HOA
- −$1,301
- Vacancy / Maint / Mgmt
- −$1,745
- Net cashflow
- $-42
Break-even live
Sensitivity live
| Price | -10% $382 | -5% $170 | +0% $-42 | +5% $-254 | +10% $-467 |
|---|---|---|---|---|---|
| Rent | -10% $-698 | -5% $-370 | +0% $-42 | +5% $286 | +10% $614 |
| Rate | -1.0pp $336 | -0.5pp $149 | base $-42 | +0.5pp $-236 | +1.0pp $-434 |
UW: 25.0% down · 7.5% · 30yr · 1.5% tax · 5.0% vac · 8.0% maint · 8.0% mgmt
Financing live
Cash to close
- Down payment
- $187,500
- Closing costs
- $22,500
- Reserves months
- —
- Total cash needed
- —
Loan-product check · same deal, 3 products live
Conventional
25% down · 7.5% · 30yr
- Down + closing
- —
- Monthly P&I
- —
- Monthly cashflow
- —
- DSCR
- —
- Eligible?
- —
Personal DTI + credit; lowest rate.
DSCR
20% down · 8.5% · 30yr
- Down + closing
- —
- Monthly P&I
- —
- Monthly cashflow
- —
- DSCR
- —
- Eligible?
- —
No personal income docs; deal must DSCR.
Hard money
10% down · 12.0% · 12mo
- Down + closing
- —
- Monthly P&I
- —
- Monthly cashflow
- —
- DSCR
- —
- Eligible?
- —
Short-term bridge; refi at stabilization.
Rent comps 7 comps
| Address | Beds | Baths | Sqft | Rent | $/sqft | DOM | Units | Dist |
|---|---|---|---|---|---|---|---|---|
| 23901 Civic Center Way Unit D133 Malibu, CA | 2.0 | 2.0 | 895 | $4,550 | $5.08 | 19d | 1 | 0.03mi |
| 23901 Civic Center Way Unit D133 Malibu, CA | 2.0 | 2.0 | 895 | $4,550 | $5.08 | 6d | 1 | 0.03mi |
| 23901 Civic Center Way Unit 126B Malibu, CA | 2.0 | 2.0 | 905 | $5,600 | $6.19 | 0d | 1 | 0.03mi |
| 23901 Civic Center Way Malibu, CA | 2.0–3.0 | 1.5–2.0 | 920 | $4,450 | $4.83 | 18d | 6 | 0.04mi |
| 23901 Civic Center Way Malibu, CA | 2.0–3.0 | 1.0–1.5 | 989 | $4,800 | $4.85 | 2d | 2 | 0.04mi |
| 23901 Civic Center Way Malibu, CA | 2.0–3.0 | 1.0–2.0 | 987 | $4,600 | $4.66 | 0d | 3 | 0.04mi |
| 22860 Pacific Coast Hwy Malibu, CA | 1.0 | 1.0 | 650 | $4,295 | $6.61 | 44d | 1 | 1.28mi |
HOA detail condo
- Monthly dues
- $1,301 · $15,612/yr
- Likely covers
- poolgymsecurity
- Assessments
- None detected in remarks — confirm with the listing agent.
Listing history 23 events
-
2026-06-21days on market $750,000 Active 142 DOM
-
2026-06-18days on market $750,000 Active 139 DOM
-
2026-06-17days on market $750,000 Active 138 DOM
-
2026-06-16days on market $750,000 Active 137 DOM
-
2026-06-15days on market $750,000 Active 136 DOM
-
2026-06-13days on market $750,000 Active 134 DOM
-
2026-06-13days on market $750,000 Active 133 DOM
-
2026-06-09days on market $750,000 Active 130 DOM
-
2026-06-08days on market $750,000 Active 129 DOM
-
2026-06-07days on market $750,000 Active 128 DOM
-
2026-06-04days on market $750,000 Active 125 DOM
-
2026-06-03days on market $750,000 Active 124 DOM
-
2026-06-02days on market $750,000 Active 123 DOM
-
2026-06-01days on market $750,000 Active 122 DOM
-
2026-05-31days on market $750,000 Active 121 DOM
-
2026-05-10historical $4,550
-
2026-01-29$750,000 Active 896-char remark
Show marketing remark (896 chars)
Located in the heart of central Malibu, this desirable single-level condo offers the perfect blend of comfort, convenience, and resort-style living. The thoughtfully designed floor plan features two spacious bedroom suites, a welcoming living room that flows seamlessly into the dining area, and a generous patio where you can relax and take in the ocean views. The gated complex is rich with amenities, including a heated pool with breathtaking ocean and mountain vistas, a fully equipped fitness center, and tennis courts. Two covered parking spaces and 24-hour guard security add to the ease and peace of mind. Ideally situated just moments from Malibu's best restaurants, shopping, markets, and scenic hikes, and only minutes to Pepperdine University. This home is perfect as a full-time residence, weekend getaway, or investment opportunity. Pictures that are furnished are virtually staged.
-
2025-11-13price
-
2025-09-18Active
-
2025-08-10price $4,550
-
2025-05-21$4,950
-
2004-06-29soldstatus $520,000
-
1986-04-29soldstatus $125,000
ⓘ Source: listings_history table (triggers on properties + properties_extension) + one-shot
backfill from property_details.listing_events for pre-trigger history.
Tax reassessment forecast CA · Resets to sale price
- Current annual tax
- $12,708 · $1,059/mo
- Projected year-2 tax
- $12,708 · $1,059/mo
- Expected delta
- $0/yr ($0/mo · 0.0%)
ⓘ Screening estimate from a state-policy table — verify with the county assessor before closing.
Climate risk First Street
- Flood 1/10 Low FEMA zone X (unshaded) · 0% chance over 30 yrs
- Wildfire 6/10 Major
- Heat 6/10 Major 8 d/yr ≥83°F today · 22 d/yr by 30 yrs out
- Wind 1/10 Low
- Air quality 5/10 Major 6 unhealthy d/yr today · 8 by 30 yrs out
Nearby sold comps map
Loading sold comps map…
Walkable amenities ~0.75 mi
Loading nearby amenities…
Taxation est. · year 1
- Rental income
- $99,698
- − Mortgage interest
- −$42,012
- − Property taxes
- −$12,708
- − Insurance
- −$3,750
- − Repairs & maintenance
- −$7,976
- − Management
- −$7,976
- − HOA
- −$15,612
- − Depreciation
- −$21,818
- Taxable loss
- −$12,153
- Est. tax savings @ 24.0%
- +$2,917
- After-tax cash flow
- $2,412/yr
For passive investors: Depreciation is non-cash, so a rental often shows a tax loss while cash-flowing — sheltering income. Rental losses are passive: they offset passive income freely, and up to $25,000/yr can offset ordinary (W-2) income if you actively participate and your MAGI is under $100k (phasing out to $0 by $150k); unused losses carry forward. On sale, claimed depreciation is recaptured at up to 25%, and gains may owe capital-gains tax (a 1031 exchange can defer both). Figures are a year-1 estimate at your 24.0% rate — not tax advice; consult a CPA.
Schools (NCES district)
- District
- Santa Monica-Malibu Unified
- NCES district ID
- 0635700
- Math proficiency
- 61% ▬ 0.00%
- Reading proficiency
- 74% ▬ 0.00%
- Median HH income
- $81,489
- Composite
- 61.58/100
- National rank
- #1535
- State rank
- #123 of 1400 in CA
Livability — Malibu
- Score
- 53/100
- State rank
- #979
- US rank
- #24630
Category grades
Schools grade is shown separately in the Schools card above.
Census & demographics
- Census place
- Malibu, CA
- County
- Los Angeles County · 9,444,647 people
- City population
- 15,918
- Metro
- Los Angeles-Long Beach-Anaheim, CA
- Population (ZIP)
- 15,918
- Household income
- $196,742
- Rent vs Own
- Severe rent burden
- 420.0
Population outlook (Los Angeles County) Hauer SSP2
- Today (2025)
- 10,940,515 people
- By 2030
- 11,256,481 · +2.9%
- By 2040
- 11,729,929 · +7.2%
- By 2050
- 11,948,407 · +9.2%
- By 2075
- 11,818,114 · +8.0%
- By 2100
- 10,842,928 · -0.9%
Race, ethnicity, and origin ACS 2023
- Neighborhood character
- Predominantly White (77%)
- Race & ethnicity
- White 77% Two or more races 10% Hispanic / Latino 9% Asian 5% Black 1%
- Hispanic origin (detail)
- Mexican 6%
- Common ancestry
- Italian 8% Scotch-Irish 3% Romanian 3%
- Foreign-born
- 16% · Canada, South Korea, China
- Languages at home
- 82% English-only · Spanish 6% Other Indo-European 6% French/Haitian/Cajun 2%
Political lean MEDSL · Los Angeles
- 2024 margin
- Solid D (+32.9) · D 64.8% · R 31.9% · Other 3.3%
- 2008→2024 swing
- -7.4pp toward R · 2008: 40.4pp · 2024: 32.9pp
- All cycles
- 2024: D+32.9 2020: D+44.2 2016: D+48.0 2012: D+40.0 2008: D+40.4
Not yet ingested
- Civics
- —
Market trends
- HPI YoY
- ▲ 0.62%
- Current HPI
- 498.5117
- Rent YoY
- ▼ -3.39%
- Metro
- Los Angeles-Long Beach-Anaheim, CA
- State GDP YoY
- ▲ 3.21%
- F500 in state
- 116
Industry mix (Fortune 500 HQ in CA)
| Industry | F500 HQs | Revenue |
|---|---|---|
| Technology | 27 | $1,492B |
|
||
| Financial Services | 3 | $174B |
|
||
| Retail | 3 | $44B |
|
||
| Insurance | 3 | $26B |
|
||
| Media / Entertainment | 2 | $115B |
|
||
| Pharmaceuticals / Biotech | 2 | $62B |
|
||
Price history
-96.4% since first listed8 events — show timeline
- 2026-05-10 Rental Removed $4,550 CLAW
- 2026-01-29 Listed $750,000 TheMLS
- 2025-11-13 Price Changed — TheMLS
- 2025-09-18 Listed — TheMLS
- 2025-08-10 Price Changed $4,550 CLAW
- 2025-05-21 Listed for Rent $4,950 CLAW
- 2004-06-29 Sold (Public Records) $520,000 Public Records
- 1986-04-29 Sold (Public Records) $125,000 Public Records
Property tax history
+1.9%/yrLatest (2025): $12,708 · +12.4% YoY. Source: county tax records.
Cash-flow waterfall
monthlySold comps — $/sqft
last 12 mo · ≤1 miLoading sold comps…