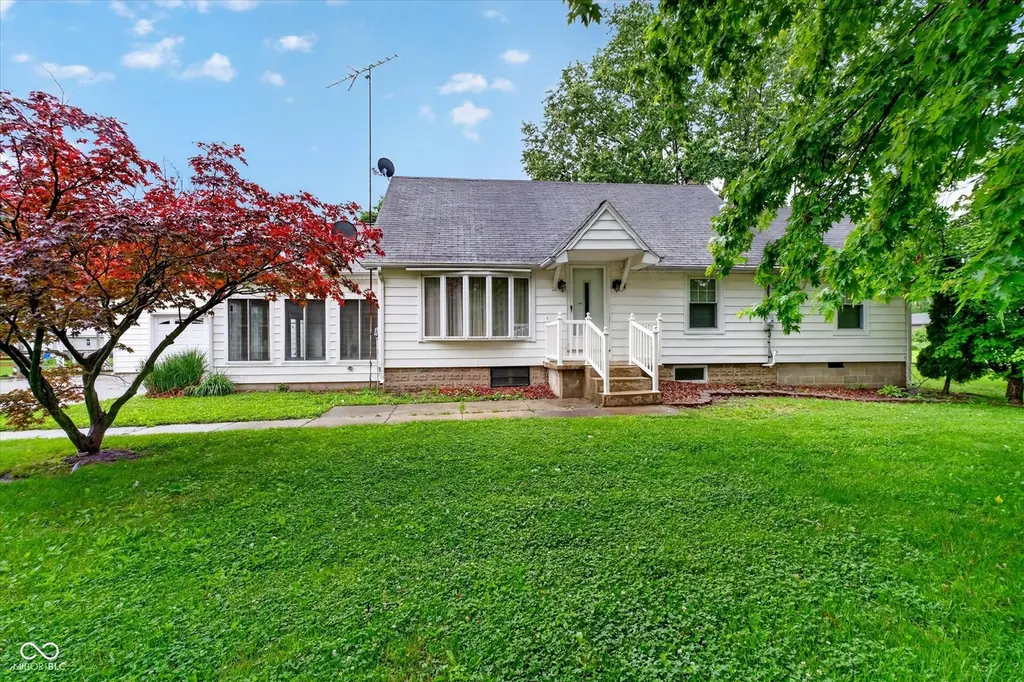
16833 N 150 E · Summitville, IN
Flood risk 1/10 · Minimal
- FEMA flood zone
- X (unshaded)
- Chance of flooding over 30 yrs
- 0.0%
- Est. flood insurance / yr
- $473 – $860
Fire risk 1/10 · Minimal
- Est. fire insurance / yr
- $717 – $1,331
Heat risk 3/10 · Minor
- Hot days now (above 100°F)
- 7 days/yr
- Hot days in 30 yrs
- 18 days/yr
Wind risk 2/10 · Minimal
- Chance of severe wind over 30 yrs
- 1.0%
Air-quality risk 2/10 · Minimal
- Unhealthy air days now
- 1 days/yr
- Unhealthy air days in 30 yrs
- 2 days/yr
Risk factors via First Street. Map © Google.
Why this score? — see what drove the C- grade
The composite is a weighted blend of 9 inputs, each scored 0–100. Each bar is that input's sub-score; the figure is the points it added to the 100-point composite (weight × sub-score).
- ARV discount +15.0/15.0
- Cash flow +10.3/30.0
- Appreciation +10.0/10.0
- Livability +3.3/5.0
- Schools +3.1/10.0
- 1% rule +3.0/10.0
- DSCR +3.0/10.0
- Rent growth +2.5/5.0
- Condition / age +2.5/5.0
$149,900
🖨 Deal sheet (PDF) 📄 Offer letter ✓ Due diligence
Listing remarks
Bring your imagination! This property has a lot of possibilities. Although it needs some TLC the home is solid and built of native timber, offers a large vaulted ceiling sunroom with gas fireplace, family room with wood burning insert, kitchen with oak cabinets and a formal living room with hardwood floors. The primary bedroom has a full bath with shower stall. The utility room is conveniently located on the main level. Plenty of storage in the unfinished basement. Enjoy the attached oversized 2 car garage PLUS a 5 Bay detached garage/workshop! The home sits on . 73 acres and the additional . 89 acre lot next door is included and has an existing well and septic. The home will be sold as is.
Key facts
- Wood burning insert
- Oak cabinets
- Gas fireplace
Tags
Property features AI
Finance
- Other: Property includes additional parcels; Lot approximately 1.65 acres (1–3 acres range)
Exterior
- Parking: Attached and detached concrete garage space(s); 4 garage spaces
- Utilities: Well (private) water; Septic system; Electricity connected; Natural gas connected
- Home design: Single-family residence; One level
- Construction: Aluminum siding; Block foundation; Has basement (partial)
- Exterior features: Barn pole; Rural, not in a subdivision
Interior
- Kitchen: Electric cooktop; Oven; Microwave; Dishwasher; Gas water heater
- Bedrooms: 3 bedrooms (all on main level)
- Flooring: Hardwood floors
- Bathrooms: 2 full bathrooms; Primary bathroom with full shower stall
- Heating & cooling: Forced air heating (natural gas); Central air conditioning
- Interior features: Hardwood floors; Eat-in kitchen; Utility room; Water softener (owned)
- Laundry & utility: Utility room; Sump pump
Neighborhood map
What this means for you Summary
Snapshot
- This is a 3-bed/1.0-bath single-family listed at $150k.
Deal economics
- At list price, monthly cash flow is $-82 ($-981/yr) — negative.
- To cash-flow at today's rent, offer at most $135k (9.6% below list).
- To meet the 1% rule (rent ≥ 1% of price), the offer needs to be $120k (19.9% below list).
- Recommended offer: $120k (19.9% below list) — sets the bar for 1% rule.
Location & tenants
- Location reads 66/100 on livability (#310 in IN) — a middle-class / working-renter tenant base. Strengths: cost of living A+, housing A+; Watch: employment D+, crime D, health & safety D.
- Madison-Grant United School Corporation (rural): math 32% / reading 40% proficiency, ranked #180 of 301 in IN (top 60%) — families likely to look elsewhere, expect single-tenant / working-renter base with shorter leases.
- Zoned schools: Summitville School (240 students, 59% FRL); Virtual Preparatory Academy of Indiana At Madison-Grant 6-8 (158 students, 48% FRL); Madison-Grant Jr./Sr. High School (math 29% / reading 50%, grade F, #221 of 369 statewide, top 63%, 491 students, 47% FRL).
- Market conditions: 12 active listings in the ZIP; 184 units permitted in Madison County in 2024 (0 in 5+ unit buildings).
Forward outlook
- In year one you build about $16k of equity ($1k loan paydown + $15k appreciation (10.0% local appreciation)).
- Madison County population projected at -14% by 2050 — secular population decline; favor cash flow + early exit over multi-decade hold.
- At projected returns (10.0% appreciation + 3.0% rent growth), your $42k cash investment doubles in ~3 years — after that, you're playing with house money.
- By year 3, paydown + projected appreciation supports a ~$41k cash-out refi (75% LTV) — recoverable capital for the next deal without selling this one.
Negotiation context
- Only 9 days on market — expect competitive offers; lowballing is unlikely to land.
Risks & watch-outs
- Watch-outs: built in 1940 — expect roof / HVAC / electrical / plumbing capex.
Questions for the listing agent
- What do current leases actually rent for vs. the listed asking? Can we see a recent rent roll and the last 12 months of T-12 income?
- Built in 1940 — when were the roof, HVAC, electrical panel, plumbing, and water heater last replaced?
- Is there a deadline driving the sale (1031 exchange, divorce, estate, relocation)? That informs how much negotiation room exists.
- Schools are D-rated, which usually means shorter tenancies and higher turnover. Who's the typical renter profile here, and what's been the actual vacancy rate?
- Crime grade is D in this area — have there been break-ins, vandalism, or insurance claims at this property in the last 3 years? What carrier currently insures it and at what premium?
- What's the average days-on-market for RENTAL listings here right now (not sales)? A rising rental-DOM trend means longer vacancies and softer asking-rent achievability than the comps imply.
- What's the recent tenant-quality profile in this submarket — average credit score on applications, eviction rate, late-payment / NSF rate, and stable-employment percentage? A property-management company in the area should have these aggregated.
- How much new for-sale + rental construction is in the pipeline within 1–3 miles? Heavy new supply typically softens prices + rents 12–24 months out; constrained supply supports both.
Investment metrics
- 1% rule
- 0.80% ✗
- Cap rate
- 5.64%
- Cash-on-cash
- -2.34%
- DSCR
- 0.90
- GRM
- 10.4
CMA / ARV
- ARV (on-the-fly)
- $249,744
- Comps found
- 6
Show comp detail 6 sales within ~0.75 mi
| Address | Dist | Beds/Ba | Sqft | Sold | Price | $/sf | Match |
|---|---|---|---|---|---|---|---|
| 1521 E 1700 N | 0.20mi | 3/1.0 | 2,077 (+10%) | 2mo | $274,900 | $132 | 73 |
| 16651 N 150 E | 0.19mi | 2/1.0 (-1) | 1,790 (-5%) | 19mo | $245,000 | $137 | 62 |
| 1780 E 1700 N | 0.40mi | 4/2.0 (+1) | 1,808 (-4%) | 6mo | $100,000 | $55 | 60 |
| 1112 W Walnut St | 0.55mi | 3/2.0 | 1,755 (-7%) | 10mo | $245,000 | $140 | 50 |
| 117 S Howard St | 0.69mi | 3/1.0 | 1,748 (-8%) | 14mo | $125,000 | $72 | 43 |
| 120 S Howard St | 0.71mi | 3/1.0 | 2,012 (+6%) | 22mo | $182,000 | $90 | 38 |
Match score weights: distance 35% · size 25% · config 20% · recency 20%. Top-matched comps best support the ARV.
Projected returns pro-forma
10.0% appreciation · 3.0% rent growth · sell at horizon
- IRR
- 22.6%
- Equity multiple
- 2.82×
- Total profit
- $76,448
- Equity at exit
- $135,042
- IRR
- 20.2%
- Equity multiple
- 6.46×
- Total profit
- $229,250
- Equity at exit
- $291,223
Cash invested: $41,972 (down + closing). Projections, not guarantees.
Landlord ↔ Tenant lean methodology
- Overall (STATE)
- 90 Strongly Landlord-Friendly
- State Indiana
- 90 Strongly Landlord-Friendly · R+11
- County
- — inherits STATE
- City
- — inherits STATE
ZIP-level market 46070
- Home prices YoY
- 12.2%
- Active inventory
- 12
- Price-to-rent
- 10.4×
Monthly cashflow live
- Estimated rent
- $1,201 medium interval (Pro) →
- Mortgage (P&I)
- −$786
- Tax from tax record
- −$182 /mo · $2,187/yr
- Insurance
- −$62
- HOA
- −$0
- Vacancy / Maint / Mgmt
- −$252
- Net cashflow
- $-82
Break-even live
Sensitivity live
| Price | -10% $3 | -5% $-39 | +0% $-82 | +5% $-124 | +10% $-167 |
|---|---|---|---|---|---|
| Rent | -10% $-177 | -5% $-129 | +0% $-82 | +5% $-34 | +10% $13 |
| Rate | -1.0pp $-6 | -0.5pp $-44 | base $-82 | +0.5pp $-121 | +1.0pp $-160 |
UW: 25.0% down · 7.5% · 30yr · 1.5% tax · 5.0% vac · 8.0% maint · 8.0% mgmt
Financing live
Cash to close
- Down payment
- $37,475
- Closing costs
- $4,497
- Reserves months
- —
- Total cash needed
- —
Loan-product check · same deal, 3 products live
Conventional
25% down · 7.5% · 30yr
- Down + closing
- —
- Monthly P&I
- —
- Monthly cashflow
- —
- DSCR
- —
- Eligible?
- —
Personal DTI + credit; lowest rate.
DSCR
20% down · 8.5% · 30yr
- Down + closing
- —
- Monthly P&I
- —
- Monthly cashflow
- —
- DSCR
- —
- Eligible?
- —
No personal income docs; deal must DSCR.
Hard money
10% down · 12.0% · 12mo
- Down + closing
- —
- Monthly P&I
- —
- Monthly cashflow
- —
- DSCR
- —
- Eligible?
- —
Short-term bridge; refi at stabilization.
Listing history 7 events
-
2026-06-07statusdays on market $149,900 Pending 9 DOM
-
2026-06-03price $149,900 Active 5 DOM
-
2026-06-02days on market $165,000 Active 5 DOM
-
2026-06-01days on market $165,000 Active 4 DOM
-
2026-05-31days on market $165,000 Active 3 DOM
-
2026-05-30days on market $165,000 Active 2 DOM
-
2026-05-27$165,000 Active
ⓘ Source: listings_history table (triggers on properties + properties_extension) + one-shot
backfill from property_details.listing_events for pre-trigger history.
Tax reassessment forecast IN · Partial reset (capped growth)
- Current annual tax
- $2,187 · $182/mo
- Projected year-2 tax
- $2,187 · $182/mo
- Expected delta
- $0/yr ($0/mo · 0.0%)
ⓘ Screening estimate from a state-policy table — verify with the county assessor before closing.
Climate risk First Street
- Flood 1/10 Low FEMA zone X (unshaded) · 0% chance over 30 yrs
- Wildfire 1/10 Low
- Heat 3/10 Moderate 7 d/yr ≥100°F today · 18 d/yr by 30 yrs out
- Wind 2/10 Low 100% chance of damaging wind over 30 yrs
- Air quality 2/10 Low 1 unhealthy d/yr today · 2 by 30 yrs out
Nearby sold comps map
Loading sold comps map…
Walkable amenities ~0.75 mi
Loading nearby amenities…
Taxation est. · year 1
- Rental income
- $14,415
- − Mortgage interest
- −$8,397
- − Property taxes
- −$2,187
- − Insurance
- −$750
- − Repairs & maintenance
- −$1,153
- − Management
- −$1,153
- − Depreciation
- −$4,361
- Taxable loss
- −$3,585
- Est. tax savings @ 24.0%
- +$860
- After-tax cash flow
- $-121/yr
For passive investors: Depreciation is non-cash, so a rental often shows a tax loss while cash-flowing — sheltering income. Rental losses are passive: they offset passive income freely, and up to $25,000/yr can offset ordinary (W-2) income if you actively participate and your MAGI is under $100k (phasing out to $0 by $150k); unused losses carry forward. On sale, claimed depreciation is recaptured at up to 25%, and gains may owe capital-gains tax (a 1031 exchange can defer both). Figures are a year-1 estimate at your 24.0% rate — not tax advice; consult a CPA.
Schools (NCES district)
- District
- Madison-Grant United School Corporation
- NCES district ID
- 1806240
- Math proficiency
- 32% ▼ -8.00%
- Reading proficiency
- 40% ▼ -9.00%
- Median HH income
- $47,917
- Composite
- 30.95/100
- National rank
- #6107
- State rank
- #180 of 301 in IN
Livability — Summitville
- Score
- 66/100
- State rank
- #310
- US rank
- #12277
Category grades
Schools grade is shown separately in the Schools card above.
Census & demographics
- Population (ZIP)
- 2,289
Population outlook (Madison County) Hauer SSP2
- Today (2025)
- 125,800 people
- By 2030
- 122,640 · -2.5%
- By 2040
- 115,420 · -8.3%
- By 2050
- 108,148 · -14.0%
- By 2075
- 91,838 · -27.0%
- By 2100
- 75,670 · -39.8%
Race, ethnicity, and origin ACS 2023
- Neighborhood character
- Predominantly White (96%)
- Race & ethnicity
- White 96% Two or more races 3%
- Common ancestry
- Lithuanian 3% Iranian 2% Italian 2%
- Foreign-born
- 0%
Political lean MEDSL · Madison
- 2024 margin
- Strong R (+26.9) · D 35.6% · R 62.5% · Other 1.9%
- 2008→2024 swing
- -33.5pp toward R · 2008: 6.5pp · 2024: -26.9pp
- All cycles
- 2024: R+26.9 2020: R+22.6 2016: R+25.7 2012: R+4.5 2008: D+6.5
Not yet ingested
- Civics
- —
Market trends
- HPI YoY
- ▲ 25.48%
- Current HPI
- 233.4985
- Rent YoY
- —
- Metro
- —
- State GDP YoY
- ▲ 2.90%
- F500 in state
- 18
Industry mix (Fortune 500 HQ in IN)
| Industry | F500 HQs | Revenue |
|---|---|---|
| Industrial Machinery | 2 | $37B |
|
||
| Healthcare | 1 | $177B |
|
||
| Pharmaceuticals | 1 | $45B |
|
||
| Metals / Steel | 1 | $18B |
|
||
| Agriculture | 1 | $17B |
|
||
| Packaging | 1 | $12B |
|
||
Price history
1 event — show timeline
- 2026-05-27 Listed $165,000 MIBOR as Distributed by MLS Grid
Property tax history
+23.7%/yrLatest (2024): $2,187 · +8.6% YoY. Source: county tax records.
Cash-flow waterfall
monthlySold comps — $/sqft
last 12 mo · ≤1 miLoading sold comps…