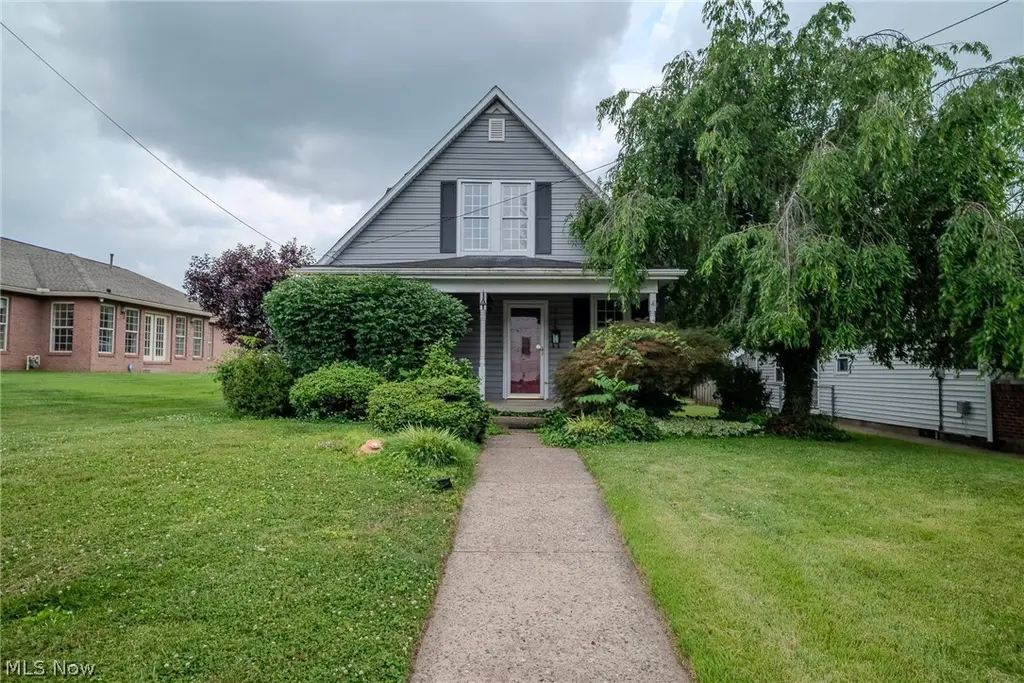
3106 Avery St · Parkersburg, WV
Flood risk 1/10 · Minimal
- FEMA flood zone
- X (unshaded)
- Chance of flooding over 30 yrs
- 0.0%
- Est. flood insurance / yr
- $507 – $1,088
Fire risk 3/10 · Minor
- Est. fire insurance / yr
- $787 – $1,461
Heat risk 5/10 · Moderate
- Hot days now (above 101°F)
- 7 days/yr
- Hot days in 30 yrs
- 18 days/yr
Wind risk 2/10 · Minimal
- Chance of severe wind over 30 yrs
- 1.0%
Air-quality risk 1/10 · Minimal
- Unhealthy air days now
- 0 days/yr
- Unhealthy air days in 30 yrs
- 0 days/yr
Risk factors via First Street. Map © Google.
Why this score? — see what drove the B grade
The composite is a weighted blend of 9 inputs, each scored 0–100. Each bar is that input's sub-score; the figure is the points it added to the 100-point composite (weight × sub-score).
- Cash flow +28.0/30.0
- ARV discount +15.0/15.0
- DSCR +9.9/10.0
- 1% rule +6.9/10.0
- Schools +3.6/10.0
- Livability +3.6/5.0
- Rent growth +2.5/5.0
- Condition / age +2.5/5.0
- Appreciation +0.0/10.0
$99,500
🖨 Deal sheet (PDF) 📄 Offer letter ✓ Due diligence
Listing remarks
Charming 3-bedroom, 1.5-bath home located in a convenient North Parkersburg location! This property offers great curb appeal, a detached garage, and a spacious backyard with plenty of room to enjoy outdoor activities. Inside, you'll find a functional layout with lots of potential to make it your own. The home does need repairs and updating, making it an excellent opportunity for investors, flippers, or buyers looking to build equity. With solid bones, attractive exterior appeal, and desirable features already in place, this property is ready for its next owner to bring their vision to life. Being sold as-is. Schedule your showing today and see the potential this Avery Street property has to
Key facts
- Solid bones
- Spacious backyard
- Functional layout
Tags
Property features AI
Exterior
- Parking: Detached garage; Off-street parking; On-street parking; 2 garage spaces
- Utilities: Public water service; Public sewer service
- Home design: Two-story home; Vinyl siding exterior; Fixer condition
- Construction: Shingle roof; Block foundation; Built (year per public records)
- Exterior features: Public water; Public sewer
Interior
- Bedrooms: One main-level bedroom
- Bathrooms: One full bathroom; One half bathroom; One main-level bathroom
- Heating & cooling: Forced air heating; Central air conditioning
- Interior features: Crawl space basement with dirt floor; Fireplace (1)
Neighborhood map
What this means for you Summary
Snapshot
- This is a 3-bed/1.0-bath single-family listed at $100k.
Deal economics
- At list price, monthly cash flow is $309 ($4k/yr) — positive.
- The deal already cash-flows at list — no discount required.
- Meets the 1% rule at list price ($1k rent vs $100k).
- Cap rate 10.0% vs local median 5.6% in Parkersburg — top-decile yield for the area; either an underpriced asset or a hidden risk that comps aren't pricing in. Stress-test before assuming the spread holds.
Location & tenants
- Location reads 72/100 on livability (#46 in WV) — a middle-class / working-renter tenant base. Strengths: cost of living A+, housing A+, health & safety A+; Watch: crime D+, schools F, commute F.
- Wood County Schools (urban): math 38% / reading 48% proficiency, ranked #3 of 55 in WV (top 6%) — families likely to look elsewhere, expect single-tenant / working-renter base with shorter leases.
- Market conditions: 55 active listings in the ZIP; 124 units permitted in Wood County in 2024 (33 in 5+ unit buildings).
Forward outlook
- Local home prices are declining (-3.0%/yr); year-one equity from $688 of loan paydown is wiped out by about $3k of value loss. Plan a longer hold.
- Wood County population projected at -13% by 2050 — secular population decline; favor cash flow + early exit over multi-decade hold.
- At projected returns (-3.0% appreciation + 3.0% rent growth), your $28k cash investment doubles in ~9 years — after that, you're playing with house money.
Negotiation context
- Only 8 days on market — expect competitive offers; lowballing is unlikely to land.
- 4 sale attempts with the ask held roughly flat each time — persistent listings suggest the price (not the market) is what's stuck; bring a comps-based counter.
- Current owner paid $32k; list at $100k implies a 211% gain — meaningful room to come down on a strong offer.
Risks & watch-outs
- Watch-outs: built in 1925 — expect roof / HVAC / electrical / plumbing capex.
- Climate carrying-cost: extreme-heat days projected 7→18/yr by 2055 (HVAC capex compounding) — expect insurance premiums to compound above CPI over the hold.
Questions for the listing agent
- Built in 1925 — when were the roof, HVAC, electrical panel, plumbing, and water heater last replaced?
- Is there a deadline driving the sale (1031 exchange, divorce, estate, relocation)? That informs how much negotiation room exists.
- Schools are F-rated, which usually means shorter tenancies and higher turnover. Who's the typical renter profile here, and what's been the actual vacancy rate?
- Crime grade is D in this area — have there been break-ins, vandalism, or insurance claims at this property in the last 3 years? What carrier currently insures it and at what premium?
- What's the average days-on-market for RENTAL listings here right now (not sales)? A rising rental-DOM trend means longer vacancies and softer asking-rent achievability than the comps imply.
- What's the recent tenant-quality profile in this submarket — average credit score on applications, eviction rate, late-payment / NSF rate, and stable-employment percentage? A property-management company in the area should have these aggregated.
- How much new for-sale + rental construction is in the pipeline within 1–3 miles? Heavy new supply typically softens prices + rents 12–24 months out; constrained supply supports both.
Investment metrics
- 1% rule
- 1.19% ✓
- Cap rate
- 10.02%
- Cash-on-cash
- 13.30%
- DSCR
- 1.59
- GRM
- 7.0
CMA / ARV
- ARV (on-the-fly)
- $170,856
- Comps found
- 12
Show comp detail 12 sales within ~0.75 mi
| Address | Dist | Beds/Ba | Sqft | Sold | Price | $/sf | Match |
|---|---|---|---|---|---|---|---|
| 920 32nd St | 0.07mi | 3/2.0 | 1,610 (+6%) | 1mo | $189,500 | $118 | 81 |
| 1104 30th St | 0.17mi | 4/1.5 (+1) | 1,546 (+2%) | 10mo | $50,000 | $32 | 74 |
| 1010 West Virginia Ave | 0.15mi | 3/2.0 | 1,624 (+7%) | 7mo | $189,000 | $116 | 71 |
| 3504 Hemlock Ave | 0.29mi | 3/2.0 | 1,408 (-7%) | 1mo | $119,900 | $85 | 70 |
| 911 32nd St | 0.11mi | 3/1.5 | 1,344 (-11%) | 11mo | $153,000 | $114 | 65 |
| 3306 Hemlock Ave | 0.19mi | 3/2.0 | 1,392 (-8%) | 10mo | $165,000 | $119 | 65 |
| 1206 W Virginia Ave | 0.27mi | 3/1.5 | 1,678 (+11%) | 2mo | $149,900 | $89 | 65 |
| 1201 Lakeview Dr | 0.32mi | 3/2.5 | 1,373 (-9%) | 1mo | $155,000 | $113 | 63 |
| 1208 28th St | 0.30mi | 4/2.0 (+1) | 1,680 (+11%) | 2mo | $165,000 | $98 | 57 |
| 952 Lakeview Dr | 0.26mi | 3/2.5 | 1,668 (+10%) | 12mo | $168,000 | $101 | 55 |
| 1055 W Virginia Ave | 0.20mi | 3/2.5 | 1,316 (-13%) | 10mo | $155,000 | $118 | 55 |
| 730 29th St | 0.31mi | 3/1.5 | 1,324 (-12%) | 10mo | $135,000 | $102 | 54 |
Match score weights: distance 35% · size 25% · config 20% · recency 20%. Top-matched comps best support the ARV.
Projected returns pro-forma
-3.0% appreciation · 3.0% rent growth · sell at horizon
- IRR
- 3.3%
- Equity multiple
- 1.13×
- Total profit
- $3,518
- Equity at exit
- $14,836
- IRR
- 12.8%
- Equity multiple
- 2.02×
- Total profit
- $28,299
- Equity at exit
- $8,603
Cash invested: $27,860 (down + closing). Projections, not guarantees.
Landlord ↔ Tenant lean methodology
- Overall (STATE)
- 83 Strongly Landlord-Friendly
- State West Virginia
- 83 Strongly Landlord-Friendly · R+22
- County
- — inherits STATE
- City
- — inherits STATE
ZIP-level market 26104
- Home prices YoY
- -14.8%
- Active inventory
- 55
- Price-to-rent
- 7.0×
Monthly cashflow live
- Estimated rent
- $1,184 medium interval (Pro) →
- Mortgage (P&I)
- −$522
- Tax from tax record
- −$63 /mo · $759/yr
- Insurance
- −$41
- HOA
- −$0
- Vacancy / Maint / Mgmt
- −$249
- Net cashflow
- $309
Break-even live
Sensitivity live
| Price | -10% $365 | -5% $337 | +0% $309 | +5% $281 | +10% $252 |
|---|---|---|---|---|---|
| Rent | -10% $215 | -5% $262 | +0% $309 | +5% $355 | +10% $402 |
| Rate | -1.0pp $359 | -0.5pp $334 | base $309 | +0.5pp $283 | +1.0pp $257 |
UW: 25.0% down · 7.5% · 30yr · 1.5% tax · 5.0% vac · 8.0% maint · 8.0% mgmt
Financing live
Cash to close
- Down payment
- $24,875
- Closing costs
- $2,985
- Reserves months
- —
- Total cash needed
- —
Loan-product check · same deal, 3 products live
Conventional
25% down · 7.5% · 30yr
- Down + closing
- —
- Monthly P&I
- —
- Monthly cashflow
- —
- DSCR
- —
- Eligible?
- —
Personal DTI + credit; lowest rate.
DSCR
20% down · 8.5% · 30yr
- Down + closing
- —
- Monthly P&I
- —
- Monthly cashflow
- —
- DSCR
- —
- Eligible?
- —
No personal income docs; deal must DSCR.
Hard money
10% down · 12.0% · 12mo
- Down + closing
- —
- Monthly P&I
- —
- Monthly cashflow
- —
- DSCR
- —
- Eligible?
- —
Short-term bridge; refi at stabilization.
Listing history 8 events
-
2026-06-19days on market $99,500 Active 8 DOM
-
2026-06-18days on market $99,500 Active 7 DOM
-
2026-06-17days on market $99,500 Active 6 DOM
-
2026-06-16days on market $99,500 Active 5 DOM
-
2026-06-15days on market $99,500 Active 4 DOM
-
2026-06-14days on market $99,500 Active 2 DOM
-
2026-06-12remarks 699-char remark
-
2026-06-12$99,500 Active 1 DOM
ⓘ Source: listings_history table (triggers on properties + properties_extension) + one-shot
backfill from property_details.listing_events for pre-trigger history.
Tax reassessment forecast WV · Resets to sale price
- Current annual tax
- $759 · $63/mo
- Projected year-2 tax
- $759 · $63/mo
- Expected delta
- $0/yr ($0/mo · 0.0%)
ⓘ Screening estimate from a state-policy table — verify with the county assessor before closing.
Climate risk First Street
- Flood 1/10 Low FEMA zone X (unshaded) · 0% chance over 30 yrs
- Wildfire 3/10 Moderate
- Heat 5/10 Major 7 d/yr ≥101°F today · 18 d/yr by 30 yrs out
- Wind 2/10 Low 100% chance of damaging wind over 30 yrs
- Air quality 1/10 Low 0 unhealthy d/yr today · 0 by 30 yrs out
Nearby sold comps map
Loading sold comps map…
Walkable amenities ~0.75 mi
Loading nearby amenities…
Taxation est. · year 1
- Rental income
- $14,205
- − Mortgage interest
- −$5,574
- − Property taxes
- −$759
- − Insurance
- −$498
- − Repairs & maintenance
- −$1,136
- − Management
- −$1,136
- − Depreciation
- −$2,895
- Taxable income
- $2,208
- Est. tax owed @ 24.0%
- −$530
- After-tax cash flow
- $3,174/yr
For passive investors: Depreciation is non-cash, so a rental often shows a tax loss while cash-flowing — sheltering income. Rental losses are passive: they offset passive income freely, and up to $25,000/yr can offset ordinary (W-2) income if you actively participate and your MAGI is under $100k (phasing out to $0 by $150k); unused losses carry forward. On sale, claimed depreciation is recaptured at up to 25%, and gains may owe capital-gains tax (a 1031 exchange can defer both). Figures are a year-1 estimate at your 24.0% rate — not tax advice; consult a CPA.
Schools (NCES district)
- District
- Wood County Schools
- NCES district ID
- 5401620
- Math proficiency
- 38% ▼ -10.00%
- Reading proficiency
- 48% ▼ -4.00%
- Median HH income
- $42,363
- Composite
- 36.22/100
- National rank
- #4728
- State rank
- #3 of 55 in WV
Livability — Parkersburg
- Score
- 72/100
- State rank
- #46
- US rank
- #5841
Category grades
Schools grade is shown separately in the Schools card above.
Census & demographics
- Census place
- Parkersburg, WV
- County
- Wood County · 44,810 people
- City population
- 44,810
- Metro
- Parkersburg-Vienna, WV
- Population (ZIP)
- 16,805
- Household income
- $54,331
- Rent vs Own
- Severe rent burden
- 309.0
Population outlook (Wood County) Hauer SSP2
- Today (2025)
- 84,304 people
- By 2030
- 82,420 · -2.2%
- By 2040
- 78,133 · -7.3%
- By 2050
- 73,639 · -12.7%
- By 2075
- 63,093 · -25.2%
- By 2100
- 50,461 · -40.1%
Race, ethnicity, and origin ACS 2023
- Neighborhood character
- Predominantly White (93%)
- Race & ethnicity
- White 93% Two or more races 3% Hispanic / Latino 1% Black 1%
- Common ancestry
- Slovak 3% Italian 3% Serbian 2%
- Foreign-born
- 1% · Canada
- Languages at home
- 98% English-only · Spanish 1%
Political lean MEDSL · Wood
- 2024 margin
- Solid R (+43.0) · D 27.6% · R 70.7% · Other 1.6%
- 2008→2024 swing
- -14.4pp toward R · 2008: -28.7pp · 2024: -43.0pp
- All cycles
- 2024: R+43.0 2020: R+42.0 2016: R+47.8 2012: R+32.5 2008: R+28.7
Not yet ingested
- Civics
- —
Market trends
- HPI YoY
- ▼ -35.00%
- Current HPI
- 201.3315
- Rent YoY
- —
- Metro
- Parkersburg-Vienna, WV
- State GDP YoY
- —
- F500 in state
- 0
Price history
+210.9% since first listed8 events — show timeline
- 2026-06-11 Listed $99,500 MLSNOW
- 2025-12-31 Listing Removed — MLSNOW
- 2025-12-17 Relisted — MLSNOW
- 2025-11-23 Contingent — MLSNOW
- 2025-10-16 Relisted — MLSNOW
- 2025-09-03 Contingent — MLSNOW
- 2025-08-28 Listed $130,000 MLSNOW
- 2003-12-24 Sold (Public Records) $32,000 Public Records
Property tax history
+1.7%/yrLatest (2025): $759 · +9.1% YoY. Source: county tax records.
Cash-flow waterfall
monthlySold comps — $/sqft
last 12 mo · ≤1 miLoading sold comps…