 8-Plex
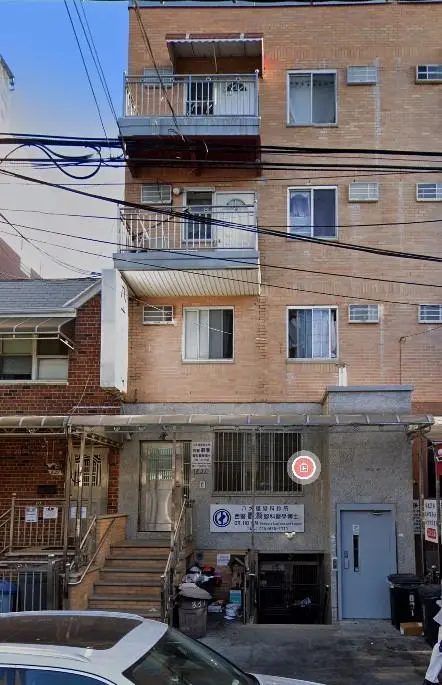
831 56th St · New York, NY
Flood risk No data
- FEMA flood zone
- —
- Chance of flooding over 30 yrs
- —
- Est. flood insurance / yr
- —
Fire risk No data
- Est. fire insurance / yr
- —
Heat risk No data
- Hot days now (above threshold)
- —
- Hot days in 30 yrs
- —
Wind risk No data
- Chance of severe wind over 30 yrs
- —
Air-quality risk No data
- Unhealthy air days now
- —
- Unhealthy air days in 30 yrs
- —
Risk factors via First Street. Map © Google.
Why this score? — see what drove the D grade
The composite is a weighted blend of 9 inputs, each scored 0–100. Each bar is that input's sub-score; the figure is the points it added to the 100-point composite (weight × sub-score).
- Appreciation +7.8/10.0
- ARV discount +7.5/15.0
- Cash flow +6.6/30.0
- Rent growth +5.0/5.0
- Schools +5.0/10.0
- Livability +3.8/5.0
- Condition / age +2.5/5.0
- 1% rule +1.7/10.0
- DSCR +0.8/10.0
$3,999,000
🖨 Deal sheet 📄 Offer letter ✓ Due diligence
Multi-family units
County records classify this as Multi-Family (2-4 Unit). Listing-text estimate: 8 units. estimate disagrees with records
Listing remarks
Location!Location!Location! Rare opportunity to own a 10 years Mix-Use Property in Sunset Park 8th Avenue. Lot: 21x100, Building: 21x56. 2 medical offices with 4 resident units and 1 parking spaces!!! Separated Heat and Hot water. Lot of potentials for this property, easily increase the rent roll from 203K to 300K!!!
Key facts
- Mix-use property
- Resident units
- Parking spaces
Tags
Property features AI
Finance
- Other: Utility expense reported
- Financial info: Rent income reported: $229,632; Some units currently leased; other units on month-to-month tenancy; Financing considered: Exchange, bank mortgage, or cash
Exterior
- Parking: Community drive parking (1 space)
- Utilities: 220V electric; Gas service; Hot water via boiler coil; Baseboard heat delivery
- Home design: Mixed-use property; Attached building
- Construction: Brick construction; Poured concrete foundation; Roof: Other (see remarks)
- Exterior features: Back yard; Brick exterior
Interior
- Bedrooms: Unit 1: 4 bedrooms; Unit 2: 4 bedrooms; Unit 3: 5 bedrooms; Unit 4: 5 bedrooms; Unit 5: 2 bedrooms; Unit 6: 4 bedrooms
- Bathrooms: Unit 1: 1 full bath; Unit 2: 1 full bath; Unit 3: 2 full baths; Unit 4: 2 full baths; Unit 5: 1 full bath; Unit 6: 2 full baths
- Heating & cooling: Gas heating with baseboard distribution; Hot water coil in boiler for hot water; 220V electric service
- Interior features: Finished basement; No interior floor coverings specified
Neighborhood map
What this means for you Summary
Snapshot
- This is a 8 × 3-bed/1.1-bath units multifamily listed at $4.00M.
Deal economics
- At list price, monthly cash flow is $-7k ($-79k/yr) — negative. Per door: $-826/mo.
- To cash-flow at today's rent, offer at most $3.04M (23.9% below list).
- To meet the 1% rule (rent ≥ 1% of price), the offer needs to be $2.66M (33.4% below list).
- Recommended offer: $2.66M (33.4% below list) — sets the bar for 1% rule.
- Cap rate 4.3% vs local median 2.6% in New York — top-decile yield for the area; either an underpriced asset or a hidden risk that comps aren't pricing in. Stress-test before assuming the spread holds.
Location & tenants
- Location reads 75/100 on livability (#268 in NY, #4,188 nationally) — a middle-class / working-renter tenant base. Strengths: amenities A+, commute A+, health & safety A; Watch: crime F, cost of living F.
- Market conditions: Rents rising fast (+11.0%/yr); 271 active listings in the ZIP; 10,063 units permitted in Kings County in 2024 (9,789 in 5+ unit buildings).
- At $26,620/mo this rent would consume 457% of the median local household income ($70k/yr) (locally 6563% of renters already pay >50% of income on rent) — very limited rent-growth headroom before tenants either downsize or default.
Forward outlook
- In year one you build about $253k of equity ($28k loan paydown + $225k appreciation (5.6% local appreciation)).
- Kings County population projected at +13% by 2050 — modest demand growth; plan on rents tracking national, not racing it.
- By year 2, paydown + projected appreciation supports a ~$405k cash-out refi (75% LTV) — recoverable capital for the next deal without selling this one.
Negotiation context
- It's been on market 487 days — a 12% lower offer ($3.52M) is reasonable based on typical stale-listing flexibility.
Questions for the listing agent
- What do current leases actually rent for vs. the listed asking? Can we see a recent rent roll and the last 12 months of T-12 income?
- It's been on market 487 days. Have you received any prior offers? Is the seller open to a 33% concession, seller financing, or rate buy-down credit?
- Can we see the unit-by-unit rent roll, current vacancy, and any below-market leases? What's the average tenancy length?
- What capital expenditures (roof, boiler, parking lot, exteriors) have been made in the last 5 years, and what's planned in the next 2?
- Why hasn't it sold? Are there any deal-killer items the seller is aware of (foundation, flood, title, zoning, code violations)?
- Is there a deadline driving the sale (1031 exchange, divorce, estate, relocation)? That informs how much negotiation room exists.
- Schools are B-rated — typically a magnet for longer-tenancy family renters. What's the average tenant stay here, and is there a school-zone premium baked into asking?
- Crime grade is F in this area — have there been break-ins, vandalism, or insurance claims at this property in the last 3 years? What carrier currently insures it and at what premium?
- The area grade is low — what's the realistic commute time and amenity access for the typical tenant pool here? Any planned neighborhood developments (good or bad) we should know about?
- What's the average days-on-market for RENTAL listings here right now (not sales)? A rising rental-DOM trend means longer vacancies and softer asking-rent achievability than the comps imply.
- What's the recent tenant-quality profile in this submarket — average credit score on applications, eviction rate, late-payment / NSF rate, and stable-employment percentage? A property-management company in the area should have these aggregated.
- How much new apartment / multifamily construction is in the pipeline within 1–3 miles? Heavy new supply (>2% of stock underway) typically softens rents 12–24 months out; light construction supports rent growth.
Investment metrics
- 1% rule
- 0.67% ✗
- Cap rate
- 4.31%
- Cash-on-cash
- -7.08%
- DSCR
- 0.68
- GRM
- 12.5
CMA / ARV
No comps found within radius.
Projected returns pro-forma
5.63% appreciation · 8.0% rent growth · sell at horizon
- IRR
- 10.4%
- Equity multiple
- 1.70×
- Total profit
- $788,309
- Equity at exit
- $2,421,797
- IRR
- 13.2%
- Equity multiple
- 3.70×
- Total profit
- $3,022,835
- Equity at exit
- $4,314,406
Cash invested: $1,119,720 (down + closing). Projections, not guarantees.
Landlord ↔ Tenant lean methodology
- Overall (CITY)
- 0 Strongly Tenant-Friendly
- State New York
- 15 Strongly Tenant-Friendly · D+10
- County
- — inherits STATE
- City New York
- 0 Strongly Tenant-Friendly · D+34
ZIP-level market 11220
- Home prices YoY
- 2.5%
- Rents YoY
- 11.0%
- Active inventory
- 271
- Price-to-rent
- 100.2×
Monthly cashflow live
- Estimated rent
- $26,620 high interval (Pro) →
- Mortgage (P&I)
- −$20,971
- Tax est. 1.5%
- −$4,999 /mo · $59,985/yr
- Insurance
- −$1,666
- HOA
- −$0
- Vacancy / Maint / Mgmt
- −$5,590
- Net cashflow
- $-6,606
Break-even live
8-unit breakdown (identical units grouped — click to expand)
| Units | Beds | Baths | Est. rent |
|---|---|---|---|
| 8× units | 3 | 1.1 | $26,616 |
| #1 | 3 | 1.1 | $3,327 |
| #2 | 3 | 1.1 | $3,327 |
| #3 | 3 | 1.1 | $3,327 |
| #4 | 3 | 1.1 | $3,327 |
| #5 | 3 | 1.1 | $3,327 |
| #6 | 3 | 1.1 | $3,327 |
| #7 | 3 | 1.1 | $3,327 |
| #8 | 3 | 1.1 | $3,327 |
| Total (8 units) | $26,620 | ||
UW: 25.0% down · 7.5% · 30yr · 1.5% tax · 5.0% vac · 8.0% maint · 8.0% mgmt
Financing live
Cash to close
- Down payment
- $999,750
- Closing costs
- $119,970
- Reserves months
- —
- Total cash needed
- —
Loan-product check · same deal, 3 products live
Conventional
25% down · 7.5% · 30yr
- Down + closing
- —
- Monthly P&I
- —
- Monthly cashflow
- —
- DSCR
- —
- Eligible?
- —
Personal DTI + credit; lowest rate.
DSCR
20% down · 8.5% · 30yr
- Down + closing
- —
- Monthly P&I
- —
- Monthly cashflow
- —
- DSCR
- —
- Eligible?
- —
No personal income docs; deal must DSCR.
Hard money
10% down · 12.0% · 12mo
- Down + closing
- —
- Monthly P&I
- —
- Monthly cashflow
- —
- DSCR
- —
- Eligible?
- —
Short-term bridge; refi at stabilization.
Listing history 16 events
-
2026-06-18days on market $3,999,000 Active 487 DOM
-
2026-06-17days on market $3,999,000 Active 486 DOM
-
2026-06-15days on market $3,999,000 Active 484 DOM
-
2026-06-13days on market $3,999,000 Active 482 DOM
-
2026-06-10days on market $3,999,000 Active 478 DOM
-
2026-06-08days on market $3,999,000 Active 477 DOM
-
2026-06-03days on market $3,999,000 Active 472 DOM
-
2026-06-01days on market $3,999,000 Active 470 DOM
-
2026-05-31days on market $3,999,000 Active 469 DOM
-
2025-02-16$3,999,000 Active
-
2024-10-24price $3,990,000
-
2024-05-08price $4,100,000
-
2023-04-22price $3,700,000
-
2023-04-14price $3,800,000
-
2022-04-26price $3,900,000
-
2021-11-18price $3,998,000
ⓘ Source: listings_history table (triggers on properties + properties_extension) + one-shot
backfill from property_details.listing_events for pre-trigger history.
Nearby sold comps map
Loading sold comps map…
Walkable amenities ~0.75 mi
Loading nearby amenities…
Taxation est. · year 1
- Rental income
- $319,440
- − Mortgage interest
- −$224,006
- − Property taxes
- −$59,985
- − Insurance
- −$19,995
- − Repairs & maintenance
- −$25,555
- − Management
- −$25,555
- − Depreciation
- −$116,335
- Taxable loss
- −$151,991
- Est. tax savings @ 24.0%
- +$36,478
- After-tax cash flow
- $-42,799/yr
For passive investors: Depreciation is non-cash, so a rental often shows a tax loss while cash-flowing — sheltering income. Rental losses are passive: they offset passive income freely, and up to $25,000/yr can offset ordinary (W-2) income if you actively participate and your MAGI is under $100k (phasing out to $0 by $150k); unused losses carry forward. On sale, claimed depreciation is recaptured at up to 25%, and gains may owe capital-gains tax (a 1031 exchange can defer both). Figures are a year-1 estimate at your 24.0% rate — not tax advice; consult a CPA.
Schools (NCES district)
No district data.
Livability — New York
- Score
- 75/100
- State rank
- #268
- US rank
- #4188
Category grades
Schools grade is shown separately in the Schools card above.
Census & demographics
- Census place
- New York, NY
- County
- Kings County · 2,614,986 people
- City population
- 7,731,280
- Metro
- New York-Newark-Jersey City, NY-NJ-PA
- Population (ZIP)
- 90,652
- Household income
- $69,883
- Rent vs Own
- Severe rent burden
- 6563.0
Population outlook (Kings County) Hauer SSP2
- Today (2025)
- 2,847,441 people
- By 2030
- 2,937,006 · +3.1%
- By 2040
- 3,095,491 · +8.7%
- By 2050
- 3,228,968 · +13.4%
- By 2075
- 3,321,723 · +16.7%
- By 2100
- 3,111,387 · +9.3%
Race, ethnicity, and origin ACS 2023
- Neighborhood character
- Diverse neighborhood (Simpson 0.65)
- Race & ethnicity
- Asian 40% Hispanic / Latino 40% White 16% Two or more races 7% Black 2% Native American 2%
- Hispanic origin (detail)
- Mexican 17% Puerto Rican 8% Dominican 5%
- Common ancestry
- Romanian 1% Scotch-Irish 1% Subsaharan African 1%
- Foreign-born
- 52% · China, Canada, Jamaica
- Languages at home
- 20% English-only · Spanish 35% Chinese 35% Arabic 3%
Political lean MEDSL · Kings
- 2024 margin
- Solid D (+44.0) · D 72.0% · R 28.0%
- 2008→2024 swing
- -15.5pp toward R · 2008: 59.4pp · 2024: 44.0pp
- All cycles
- 2024: D+44.0 2020: D+54.8 2016: D+61.8 2012: D+63.9 2008: D+59.4
Not yet ingested
- Civics
- —
Market trends
- HPI YoY
- ▲ 5.63%
- Current HPI
- 226.624
- Rent YoY
- ▲ 11.02%
- Metro
- New York-Newark-Jersey City, NY-NJ-PA
- State GDP YoY
- ▲ 2.60%
- F500 in state
- 92
Industry mix (Fortune 500 HQ in NY)
| Industry | F500 HQs | Revenue |
|---|---|---|
| Financial Services | 10 | $950B |
|
||
| Consumer Goods | 9 | $162B |
|
||
| Insurance | 4 | $225B |
|
||
| Telecommunications | 2 | $144B |
|
||
| Pharmaceuticals | 2 | $112B |
|
||
| Media / Entertainment | 2 | $69B |
|
||
Price history
+0.0% since first listed7 events — show timeline
- 2025-02-16 Listed $3,999,000 BNYMLS
- 2024-10-24 Price Changed $3,990,000 BNYMLS
- 2024-05-08 Price Changed $4,100,000 BNYMLS
- 2023-04-22 Price Changed $3,700,000 BNYMLS
- 2023-04-14 Price Changed $3,800,000 BNYMLS
- 2022-04-26 Price Changed $3,900,000 BNYMLS
- 2021-11-18 Price Changed $3,998,000 BNYMLS
Cash-flow waterfall
monthlySold comps — $/sqft
last 12 mo · ≤1 miLoading sold comps…