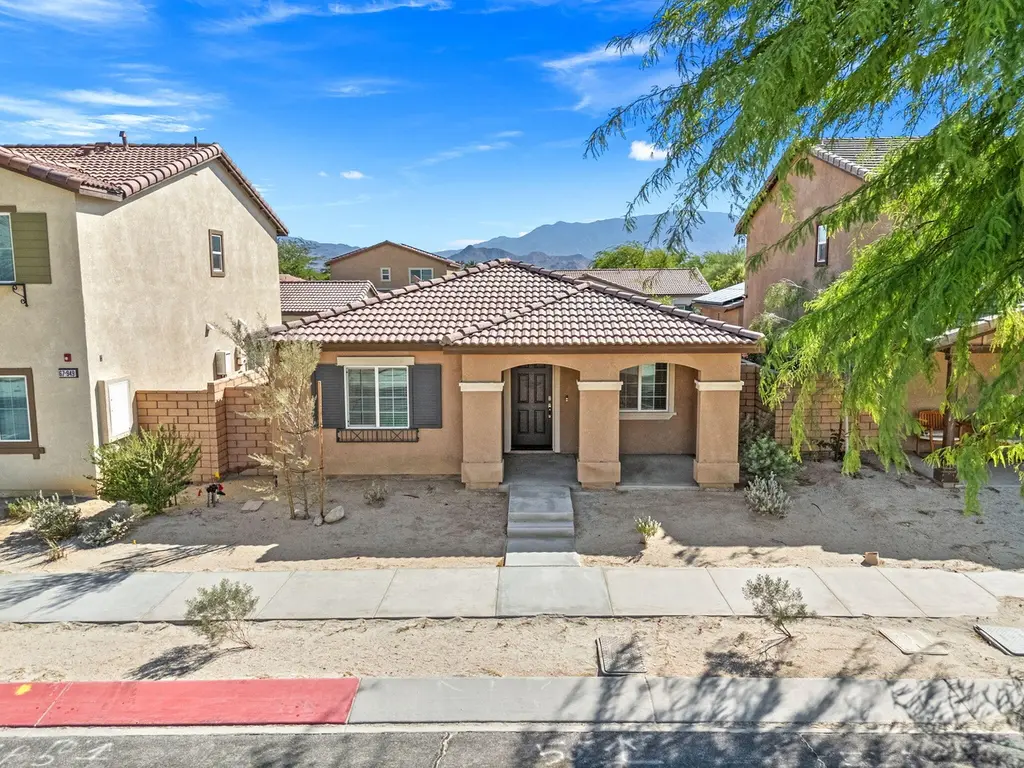
67937 Rio Pecos Dr · Cathedral City, CA
Flood risk 2/10 · Minimal
- FEMA flood zone
- A
- Chance of flooding over 30 yrs
- 0.07%
- Est. flood insurance / yr
- $1,009 – $1,996
Fire risk 2/10 · Minimal
- Est. fire insurance / yr
- $659 – $1,223
Heat risk 9/10 · Severe
- Hot days now (above 112°F)
- 7 days/yr
- Hot days in 30 yrs
- 21 days/yr
Wind risk 1/10 · Minimal
- Chance of severe wind over 30 yrs
- —
Air-quality risk 5/10 · Moderate
- Unhealthy air days now
- 8 days/yr
- Unhealthy air days in 30 yrs
- 11 days/yr
Risk factors via First Street. Map © Google.
Why this score? — see what drove the D grade
The composite is a weighted blend of 9 inputs, each scored 0–100. Each bar is that input's sub-score; the figure is the points it added to the 100-point composite (weight × sub-score).
- Cash flow +11.6/30.0
- ARV discount +10.8/15.0
- 1% rule +3.9/10.0
- DSCR +3.4/10.0
- Rent growth +3.3/5.0
- Livability +3.3/5.0
- Schools +2.7/10.0
- Condition / age +2.5/5.0
- Appreciation +0.0/10.0
$399,000
🖨 Deal sheet (PDF) 📄 Offer letter ✓ Due diligence
Listing remarks
A refined and well-composed residence built in 2022, offering three bedrooms and two baths with a thoughtful, contemporary design. Energy-conscious features include leased solar, a tankless water heater, and integrated smart home devices. The interior balances comfort and style with luxury vinyl flooring throughout the main living areas, complemented by carpeting in the bedrooms. High ceilings and an abundance of windows create a light-filled environment, enhancing the home's open feel. The kitchen offers a charming peek-a-boo mountain view, while the neutral color palette provides a clean foundation ready for personalization. The primary suite is privately situated apart from the secondary
Key facts
- Walk-in closet
- Spacious rear patio
- 1,307 sq ft lot
Tags
Property features AI
Finance
- Other: Short-term rentals not allowed; Will not consider lease; Disclosures include CC&R and HOA documents; Refrigerator and washer/dryer excluded from sale
- Financial info: Sale terms: Cash or cash to new loan; Property is sold as-is
- HOA & community: Monthly HOA fee of $210; HOA provides grounds maintenance, paddle tennis, playground, picnic area, and management
Exterior
- Parking: Detached 2-car garage (side-by-side) with garage door opener; Total of 2 parking spaces
- Security: Closed-circuit camera system; Leased security system; Alarm and cameras included in sale
- Utilities: Sewer: connected and paid; PUD: No
- Home design: Single-family detached home; One story; One-level layout; Mountain and peek-a-boo views
- Construction: Assessor-provided year built; Detached construction
- Exterior features: Closed-circuit cameras; Leased security system; Automatic sprinklers; Drip irrigation system; Sprinkler timer; Community pool with heated, fenced in-ground pool and safety gate; Community heated in-ground spa/hot tub
Interior
- Bedrooms: Entry; Great Room
- Flooring: Carpet; Vinyl
- Bathrooms: 1 full bathroom; 1 three-quarter bathroom
- Heating & cooling: Central heating; Central air conditioning
- Interior features: Unfurnished; No fireplace
Neighborhood map
What this means for you Summary
Snapshot
- This is a 2-bed/2.0-bath single-family listed at $399k.
Deal economics
- At list price, monthly cash flow is $-247 ($-3k/yr) — negative.
- To cash-flow at today's rent, offer at most $355k (10.9% below list).
- To meet the 1% rule (rent ≥ 1% of price), the offer needs to be $354k (11.2% below list).
- Recommended offer: $354k (11.2% below list) — sets the bar for 1% rule.
Location & tenants
- Location reads 66/100 on livability (#344 in CA) — a middle-class / working-renter tenant base. Strengths: commute A+, housing B+; Watch: employment D+, amenities D-, cost of living F.
- Palm Springs Unified (suburban): math 21% / reading 42% proficiency, ranked #328 of 517 in CA (top 63%) — families likely to look elsewhere, expect single-tenant / working-renter base with shorter leases; 73% free/reduced lunch — lower-income household profile, screen leases tightly.
- Zoned schools: Rio Vista Elementary (690 students, 96% FRL); James Workman Middle (1,028 students, 99% FRL); Cathedral City High (math 25% / reading 61%, grade F, #460 of 1,170 statewide, top 40%, 1,395 students, 98% FRL) — zoned schools average 98% FRL vs 73% district-wide (25 pts higher); higher-poverty schools than district average — tighter screening recommended.
- Market conditions: Rents rising (+3.2%/yr); 533 active listings in the ZIP; 40 comparable units currently listed for rent nearby; rentals lingering (median 46d on market — plan ~5-8 weeks vacancy on turnover, expect pricing pressure); 70% of comp listings sitting > 30 days — soft ceiling on asking rent; 9,195 units permitted in Riverside County in 2024 (1,512 in 5+ unit buildings).
- At $3,543/mo this rent would consume 58% of the median local household income ($74k/yr) (locally 1682% of renters already pay >50% of income on rent) — very limited rent-growth headroom before tenants either downsize or default.
Forward outlook
- Local home prices are declining (-3.0%/yr); year-one equity from $3k of loan paydown is wiped out by about $12k of value loss. Plan a longer hold.
- Riverside County population projected at +22% by 2050 — long-run rental-demand tailwind backs the buy-and-hold thesis.
Negotiation context
- It's been on market 33 days — a 3% lower offer ($387k) is reasonable based on typical stale-listing flexibility.
Risks & watch-outs
- Watch-outs: flood insurance adds $125/mo.
- Climate carrying-cost: in FEMA flood zone A (mandatory federal flood insurance); extreme-heat days projected 7→21/yr by 2055 (HVAC capex compounding) — expect insurance premiums to compound above CPI over the hold.
Questions for the listing agent
- What do current leases actually rent for vs. the listed asking? Can we see a recent rent roll and the last 12 months of T-12 income?
- It's been on market 33 days. Have you received any prior offers? Is the seller open to a 11% concession, seller financing, or rate buy-down credit?
- What's the actual annual flood-insurance premium (NFIP or private), and is the property in a SFHA with mandatory coverage?
- What does the HOA fee cover, when was the last increase, and are there any pending special assessments or reserve-fund shortfalls?
- Is there a deadline driving the sale (1031 exchange, divorce, estate, relocation)? That informs how much negotiation room exists.
- Schools are F-rated, which usually means shorter tenancies and higher turnover. Who's the typical renter profile here, and what's been the actual vacancy rate?
- The area grade is low — what's the realistic commute time and amenity access for the typical tenant pool here? Any planned neighborhood developments (good or bad) we should know about?
- What's the average days-on-market for RENTAL listings here right now (not sales)? A rising rental-DOM trend means longer vacancies and softer asking-rent achievability than the comps imply.
- What's the recent tenant-quality profile in this submarket — average credit score on applications, eviction rate, late-payment / NSF rate, and stable-employment percentage? A property-management company in the area should have these aggregated.
- How much new for-sale + rental construction is in the pipeline within 1–3 miles? Heavy new supply typically softens prices + rents 12–24 months out; constrained supply supports both.
Investment metrics
- 1% rule
- 0.89% ✗
- Cap rate
- 5.93%
- Cash-on-cash
- -1.31%
- DSCR
- 0.94
- GRM
- 9.4
CMA / ARV
- ARV (on-the-fly)
- $430,155
- Comps found
- 12
Show comp detail 12 sales within ~0.75 mi
| Address | Dist | Beds/Ba | Sqft | Sold | Price | $/sf | Match |
|---|---|---|---|---|---|---|---|
| 67937 Rio Pecos Dr | 0.00mi | 3/2.0 (+1) | 1,185 (0%) | 1mo | $375,000 | $316 | 94 |
| 67364 Rio Plata Rd | 0.60mi | 3/2.0 (+1) | 1,185 (0%) | 2mo | $420,000 | $354 | 65 |
| 67439 Rio Plata Rd | 0.52mi | 3/2.0 (+1) | 1,185 (0%) | 10mo | $430,000 | $363 | 62 |
| 67419 Rio Oso Rd | 0.53mi | 3/2.0 (+1) | 1,185 (0%) | 15mo | $450,000 | $380 | 58 |
| 67710 Medano Rd | 0.45mi | 3/2.0 (+1) | 1,149 (-3%) | 20mo | $518,000 | $451 | 52 |
| 67700 Ontina Rd | 0.33mi | 3/2.0 (+1) | 1,336 (+13%) | 10mo | $440,000 | $329 | 50 |
| 67905 Medano Rd | 0.43mi | 3/2.0 (+1) | 1,339 (+13%) | 8mo | $455,000 | $340 | 47 |
| 67820 Garbino Rd | 0.31mi | 2/2.0 | 1,007 (-15%) | 20mo | $351,000 | $349 | 44 |
| 67795 Medano Rd | 0.44mi | 3/2.0 (+1) | 1,355 (+14%) | 8mo | $575,000 | $424 | 44 |
| 67750 Vista Chino | 0.71mi | 2/2.0 | 1,126 (-5%) | 19mo | $388,000 | $345 | 43 |
| 27420 Avenida Quintana | 0.57mi | 3/2.0 (+1) | 1,315 (+11%) | 11mo | $499,000 | $379 | 41 |
| 67470 Quijo Rd | 0.62mi | 3/2.0 (+1) | 1,339 (+13%) | 10mo | $515,000 | $385 | 36 |
Match score weights: distance 35% · size 25% · config 20% · recency 20%. Top-matched comps best support the ARV.
Projected returns pro-forma
-3.0% appreciation · 3.22% rent growth · sell at horizon
- IRR
- -20.4%
- Equity multiple
- 0.29×
- Total profit
- $-79,371
- Equity at exit
- $59,492
- IRR
- -12.8%
- Equity multiple
- 0.24×
- Total profit
- $-85,197
- Equity at exit
- $34,498
Cash invested: $111,720 (down + closing). Projections, not guarantees.
Landlord ↔ Tenant lean methodology
- Overall (STATE)
- 18 Strongly Tenant-Friendly
- State California
- 18 Strongly Tenant-Friendly · D+13
- County
- — inherits STATE
- City
- — inherits STATE
ZIP-level market 92234
- Home prices YoY
- -27.7%
- Rents YoY
- 3.2%
- Active inventory
- 533
- Price-to-rent
- 9.4×
Monthly cashflow live
- Estimated rent
- $3,543 high interval (Pro) →
- Mortgage (P&I)
- −$2,092
- Tax from tax record
- −$452 /mo · $5,422/yr
- Insurance
- −$166
- Flood insurance flood zone
- −$125 /mo · $1,502/yr
- HOA
- −$210
- Lot rent
- −$0
- Vacancy / Maint / Mgmt
- −$744
- Net cashflow
- $-247
Break-even live
Sensitivity live
| Price | -10% $-21 | -5% $-134 | +0% $-247 | +5% $-360 | +10% $-473 |
|---|---|---|---|---|---|
| Rent | -10% $-527 | -5% $-387 | +0% $-247 | +5% $-107 | +10% $33 |
| Rate | -1.0pp $-46 | -0.5pp $-146 | base $-247 | +0.5pp $-350 | +1.0pp $-456 |
UW: 25.0% down · 7.5% · 30yr · 1.5% tax · 5.0% vac · 8.0% maint · 8.0% mgmt
Financing live
Cash to close
- Down payment
- $99,750
- Closing costs
- $11,970
- Reserves months
- —
- Total cash needed
- —
Loan-product check · same deal, 3 products live
Conventional
25% down · 7.5% · 30yr
- Down + closing
- —
- Monthly P&I
- —
- Monthly cashflow
- —
- DSCR
- —
- Eligible?
- —
Personal DTI + credit; lowest rate.
DSCR
20% down · 8.5% · 30yr
- Down + closing
- —
- Monthly P&I
- —
- Monthly cashflow
- —
- DSCR
- —
- Eligible?
- —
No personal income docs; deal must DSCR.
Hard money
10% down · 12.0% · 12mo
- Down + closing
- —
- Monthly P&I
- —
- Monthly cashflow
- —
- DSCR
- —
- Eligible?
- —
Short-term bridge; refi at stabilization.
Rent comps 40 comps
| Address | Beds | Baths | Sqft | Rent | $/sqft | DOM | Units | Dist |
|---|---|---|---|---|---|---|---|---|
| 67765 Ovante Rd Cathedral City, CA | 3.0 | 2.0 | 1446 | $2,699 | $1.87 | 16d | 1 | 0.56mi |
| 67821 N Portales Dr Unit 251 Cathedral City, CA | 2.0 | 2.0 | 1177 | $4,000 | $3.40 | 27d | 1 | 0.75mi |
| 67821 N Portales Dr Cathedral City, CA | 2.0 | 2.0 | 1177 | $4,000 | $3.40 | 46d | 1 | 0.75mi |
| 67847 N Portales Dr Unit 288 Cathedral City, CA | 2.0 | 2.0 | 1212 | $4,200 | $3.47 | 46d | 1 | 0.75mi |
| 67553 N Portales Dr Cathedral City, CA | 2.0 | 2.0 | 1212 | $4,200 | $3.47 | 46d | 1 | 0.83mi |
| 67553 N Portales Dr Unit 288 Cathedral City, CA | 2.0 | 2.0 | 1212 | $4,200 | $3.47 | 27d | 1 | 0.83mi |
| 28260 Landau Blvd Unit B Cathedral City, CA | 3.0 | 2.0 | 1354 | $2,475 | $1.83 | 1d | 1 | 0.85mi |
| 67444 Toltec Ct Cathedral City, CA | 2.0 | 2.0 | 1212 | $3,000 | $2.48 | 5d | 1 | 0.95mi |
| 67463 Toltec Ct Cathedral City, CA | 1.0 | 2.0 | 851 | $3,500 | $4.11 | 46d | 1 | 0.96mi |
| 67552 N Natoma Dr Cathedral City, CA | 2.0 | 2.0 | 1177 | $4,200 | $3.57 | 46d | 1 | 0.96mi |
| 67263 N Chimayo Dr Cathedral City, CA | 2.0 | 2.0 | 1177 | $4,200 | $3.57 | 17d | 1 | 0.99mi |
| 28464 Taos Ct Cathedral City, CA | 2.0 | 2.0 | 1212 | $2,100 | $1.73 | 26d | 1 | 1.00mi |
| 67328 Cumbres Ct Unit 702 Cathedral City, CA | 1.0 | 2.0 | 851 | $3,400 | $4.00 | 46d | 1 | 1.00mi |
| 67320 Cumbres Ct Cathedral City, CA | 2.0 | 2.0 | 1212 | $4,200 | $3.47 | 46d | 1 | 1.00mi |
| 28477 Taos Ct Cathedral City, CA | 2.0 | 2.0 | 1212 | $4,000 | $3.30 | 46d | 1 | 1.02mi |
| 67242 Cumbres Ct Cathedral City, CA | 3.0 | 2.0 | 1285 | $4,500 | $3.50 | 27d | 1 | 1.03mi |
| 28763 E Portales Dr Cathedral City, CA | 2.0 | 2.0 | 984 | $4,200 | $4.27 | 10d | 1 | 1.03mi |
| 67261 Cumbres Ct Cathedral City, CA | 2.0 | 2.0 | 984 | $4,000 | $4.07 | 46d | 1 | 1.05mi |
| 28602 Taos Ct Cathedral City, CA | 2.0 | 2.0 | 1212 | $4,000 | $3.30 | 46d | 1 | 1.08mi |
| 28827 Isleta Ct Cathedral City, CA | 3.0 | 2.0 | 1285 | $4,500 | $3.50 | 46d | 1 | 1.09mi |
| 28868 Isleta Ct Unit 702 Cathedral City, CA | 2.0 | 2.0 | 1285 | $4,900 | $3.81 | 27d | 1 | 1.12mi |
| 28868 Isleta Ct Cathedral City, CA | 2.0 | 2.0 | 1285 | $4,900 | $3.81 | 46d | 1 | 1.12mi |
| 28656 Taos Ct Cathedral City, CA | 2.0 | 2.0 | 1177 | $2,200 | $1.87 | 46d | 1 | 1.12mi |
| 67232 S Chimayo Dr Cathedral City, CA | 3.0 | 2.0 | 1285 | $4,500 | $3.50 | 46d | 1 | 1.13mi |
| 67240 S Chimayo Dr Unit 702 Cathedral City, CA | 1.0 | 2.0 | 851 | $2,200 | $2.59 | 46d | 1 | 1.14mi |
| 67330 W Chimayo Dr Cathedral City, CA | 2.0 | 2.0 | 1177 | $3,300 | $2.80 | 46d | 1 | 1.15mi |
| 28914 Desert Princess Dr Unit 702 Palm Springs, CA | 2.0 | 2.0 | 1212 | $4,200 | $3.47 | 27d | 1 | 1.16mi |
| 68325 Peladora Rd Cathedral City, CA | 3.0 | 2.0 | 1320 | $3,199 | $2.42 | 16d | 1 | 1.17mi |
| 28764 Taos Ct Cathedral City, CA | 2.0 | 2.0 | 1177 | $4,400 | $3.74 | 46d | 1 | 1.17mi |
| 28964 Desert Princess Dr Cathedral City, CA | 2.0 | 2.0 | 1177 | $2,700 | $2.29 | 46d | 1 | 1.18mi |
| 28984 Desert Princess Dr Unit 702 Cathedral City, CA | 1.0 | 2.0 | 851 | $3,400 | $4.00 | 46d | 1 | 1.20mi |
| 29199 E Portales Dr Unit 702 Cathedral City, CA | 2.0 | 2.0 | 1177 | $4,200 | $3.57 | 46d | 1 | 1.20mi |
| 28859 Desert Princess Dr Cathedral City, CA | 3.0 | 2.0 | 1285 | $3,700 | $2.88 | 46d | 1 | 1.21mi |
| 29118 Desert Princess Dr Unit 702 Cathedral City, CA | 2.0 | 2.0 | 1212 | $4,200 | $3.47 | 46d | 1 | 1.24mi |
| 67665 Lagos Way Cathedral City, CA | 3.0 | 2.0 | 1285 | $4,500 | $3.50 | 46d | 1 | 1.27mi |
| 28920 W Natoma Dr Cathedral City, CA | 2.0 | 2.0 | 1177 | $4,000 | $3.40 | 46d | 1 | 1.27mi |
| 67595 Lagos Way Cathedral City, CA | 3.0 | 3.0 | 1285 | $3,500 | $2.72 | 46d | 1 | 1.30mi |
| 29017 W Natoma Dr Cathedral City, CA | 2.0 | 2.0 | 1177 | $2,395 | $2.03 | 46d | 1 | 1.33mi |
| 28455 Avenida La Vis Unit B Cathedral City, CA | 2.0 | 2.0 | 1100 | $1,995 | $1.81 | 46d | 1 | 1.38mi |
| 29170 W Laguna Dr Cathedral City, CA | 2.0 | 3.0 | 1425 | $6,000 | $4.21 | 46d | 1 | 1.38mi |
HOA detail
- Monthly dues
- $210 · $2,520/yr
- Likely covers
- water
Listing history 3 events
-
2026-05-13status Pending
-
2026-04-18historical Active Under Contract
-
2026-04-10$399,000 Active
ⓘ Source: listings_history table (triggers on properties + properties_extension) + one-shot
backfill from property_details.listing_events for pre-trigger history.
Tax reassessment forecast CA · Resets to sale price
- Current annual tax
- $5,422 · $452/mo
- Projected year-2 tax
- $5,422 · $452/mo
- Expected delta
- $0/yr ($0/mo · 0.0%)
ⓘ Screening estimate from a state-policy table — verify with the county assessor before closing.
Climate risk First Street
- Flood 2/10 Low FEMA zone A · 7% chance over 30 yrs
- Wildfire 2/10 Low
- Heat 9/10 Extreme 7 d/yr ≥112°F today · 21 d/yr by 30 yrs out
- Wind 1/10 Low
- Air quality 5/10 Major 8 unhealthy d/yr today · 11 by 30 yrs out
Nearby sold comps map
Loading sold comps map…
Walkable amenities ~0.75 mi
Loading nearby amenities…
Taxation est. · year 1
- Rental income
- $42,511
- − Mortgage interest
- −$22,350
- − Property taxes
- −$5,422
- − Insurance
- −$3,498
- − Repairs & maintenance
- −$3,401
- − Management
- −$3,401
- − HOA
- −$2,520
- − Depreciation
- −$11,607
- Taxable loss
- −$9,687
- Est. tax savings @ 24.0%
- +$2,325
- After-tax cash flow
- $-639/yr
For passive investors: Depreciation is non-cash, so a rental often shows a tax loss while cash-flowing — sheltering income. Rental losses are passive: they offset passive income freely, and up to $25,000/yr can offset ordinary (W-2) income if you actively participate and your MAGI is under $100k (phasing out to $0 by $150k); unused losses carry forward. On sale, claimed depreciation is recaptured at up to 25%, and gains may owe capital-gains tax (a 1031 exchange can defer both). Figures are a year-1 estimate at your 24.0% rate — not tax advice; consult a CPA.
Schools (NCES district)
- District
- Palm Springs Unified
- NCES district ID
- 0629550
- Math proficiency
- 21% ▼ -7.00%
- Reading proficiency
- 42% ▬ 0.00%
- Median HH income
- $43,638
- Composite
- 26.76/100
- National rank
- #7131
- State rank
- #328 of 517 in CA
Livability — Cathedral City
- Score
- 66/100
- State rank
- #344
- US rank
- #11749
Category grades
Schools grade is shown separately in the Schools card above.
Census & demographics
- Census place
- Cathedral City, CA
- County
- Riverside County · 2,287,001 people
- City population
- 52,267
- Metro
- Riverside-San Bernardino-Ontario, CA
- Population (ZIP)
- 52,267
- Household income
- $73,572
- Rent vs Own
- Severe rent burden
- 1682.0
Population outlook (Riverside County) Hauer SSP2
- Today (2025)
- 2,664,475 people
- By 2030
- 2,802,692 · +5.2%
- By 2040
- 3,050,904 · +14.5%
- By 2050
- 3,256,783 · +22.2%
- By 2075
- 3,655,058 · +37.2%
- By 2100
- 3,766,594 · +41.4%
Race, ethnicity, and origin ACS 2023
- Neighborhood character
- Diverse neighborhood (Simpson 0.56)
- Race & ethnicity
- Hispanic / Latino 59% White 30% Two or more races 27% Asian 6% Native American 2% Black 2%
- Hispanic origin (detail)
- Mexican 51%
- Common ancestry
- Lithuanian 2% Romanian 1% Italian 1%
- Foreign-born
- 28% · Canada, Vietnam
- Languages at home
- 48% English-only · Spanish 46% Tagalog/Filipino 3% Other Asian/Pacific 1%
Political lean MEDSL · Riverside
- 2024 margin
- Toss-up / Even · D 48.0% · R 49.3% · Other 2.6%
- 2008→2024 swing
- -3.6pp toward R · 2008: 2.3pp · 2024: -1.3pp
- All cycles
- 2024: R+1.3 2020: D+8.0 2016: D+4.3 2012: R+0.4 2008: D+2.3
Not yet ingested
- Civics
- —
Market trends
- HPI YoY
- ▼ -136.57%
- Current HPI
- 356.9845
- Rent YoY
- ▲ 3.22%
- Metro
- Riverside-San Bernardino-Ontario, CA
- State GDP YoY
- ▲ 3.21%
- F500 in state
- 116
Industry mix (Fortune 500 HQ in CA)
| Industry | F500 HQs | Revenue |
|---|---|---|
| Technology | 27 | $1,492B |
|
||
| Financial Services | 3 | $174B |
|
||
| Retail | 3 | $44B |
|
||
| Insurance | 3 | $26B |
|
||
| Media / Entertainment | 2 | $115B |
|
||
| Pharmaceuticals / Biotech | 2 | $62B |
|
||
Price history
3 events — show timeline
- 2026-05-13 Pending — GPSMLS
- 2026-04-18 Contingent — GPSMLS
- 2026-04-10 Listed $399,000 GPSMLS
Property tax history
+158.7%/yrLatest (2025): $5,422 · -11.7% YoY. Source: county tax records.
Cash-flow waterfall
monthlySold comps — $/sqft
last 12 mo · ≤1 miLoading sold comps…