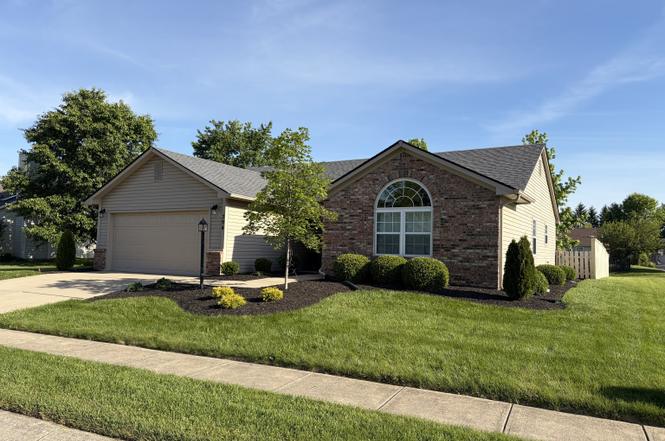
394 E Quail Wood Ln · Westfield, IN
Flood risk 1/10 · Minimal
- FEMA flood zone
- X (unshaded)
- Chance of flooding over 30 yrs
- 0.0%
- Est. flood insurance / yr
- $507 – $1,088
Fire risk 1/10 · Minimal
- Est. fire insurance / yr
- $717 – $1,331
Heat risk 3/10 · Minor
- Hot days now (above 101°F)
- 7 days/yr
- Hot days in 30 yrs
- 18 days/yr
Wind risk 2/10 · Minimal
- Chance of severe wind over 30 yrs
- 0.0%
Air-quality risk 4/10 · Minor
- Unhealthy air days now
- 3 days/yr
- Unhealthy air days in 30 yrs
- 6 days/yr
Risk factors via First Street. Map © Google.
Why this score? — see what drove the D- grade
The composite is a weighted blend of 9 inputs, each scored 0–100. Each bar is that input's sub-score; the figure is the points it added to the 100-point composite (weight × sub-score).
- Cash flow +10.8/30.0
- Schools +5.5/10.0
- ARV discount +5.0/15.0
- Rent growth +3.6/5.0
- Livability +3.6/5.0
- DSCR +3.1/10.0
- 1% rule +2.5/10.0
- Condition / age +2.5/5.0
- Appreciation +0.0/10.0
$349,900
🖨 Deal sheet 📄 Offer letter ✓ Due diligence
Listing remarks MLS
Don't miss this amazing opportunity to own this three bedroom ranch in Westfield-Washington School System! This home offers lots of curb appeal w/tidy landscaping, beautiful brick & a charming arched window, adding a custom touch. Home features a bright, eat-in kitchen w/pantry space, lots of extra cabinet & counter space & overlooks the spacious great room w/tall cathedral ceilings. You'll love the split bedroom floor plan which allows for a more private master bedroom suite. All three bedrooms include walk-in closets, providing lots of extra storage. Nestled on a corner lot with an extra large backyard, home is conveniently located minutes from great schools, shopping and dining. All kitchen appliances included! Must see today!
Key facts
- Nearby grand park
- Large yard
- Updated kitchen
Tags
Property features AI
Finance
- HOA & community: Homeowners association with annual fee (maintenance and management provided); Association fee: $215 annually (includes entrance common, maintenance, management)
Exterior
- Parking: Attached garage with automatic door opener; Two-car garage
- Utilities: Public water; Municipal sewer connected; Electricity connected
- Home design: Single-family residence; One story
- Construction: Vinyl with brick exterior; Slab foundation
- Exterior features: Patio; Approximately 0.31 acre lot (about 1/4–1/2 acre)
Interior
- Kitchen: Eat-in kitchen; Electric oven; Microhood (microwave with hood); Dishwasher; Garbage disposal; Refrigerator
- Bedrooms: Three bedrooms on the main level; Primary bedroom with walk-in closet
- Bathrooms: Two full bathrooms on the main level; Primary bathroom with double sinks and tub/shower
- Heating & cooling: Electric heating; Central air conditioning
- Interior features: Attic with pull-down stairs; Cathedral ceilings; Eat-in kitchen; Pantry; Walk-in closet(s)
- Laundry & utility: Main-level laundry room; Washer included; Dryer included; Electric water heater; Water softener (owned)
Neighborhood map
What this means for you Summary
Snapshot
- This is a 3-bed/2.0-bath single-family listed at $350k.
Deal economics
- At list price, monthly cash flow is $-158 ($-2k/yr) — negative.
- To cash-flow at today's rent, offer at most $322k (8.0% below list).
- To meet the 1% rule (rent ≥ 1% of price), the offer needs to be $262k (25.0% below list).
- Recommended offer: $262k (25.0% below list) — sets the bar for 1% rule.
- Cap rate 5.7% vs local median 3.0% in Westfield — top-decile yield for the area; either an underpriced asset or a hidden risk that comps aren't pricing in. Stress-test before assuming the spread holds.
Location & tenants
- Location reads 71/100 on livability (#140 in IN) — a middle-class / working-renter tenant base. Strengths: crime A+, employment A+, housing A+; Watch: amenities F, commute F, health & safety F.
- Westfield-Washington Schools (suburban): math 58% / reading 64% proficiency, ranked #10 of 301 in IN (top 3%) — acceptable for families but not a draw, mixed tenant base, ~2y average lease; only 14% free/reduced lunch — higher-income household profile.
- Zoned schools: Oak Trace Elementary School (math 84% / reading 77%, grade A+, #6 of 994 statewide, top 0%, 586 students, 9% FRL); Westfield High School (math 61% / reading 85%, grade B+, #8 of 369 statewide, top 2%, 2,665 students, 18% FRL) — zoned schools at 14% FRL track the district average.
- Zoned-school proficiency averages 77% at this address vs 61% district-wide (+16 pts) — the actual schools serving this property are materially stronger than the Westfield-Washington Schools average implies; a family-tenant draw the district grade alone would hide.
- Market conditions: Rents rising fast (+4.3%/yr); 801 active listings in the ZIP; 22 comparable units currently listed for rent nearby; rentals leasing fast (median 8d on market — plan ~1-2 weeks tenant-placement turnaround); high-income renter base; 4,661 units permitted in Hamilton County in 2024 (1,528 in 5+ unit buildings).
Forward outlook
- Local home prices are declining (-3.0%/yr); year-one equity from $2k of loan paydown is wiped out by about $10k of value loss. Plan a longer hold.
- Hamilton County population projected at +44% by 2050 — long-run rental-demand tailwind backs the buy-and-hold thesis.
Negotiation context
- Only 7 days on market — expect competitive offers; lowballing is unlikely to land.
- 6 sale attempts since 20y ago with the ask held roughly flat each time — persistent listings suggest the price (not the market) is what's stuck; bring a comps-based counter.
- Current owner paid $168k; list at $350k implies a 108% gain — meaningful room to come down on a strong offer.
Questions for the listing agent
- What do current leases actually rent for vs. the listed asking? Can we see a recent rent roll and the last 12 months of T-12 income?
- What does the HOA fee cover, when was the last increase, and are there any pending special assessments or reserve-fund shortfalls?
- Is there a deadline driving the sale (1031 exchange, divorce, estate, relocation)? That informs how much negotiation room exists.
- Schools are A-rated — typically a magnet for longer-tenancy family renters. What's the average tenant stay here, and is there a school-zone premium baked into asking?
- The area grade is low — what's the realistic commute time and amenity access for the typical tenant pool here? Any planned neighborhood developments (good or bad) we should know about?
- What's the average days-on-market for RENTAL listings here right now (not sales)? A rising rental-DOM trend means longer vacancies and softer asking-rent achievability than the comps imply.
- What's the recent tenant-quality profile in this submarket — average credit score on applications, eviction rate, late-payment / NSF rate, and stable-employment percentage? A property-management company in the area should have these aggregated.
- How much new for-sale + rental construction is in the pipeline within 1–3 miles? Heavy new supply typically softens prices + rents 12–24 months out; constrained supply supports both.
Investment metrics
- 1% rule
- 0.75% ✗
- Cap rate
- 5.75%
- Cash-on-cash
- -1.94%
- DSCR
- 0.91
- GRM
- 11.1
CMA / ARV
- ARV (on-the-fly)
- $331,254
- Comps found
- 12
Show comp detail 12 sales within ~0.75 mi
| Address | Dist | Beds/Ba | Sqft | Sold | Price | $/sf | Match |
|---|---|---|---|---|---|---|---|
| 349 E Quail Wood Ln | 0.06mi | 3/2.0 | 1,406 (+1%) | 3mo | $340,000 | $242 | 92 |
| 450 E Pine Ridge Dr | 0.23mi | 3/2.0 | 1,413 (+2%) | 1mo | $312,200 | $221 | 85 |
| 17051 Newberry Ln | 0.08mi | 3/2.0 | 1,406 (+1%) | 10mo | $337,000 | $240 | 85 |
| 514 E Pine Ridge Dr | 0.29mi | 3/2.0 | 1,400 (+1%) | 1mo | $336,000 | $240 | 84 |
| 464 Grabill Dr | 0.17mi | 3/2.5 | 1,398 (+1%) | 7mo | $290,000 | $207 | 82 |
| 165 E Flat Rock Dr | 0.30mi | 3/2.0 | 1,361 (-2%) | 2mo | $325,000 | $239 | 82 |
| 611 E Pine Ridge Dr | 0.34mi | 3/2.0 | 1,405 (+1%) | 7mo | $289,900 | $206 | 76 |
| 17009 Kirklin Dr | 0.18mi | 3/2.5 | 1,530 (+10%) | 0mo | $350,000 | $229 | 72 |
| 411 Vernon Pl | 0.13mi | 3/2.5 | 1,530 (+10%) | 9mo | $311,000 | $203 | 67 |
| 16603 Yeoman Way | 0.56mi | 3/2.0 | 1,440 (+4%) | 1mo | $320,600 | $223 | 67 |
| 17347 Pine Wood Ln | 0.26mi | 3/2.0 | 1,200 (-13%) | 3mo | $302,800 | $252 | 63 |
| 547 Grabill Dr | 0.26mi | 3/2.0 | 1,182 (-15%) | 9mo | $295,000 | $250 | 56 |
Match score weights: distance 35% · size 25% · config 20% · recency 20%. Top-matched comps best support the ARV.
Projected returns pro-forma
-3.0% appreciation · 4.26% rent growth · sell at horizon
- IRR
- -18.3%
- Equity multiple
- 0.35×
- Total profit
- $-63,500
- Equity at exit
- $52,171
- IRR
- -8.5%
- Equity multiple
- 0.44×
- Total profit
- $-54,424
- Equity at exit
- $30,253
Cash invested: $97,972 (down + closing). Projections, not guarantees.
Landlord ↔ Tenant lean methodology
- Overall (STATE)
- 90 Strongly Landlord-Friendly
- State Indiana
- 90 Strongly Landlord-Friendly · R+11
- County
- — inherits STATE
- City
- — inherits STATE
ZIP-level market 46074
- Rents YoY
- 4.3%
- Active inventory
- 801
- Price-to-rent
- 11.1×
Monthly cashflow live
- Estimated rent
- $2,623 high interval (Pro) →
- Mortgage (P&I)
- −$1,835
- Tax from tax record
- −$232 /mo · $2,778/yr
- Insurance
- −$146
- HOA
- −$18
- Vacancy / Maint / Mgmt
- −$551
- Net cashflow
- $-158
Break-even live
UW: 25.0% down · 7.5% · 30yr · 1.5% tax · 5.0% vac · 8.0% maint · 8.0% mgmt
Financing live
Cash to close
- Down payment
- $87,475
- Closing costs
- $10,497
- Reserves months
- —
- Total cash needed
- —
Loan-product check · same deal, 3 products live
Conventional
25% down · 7.5% · 30yr
- Down + closing
- —
- Monthly P&I
- —
- Monthly cashflow
- —
- DSCR
- —
- Eligible?
- —
Personal DTI + credit; lowest rate.
DSCR
20% down · 8.5% · 30yr
- Down + closing
- —
- Monthly P&I
- —
- Monthly cashflow
- —
- DSCR
- —
- Eligible?
- —
No personal income docs; deal must DSCR.
Hard money
10% down · 12.0% · 12mo
- Down + closing
- —
- Monthly P&I
- —
- Monthly cashflow
- —
- DSCR
- —
- Eligible?
- —
Short-term bridge; refi at stabilization.
Rent comps 22 comps
| Address | Beds | Baths | Sqft | Rent | $/sqft | DOM | Units | Dist |
|---|---|---|---|---|---|---|---|---|
| 404 E Pine Ridge Dr Westfield, IN | 3.0 | 2.5 | 1726 | $3,250 | $1.88 | 43d | 1 | 0.11mi |
| 17361 Graley Pl Westfield, IN | 3.0 | 2.5 | 1512 | $2,500 | $1.65 | 7d | 1 | 0.49mi |
| 835 Virginia Rose Ave Westfield, IN | 3.0 | 2.0 | 739 | $2,299 | $3.11 | 1d | 61 | 0.92mi |
| 172 Straughn Ln Westfield, IN | 2.0 | 2.5 | 1128 | $2,300 | $2.04 | 23d | 1 | 0.99mi |
| 879 Northwich Ave Westfield, IN | 3.0 | 2.0 | 1677 | $2,050 | $1.22 | 43d | 1 | 1.10mi |
| 881 Warrington Ave Westfield, IN | 3.0 | 2.5 | 1296 | $1,899 | $1.47 | 4d | 1 | 1.12mi |
| 176 Union Flats Blvd Westfield, IN | 1.0–2.0 | 1.0–2.0 | 885 | $1,664 | $1.88 | 1d | 6 | 1.24mi |
| 620 Southridge Ct Unit 1303752P Westfield, IN | 4.0 | 2.5 | 1797 | $5,460 | $3.04 | 14d | 1 | 1.25mi |
| 218 W Main St Westfield, IN | 4.0 | 2.5 | 1872 | $2,495 | $1.33 | 43d | 1 | 1.27mi |
| 717 Crispin Ln Westfield, IN | 3.0 | 2.0 | 1613 | $2,400 | $1.49 | 43d | 1 | 1.27mi |
| 18183 Wheeler Rd Westfield, IN | 1.0–2.0 | 1.0–2.0 | 998 | $2,559 | $2.56 | 1d | 48 | 1.30mi |
| 18237 Tempo Blvd Westfield, IN | 1.0–3.0 | 1.0–2.0 | 1034 | $2,439 | $2.36 | 1d | 78 | 1.30mi |
| 1034 Hendon Ct Westfield, IN | 3.0 | 2.0 | 1618 | $2,075 | $1.28 | 43d | 1 | 1.32mi |
| 170 Jersey St Westfield, IN | 2.0 | 1.0–2.0 | 871 | $2,359 | $2.71 | 3d | 73 | 1.33mi |
| 1500 Taper Way Westfield, IN | 1.0–3.0 | 1.0–2.0 | 1026 | $2,625 | $2.56 | 2d | 32 | 1.37mi |
| 356 Westlea Dr Westfield, IN | 3.0 | 1.0 | 1011 | $2,300 | $2.27 | 16d | 1 | 1.41mi |
| 960 Charlestowne Rd Unit 08-975 -103-ADA Westfield, IN | 2.0 | 2.0 | 1101 | $1,690 | $1.53 | 43d | 1 | 1.42mi |
| 960 Charlestowne Rd Unit 16-18488-205 Westfield, IN | 2.0 | 2.0 | 1034 | $1,670 | $1.62 | 4d | 1 | 1.42mi |
| 960 Charlestowne Rd Unit 118399--106 Westfield, IN | 3.0 | 2.0 | 1335 | $2,170 | $1.63 | 43d | 1 | 1.42mi |
| 960 Charlestowne Rd Unit 02-18365-203 Westfield, IN | 2.0 | 2.0 | 1130 | $1,740 | $1.54 | 4d | 1 | 1.42mi |
| 510 Morning Oaks Dr Westfield, IN | 1.0–2.0 | 1.0–2.0 | 995 | $1,753 | $1.76 | 1d | 16 | 1.43mi |
| 292 South Dr Westfield, IN | 3.0 | 2.0 | 1200 | $1,629 | $1.36 | 1d | 1 | 1.49mi |
HOA detail
- Monthly dues
- $18 · $216/yr
- Likely covers
- landscaping
Listing history 7 events
-
2026-06-18days on market $349,900 Active 7 DOM
-
2026-06-17days on market $349,900 Active 6 DOM
-
2026-06-16days on market $349,900 Active 5 DOM
-
2026-06-15days on market $349,900 Active 4 DOM
-
2026-06-13days on market $349,900 Active 2 DOM
-
2026-06-13remarks 629-char remark
-
2026-06-13$349,900 Active 1 DOM
ⓘ Source: listings_history table (triggers on properties + properties_extension) + one-shot
backfill from property_details.listing_events for pre-trigger history.
Tax reassessment forecast IN · Partial reset (capped growth)
- Current annual tax
- $2,778 · $232/mo
- Projected year-2 tax
- $2,876 · $240/mo
- Expected delta
- +$98/yr (+$8/mo · 3.5%)
ⓘ Screening estimate from a state-policy table — verify with the county assessor before closing.
Climate risk First Street
- Flood 1/10 Low FEMA zone X (unshaded) · 0% chance over 30 yrs
- Wildfire 1/10 Low
- Heat 3/10 Moderate 7 d/yr ≥101°F today · 18 d/yr by 30 yrs out
- Wind 2/10 Low 0% chance of damaging wind over 30 yrs
- Air quality 4/10 Moderate 3 unhealthy d/yr today · 6 by 30 yrs out
Nearby sold comps map
Loading sold comps map…
Walkable amenities ~0.75 mi
Loading nearby amenities…
Taxation est. · year 1
- Rental income
- $31,470
- − Mortgage interest
- −$19,600
- − Property taxes
- −$2,778
- − Insurance
- −$1,750
- − Repairs & maintenance
- −$2,518
- − Management
- −$2,518
- − HOA
- −$216
- − Depreciation
- −$10,179
- Taxable loss
- −$8,088
- Est. tax savings @ 24.0%
- +$1,941
- After-tax cash flow
- $40/yr
For passive investors: Depreciation is non-cash, so a rental often shows a tax loss while cash-flowing — sheltering income. Rental losses are passive: they offset passive income freely, and up to $25,000/yr can offset ordinary (W-2) income if you actively participate and your MAGI is under $100k (phasing out to $0 by $150k); unused losses carry forward. On sale, claimed depreciation is recaptured at up to 25%, and gains may owe capital-gains tax (a 1031 exchange can defer both). Figures are a year-1 estimate at your 24.0% rate — not tax advice; consult a CPA.
Schools (NCES district)
- District
- Westfield-Washington Schools
- NCES district ID
- 1813080
- Math proficiency
- 58% ▼ -9.00%
- Reading proficiency
- 64% ▼ -3.00%
- Median HH income
- $82,682
- Composite
- 55.01/100
- National rank
- #1295
- State rank
- #10 of 301 in IN
Livability — Westfield
- Score
- 71/100
- State rank
- #140
- US rank
- #7263
Category grades
Schools grade is shown separately in the Schools card above.
Census & demographics
- Census place
- Westfield, IN
- County
- Hamilton County · 337,479 people
- City population
- 48,901
- Metro
- Indianapolis-Carmel-Anderson, IN
- Population (ZIP)
- 48,901
- Household income
- $126,724
- Rent vs Own
- Severe rent burden
- 742.0
Population outlook (Hamilton County) Hauer SSP2
- Today (2025)
- 381,938 people
- By 2030
- 417,496 · +9.3%
- By 2040
- 486,684 · +27.4%
- By 2050
- 549,805 · +44.0%
- By 2075
- 687,078 · +79.9%
- By 2100
- 754,495 · +97.5%
Race, ethnicity, and origin ACS 2023
- Neighborhood character
- Predominantly White (74%)
- Race & ethnicity
- White 74% Two or more races 10% Hispanic / Latino 9% Asian 8% Black 3%
- Hispanic origin (detail)
- Mexican 4% Puerto Rican 1%
- Common ancestry
- Romanian 4% Italian 4% Lithuanian 2%
- Foreign-born
- 12% · Canada, China, South Korea
- Languages at home
- 84% English-only · Spanish 5% Arabic 3% Chinese 2%
Political lean MEDSL · Hamilton
- 2024 margin
- Lean R (+6.1) · D 46.0% · R 52.1% · Other 1.9%
- 2008→2024 swing
- +16.2pp toward D · 2008: -22.2pp · 2024: -6.1pp
- All cycles
- 2024: R+6.1 2020: R+6.8 2016: R+19.6 2012: R+34.3 2008: R+22.2
Not yet ingested
- Civics
- —
Market trends
- HPI YoY
- ▼ -140.45%
- Current HPI
- 220.9413
- Rent YoY
- ▲ 4.26%
- Metro
- Indianapolis-Carmel-Anderson, IN
- State GDP YoY
- ▲ 2.90%
- F500 in state
- 18
Industry mix (Fortune 500 HQ in IN)
| Industry | F500 HQs | Revenue |
|---|---|---|
| Industrial Machinery | 2 | $37B |
|
||
| Healthcare | 1 | $177B |
|
||
| Pharmaceuticals | 1 | $45B |
|
||
| Metals / Steel | 1 | $18B |
|
||
| Agriculture | 1 | $17B |
|
||
| Packaging | 1 | $12B |
|
||
Price history
+191.8% since first listed13 events — show timeline
- 2026-06-10 Listed $349,900 MIBOR as Distributed by MLS Grid
- 2019-04-29 Sold (MLS) $168,000 MIBOR as Distributed by MLS Grid
- 2019-03-31 Pending — MIBOR as Distributed by MLS Grid
- 2019-03-29 Price Changed $165,000 MIBOR as Distributed by MLS Grid
- 2019-03-28 Listed $155,000 MIBOR as Distributed by MLS Grid
- 2012-07-09 Listing Removed — MIBOR as Distributed by MLS Grid
- 2012-03-08 Listed $126,900 MIBOR as Distributed by MLS Grid
- 2007-06-29 Sold (MLS) $134,900 MIBOR as Distributed by MLS Grid
- 2007-04-20 Listed $134,900 MIBOR as Distributed by MLS Grid
- 2007-04-20 Listing Removed — MIBOR as Distributed by MLS Grid
- 2006-10-23 Listed $134,999 MIBOR as Distributed by MLS Grid
- 2006-09-28 Sold (MLS) $116,500 MIBOR as Distributed by MLS Grid
- 2006-06-01 Listed $119,900 MIBOR as Distributed by MLS Grid
Property tax history
-0.8%/yrLatest (2025): $2,778 · -2.8% YoY. Source: county tax records.
Cash-flow waterfall
monthlySold comps — $/sqft
last 12 mo · ≤1 miLoading sold comps…