52 Thousand Oaks Mhp · Mansfield, TX
Flood risk 1/10 · Minimal
- FEMA flood zone
- X (unshaded)
- Chance of flooding over 30 yrs
- 0.0%
- Est. flood insurance / yr
- $507 – $1,088
Fire risk 5/10 · Moderate
- Est. fire insurance / yr
- $1,222 – $2,270
Heat risk 7/10 · Major
- Hot days now (above 110°F)
- 7 days/yr
- Hot days in 30 yrs
- 23 days/yr
Wind risk 6/10 · Moderate
- Chance of severe wind over 30 yrs
- 27.0%
Air-quality risk 3/10 · Minor
- Unhealthy air days now
- 2 days/yr
- Unhealthy air days in 30 yrs
- 3 days/yr
Risk factors via First Street. Map © Google.
Why this score? — see what drove the B grade
The composite is a weighted blend of 9 inputs, each scored 0–100. Each bar is that input's sub-score; the figure is the points it added to the 100-point composite (weight × sub-score).
- Cash flow +30.0/30.0
- 1% rule +10.0/10.0
- DSCR +10.0/10.0
- ARV discount +7.5/15.0
- Schools +4.6/10.0
- Livability +3.6/5.0
- Condition / age +2.5/5.0
- Rent growth +2.2/5.0
- Appreciation +0.0/10.0
$65,000
🖨 Deal sheet 📄 Offer letter ✓ Due diligence
Listing remarks
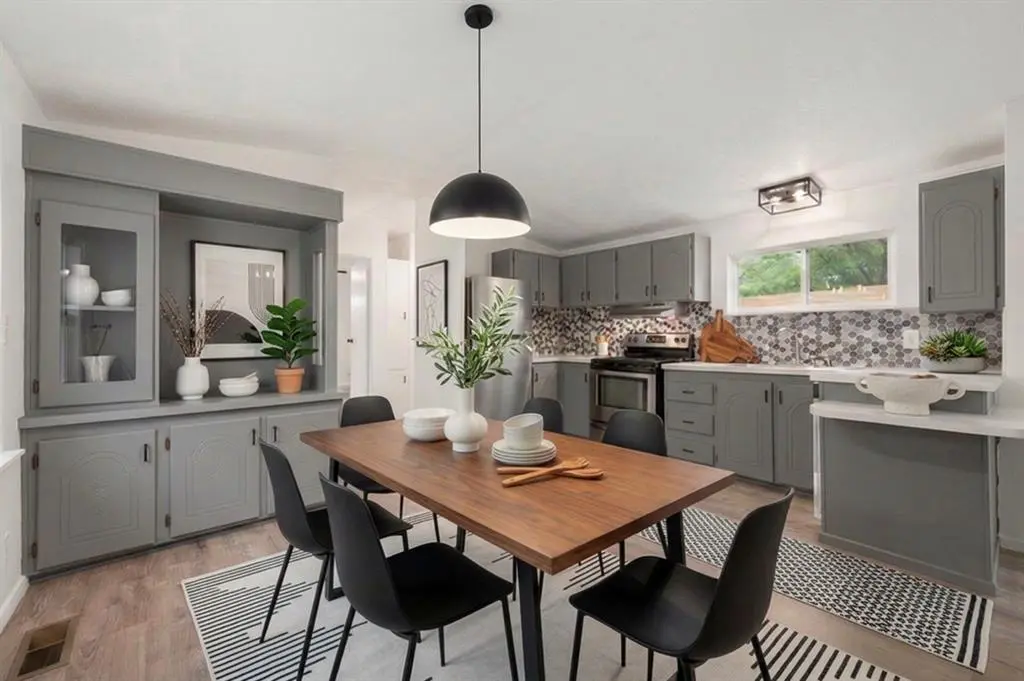
* * OPEN HOUSE June 7th, 4-6pm! * * Welcome to 52 Thousand Oaks in Mansfield! This beautifully updated 3 bedroom, 2 bathroom manufactured home offers stylish upgrades, functional living space, and move-in ready convenience all within an established community and located within highly sought-after Mansfield ISD. Step inside to a fully renovated interior featuring brand new flooring throughout, fresh paint, updated lighting, and modern ceiling fans that create a bright and inviting atmosphere. The kitchen has been tastefully refreshed with a new backsplash, updated hardware and fixtures, and includes all new appliances — refrigerator, stove, microwave, and dishwasher. Both bathrooms
Key facts
- Modern ceiling fans
- Brand new flooring
- Updated lighting
Tags
Property features AI
Finance
- Other: Located in Thousand Oaks Mhp subdivision; County: Tarrant; Country: United States
- Financial info: Treat as clear loan type; No second mortgage
- HOA & community: No homeowners association
Exterior
- Parking: Concrete parking pad; Paved parking
- Utilities: City water; No municipal utility district
- Home design: Manufactured home (residential); One level
- Construction: Built in 1987
- Exterior features: Leasehold; Zero lot; Playground in the community; Tennis courts in the community; Other community amenities
Interior
- Kitchen: Dishwasher; Electric cooktop; Electric oven; Microwave; Refrigerator
- Bedrooms: Primary bedroom (Level 1) about 12 x 14; Bedroom (Level 1) about 10 x 11; Bedroom (Level 1) about 10 x 11
- Flooring: Vinyl flooring
- Bathrooms: 2 full bathrooms
- Interior features: Built-in features; One living area; One dining area; 4 total rooms
Neighborhood map
What this means for you Summary
Snapshot
- This is a 1-bed/1.0-bath manufactured listed at $65k.
Deal economics
- At list price, monthly cash flow is $649 ($8k/yr) — positive.
- The deal already cash-flows at list — no discount required.
- Meets the 1% rule at list price ($1k rent vs $65k).
- Cap rate 18.3% vs local median 2.8% in Mansfield — top-decile yield for the area; either an underpriced asset or a hidden risk that comps aren't pricing in. Stress-test before assuming the spread holds.
Location & tenants
- Location reads 72/100 on livability (#243 in TX) — a middle-class / working-renter tenant base. Strengths: employment A+, housing A+, crime A; Watch: amenities F, commute F, health & safety D-.
- Mansfield ISD (suburban): math 47% / reading 53% proficiency, ranked #125 of 826 in TX (top 15%) — acceptable for families but not a draw, mixed tenant base, ~2y average lease.
- Zoned schools: Mary Jo Sheppard El (math 57% / reading 47%, grade C-, #742 of 4,322 statewide, top 19%, 455 students, 61% FRL) — zoned schools average 61% FRL vs 35% district-wide (26 pts higher); higher-poverty schools than district average — tighter screening recommended.
- Market conditions: Rents soft (-1.2%/yr); 715 active listings in the ZIP; 5 comparable units currently listed for rent nearby; rentals leasing fast (median 2d on market — plan ~1-2 weeks tenant-placement turnaround); high-income renter base; 18,938 units permitted in Tarrant County in 2024 (8,336 in 5+ unit buildings).
- This rent is only 14% of the median local income ($119k/yr) — well below the 30% rent-burden line; pricing power to push rent on renewal without tenant pushback.
Forward outlook
- Local home prices are declining (-3.0%/yr); year-one equity from $449 of loan paydown is wiped out by about $2k of value loss. Plan a longer hold.
- Tarrant County population projected at +41% by 2050 — long-run rental-demand tailwind backs the buy-and-hold thesis.
- At projected returns (-3.0% appreciation + 0.0% rent growth), your $18k cash investment doubles in ~3 years — after that, you're playing with house money.
Negotiation context
- Only 4 days on market — expect competitive offers; lowballing is unlikely to land.
- 2 sale attempts with the ask held roughly flat each time — persistent listings suggest the price (not the market) is what's stuck; bring a comps-based counter.
Risks & watch-outs
- Climate carrying-cost: major wind risk, 27% chance of damaging wind over 30y; moderate wildfire risk; extreme-heat days projected 7→23/yr by 2055 (HVAC capex compounding) — expect insurance premiums to compound above CPI over the hold.
Questions for the listing agent
- Is there a deadline driving the sale (1031 exchange, divorce, estate, relocation)? That informs how much negotiation room exists.
- Schools are A-rated — typically a magnet for longer-tenancy family renters. What's the average tenant stay here, and is there a school-zone premium baked into asking?
- What's the average days-on-market for RENTAL listings here right now (not sales)? A rising rental-DOM trend means longer vacancies and softer asking-rent achievability than the comps imply.
- What's the recent tenant-quality profile in this submarket — average credit score on applications, eviction rate, late-payment / NSF rate, and stable-employment percentage? A property-management company in the area should have these aggregated.
- How much new for-sale + rental construction is in the pipeline within 1–3 miles? Heavy new supply typically softens prices + rents 12–24 months out; constrained supply supports both.
Investment metrics
- 1% rule
- 2.14% ✓
- Cap rate
- 18.27%
- Cash-on-cash
- 42.76%
- DSCR
- 2.90
- GRM
- 3.9
CMA / ARV
No comps found within radius.
Projected returns pro-forma
-3.0% appreciation · 0.0% rent growth · sell at horizon
- IRR
- 36.1%
- Equity multiple
- 2.47×
- Total profit
- $26,724
- Equity at exit
- $9,692
- IRR
- 41.2%
- Equity multiple
- 4.34×
- Total profit
- $60,810
- Equity at exit
- $5,620
Cash invested: $18,200 (down + closing). Projections, not guarantees.
Landlord ↔ Tenant lean methodology
- Overall (STATE)
- 87 Strongly Landlord-Friendly
- State Texas
- 87 Strongly Landlord-Friendly · R+5
- County
- — inherits STATE
- City
- — inherits STATE
ZIP-level market 76063
- Home prices YoY
- -29.5%
- Rents YoY
- -1.2%
- Active inventory
- 715
- Price-to-rent
- 3.9×
Monthly cashflow live
- Estimated rent
- $1,390 high interval (Pro) →
- Mortgage (P&I)
- −$341
- Tax est. 1.5%
- −$81 /mo · $975/yr
- Insurance
- −$27
- HOA
- −$0
- Vacancy / Maint / Mgmt
- −$292
- Net cashflow
- $649
Break-even live
UW: 25.0% down · 7.5% · 30yr · 1.5% tax · 5.0% vac · 8.0% maint · 8.0% mgmt
Financing live
Cash to close
- Down payment
- $16,250
- Closing costs
- $1,950
- Reserves months
- —
- Total cash needed
- —
Loan-product check · same deal, 3 products live
Conventional
25% down · 7.5% · 30yr
- Down + closing
- —
- Monthly P&I
- —
- Monthly cashflow
- —
- DSCR
- —
- Eligible?
- —
Personal DTI + credit; lowest rate.
DSCR
20% down · 8.5% · 30yr
- Down + closing
- —
- Monthly P&I
- —
- Monthly cashflow
- —
- DSCR
- —
- Eligible?
- —
No personal income docs; deal must DSCR.
Hard money
10% down · 12.0% · 12mo
- Down + closing
- —
- Monthly P&I
- —
- Monthly cashflow
- —
- DSCR
- —
- Eligible?
- —
Short-term bridge; refi at stabilization.
Rent comps 5 comps
| Address | Beds | Baths | Sqft | Rent | $/sqft | DOM | Units | Dist |
|---|---|---|---|---|---|---|---|---|
| 311 Watson Branch Ln Mansfield, TX | 1.0–3.0 | 1.0–2.0 | 1105 | $1,360 | $1.23 | 1d | 32 | 0.49mi |
| 1350 FM 157 Mansfield, TX | 1.0–2.0 | 1.0–2.0 | 852 | $1,534 | $1.80 | 3d | 19 | 0.50mi |
| 1701 Towne Crossing Blvd Mansfield, TX | 1.0–2.0 | 1.0–2.0 | 832 | $1,225 | $1.47 | 2d | 15 | 0.80mi |
| 751 N Main St Mansfield, TX | 1.0–3.0 | 1.0–2.0 | 1032 | $1,394 | $1.35 | 1d | 19 | 1.17mi |
| 715 N Main St Mansfield, TX | 1.0–3.0 | 1.0–2.0 | 1022 | $1,355 | $1.33 | 1d | 18 | 1.24mi |
Listing history 4 events
-
2026-06-09days on market $65,000 Active 4 DOM
-
2026-06-08days on market $65,000 Active 3 DOM
-
2026-06-07remarks 693-char remark
-
2026-06-07$65,000 Active 2 DOM
ⓘ Source: listings_history table (triggers on properties + properties_extension) + one-shot
backfill from property_details.listing_events for pre-trigger history.
Climate risk First Street
- Flood 1/10 Low FEMA zone X (unshaded) · 0% chance over 30 yrs
- Wildfire 5/10 Major
- Heat 7/10 Severe 7 d/yr ≥110°F today · 23 d/yr by 30 yrs out
- Wind 6/10 Major 27% chance of damaging wind over 30 yrs
- Air quality 3/10 Moderate 2 unhealthy d/yr today · 3 by 30 yrs out
Nearby sold comps map
Loading sold comps map…
Walkable amenities ~0.75 mi
Loading nearby amenities…
Taxation est. · year 1
- Rental income
- $16,675
- − Mortgage interest
- −$3,641
- − Property taxes
- −$975
- − Insurance
- −$325
- − Repairs & maintenance
- −$1,334
- − Management
- −$1,334
- − Depreciation
- −$1,891
- Taxable income
- $7,175
- Est. tax owed @ 24.0%
- −$1,722
- After-tax cash flow
- $6,061/yr
For passive investors: Depreciation is non-cash, so a rental often shows a tax loss while cash-flowing — sheltering income. Rental losses are passive: they offset passive income freely, and up to $25,000/yr can offset ordinary (W-2) income if you actively participate and your MAGI is under $100k (phasing out to $0 by $150k); unused losses carry forward. On sale, claimed depreciation is recaptured at up to 25%, and gains may owe capital-gains tax (a 1031 exchange can defer both). Figures are a year-1 estimate at your 24.0% rate — not tax advice; consult a CPA.
Schools (NCES district)
- District
- Mansfield ISD
- NCES district ID
- 4828920
- Math proficiency
- 47% ▼ -17.00%
- Reading proficiency
- 53% ▼ -6.00%
- Median HH income
- $81,934
- Composite
- 45.82/100
- National rank
- #2558
- State rank
- #125 of 826 in TX
Livability — Mansfield
- Score
- 72/100
- State rank
- #243
- US rank
- #5833
Category grades
Schools grade is shown separately in the Schools card above.
Census & demographics
- Census place
- Mansfield, TX
- County
- Tarrant County · 2,033,669 people
- City population
- 82,625
- Metro
- Dallas-Fort Worth-Arlington, TX
- Population (ZIP)
- 82,625
- Household income
- $118,946
- Rent vs Own
- Severe rent burden
- 2081.0
Population outlook (Tarrant County) Hauer SSP2
- Today (2025)
- 2,380,417 people
- By 2030
- 2,578,900 · +8.3%
- By 2040
- 2,974,995 · +25.0%
- By 2050
- 3,350,489 · +40.8%
- By 2075
- 4,216,909 · +77.2%
- By 2100
- 4,741,527 · +99.2%
Race, ethnicity, and origin ACS 2023
- Neighborhood character
- Diverse neighborhood (Simpson 0.65)
- Race & ethnicity
- White 52% Black 22% Hispanic / Latino 17% Two or more races 10% Asian 4%
- Hispanic origin (detail)
- Mexican 14%
- Common ancestry
- Italian 2% Slovak 1% Lithuanian 1%
- Foreign-born
- 12% · Canada, Vietnam, China
- Languages at home
- 82% English-only · Spanish 10% Other Indo-European 2% Vietnamese 2%
Political lean MEDSL · Tarrant
- 2024 margin
- Lean R (+5.1) · D 46.7% · R 51.9% · Other 1.4%
- 2008→2024 swing
- +6.6pp toward D · 2008: -11.7pp · 2024: -5.1pp
- All cycles
- 2024: R+5.1 2020: D+0.2 2016: R+8.7 2012: R+15.7 2008: R+11.7
Not yet ingested
- Civics
- —
Market trends
- HPI YoY
- ▼ -108.63%
- Current HPI
- 259.1952
- Rent YoY
- ▼ -1.18%
- Metro
- Dallas-Fort Worth-Arlington, TX
- State GDP YoY
- ▲ 3.95%
- F500 in state
- 110
Industry mix (Fortune 500 HQ in TX)
| Industry | F500 HQs | Revenue |
|---|---|---|
| Energy | 16 | $1,198B |
|
||
| Technology | 5 | $198B |
|
||
| Engineering / Construction | 4 | $72B |
|
||
| Energy Services | 3 | $60B |
|
||
| Utilities | 3 | $41B |
|
||
| Healthcare | 2 | $330B |
|
||
Price history
+116.7% since first listed3 events — show timeline
- 2026-06-01 Listed $65,000 NTREIS
- 2025-07-10 Listing Removed — NTREIS
- 2025-06-20 Listed $30,000 NTREIS
Property tax history
-10.2%/yrLatest (2025): $81 · -1.1% YoY. Source: county tax records.
Cash-flow waterfall
monthlySold comps — $/sqft
last 12 mo · ≤1 miLoading sold comps…