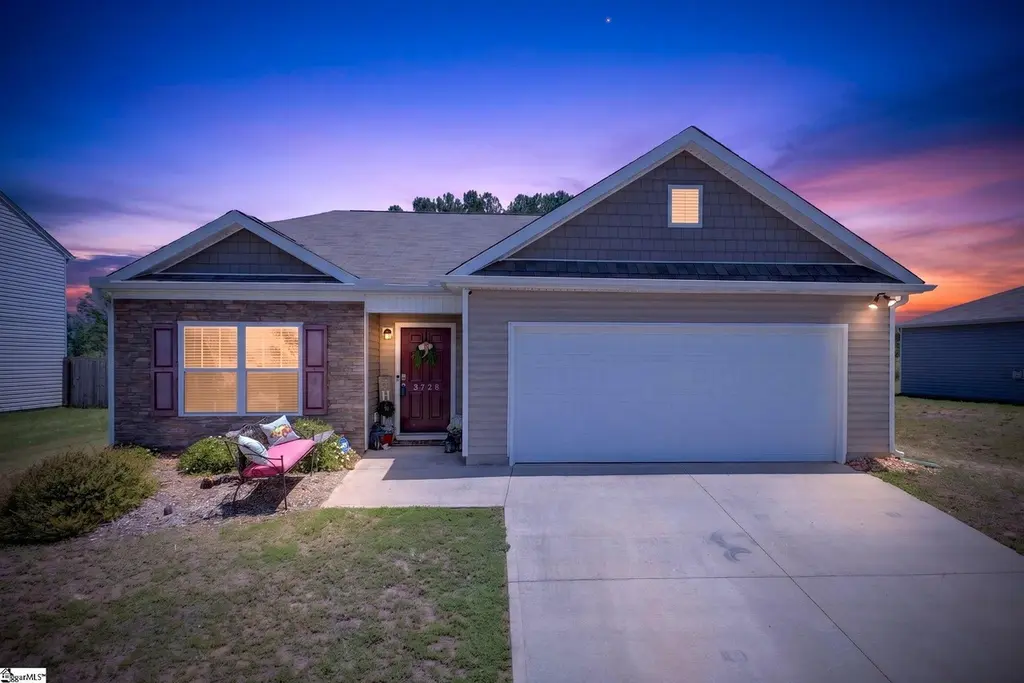
3728 Brookshade Trl · Reidville, SC
Flood risk 1/10 · Minimal
- FEMA flood zone
- X (unshaded)
- Chance of flooding over 30 yrs
- 0.0%
- Est. flood insurance / yr
- $507 – $1,088
Fire risk 4/10 · Minor
- Est. fire insurance / yr
- $783 – $1,453
Heat risk 6/10 · Moderate
- Hot days now (above 105°F)
- 7 days/yr
- Hot days in 30 yrs
- 16 days/yr
Wind risk 2/10 · Minimal
- Chance of severe wind over 30 yrs
- 2.0%
Air-quality risk 4/10 · Minor
- Unhealthy air days now
- 4 days/yr
- Unhealthy air days in 30 yrs
- 5 days/yr
Risk factors via First Street. Map © Google.
Why this score? — see what drove the D grade
The composite is a weighted blend of 9 inputs, each scored 0–100. Each bar is that input's sub-score; the figure is the points it added to the 100-point composite (weight × sub-score).
- ARV discount +9.9/15.0
- Cash flow +8.6/30.0
- Appreciation +5.0/10.0
- Schools +4.1/10.0
- Livability +4.0/5.0
- Rent growth +2.5/5.0
- Condition / age +2.5/5.0
- DSCR +2.4/10.0
- 1% rule +1.9/10.0
$259,999
🖨 Deal sheet (PDF) 📄 Offer letter ✓ Due diligence
Listing remarks
Welcome to Lightwood Cottages! This beautiful, move-in-ready home built by America’s Builder, D. R. Horton, offers the perfect blend of modern style and everyday convenience. Located in the highly sought-after Moore/Reidville area, this vibrant community feeds into the award-winning Spartanburg School District 5. Inside, you will find a bright, open-concept floor plan designed for effortless entertaining and single story living. The spacious kitchen flows seamlessly into the main living area, making it the heart of the home. With 3 spacious bedrooms on the main level, tons of closet space, huge fully fenced back yard, with a lower landing for a fire pit or sitting area, and a two car
Key facts
- 9,583 sq ft lot
- 2 garage spots
- Community pool
Tags
Property features AI
Finance
- HOA & community: Homeowners association present; HOA covers common area electric, pool, street lights, bylaws, and restrictive covenants; Community pool
Exterior
- Parking: Attached 2-car garage; Paved concrete driveway
- Security: Owned security system; Smoke detectors
- Utilities: Public water; Public sewer; Public garbage pickup; Electric service
- Home design: Single-story residence; Built in 2021; Storage in attic and garage; Slab foundation; Built by D.R. Horton
- Construction: Composition shingle roof
- Exterior features: Front porch; Patio; Tilt-out windows; Vinyl/aluminum trim; Stone and vinyl siding exterior; Fenced yard; Level to gently sloped lot with some trees; Lot dimensions approximately 142 x 63 x 132 x 62
Interior
- Kitchen: Gas cooktop; Gas oven; Built-in microwave; Dishwasher; 12 x 11 kitchen
- Bedrooms: Primary bedroom on main level with double sink, full bath (shower only), and walk-in closet; Second bedroom about 13 x 11; Third bedroom about 12 x 11; Master bedroom about 14 x 16
- Flooring: Carpet; Laminate flooring; Luxury vinyl tile/plank
- Bathrooms: Two full bathrooms (both on main level)
- Heating & cooling: Heat pump heating; Electric cooling; Electric water heater
- Interior features: Attic stairs (disappearing); Cable available; 9+ foot ceilings; Ceiling fans; Cathedral/vaulted ceilings; Smooth ceilings; Granite countertops; Open floor plan; Owned security system; Smoke detectors; Walk-in closets; Pantry (closet); Walk-in pantry; Gas log fireplace (1)
- Laundry & utility: First-floor, walk-in laundry
Neighborhood map
What this means for you Summary
Snapshot
- This is a 3-bed/2.0-bath single-family listed at $260k.
Deal economics
- At list price, monthly cash flow is $-222 ($-3k/yr) — negative.
- To cash-flow at today's rent, offer at most $221k (15.1% below list).
- To meet the 1% rule (rent ≥ 1% of price), the offer needs to be $178k (31.4% below list).
- Recommended offer: $178k (31.4% below list) — sets the bar for 1% rule.
- Cap rate 5.3% vs local median 3.8% in Reidville — top-decile yield for the area; either an underpriced asset or a hidden risk that comps aren't pricing in. Stress-test before assuming the spread holds.
Location & tenants
- Location reads 80/100 on livability (#12 in SC, #1,810 nationally) — a professional / high-income tenant draw. Strengths: crime A+, employment A+, housing A+; Watch: amenities F, commute F.
- Spartanburg 05 (suburban): math 45% / reading 51% proficiency, ranked #13 of 80 in SC (top 16%) — families likely to look elsewhere, expect single-tenant / working-renter base with shorter leases.
- Zoned schools: River Ridge Elementary (math 53% / reading 48%, grade D+, #160 of 597 statewide, top 27%, 778 students, 64% FRL); Berry Shoals Intermediate (math 54% / reading 48%, grade C, #36 of 229 statewide, top 16%, 902 students, 56% FRL); James F. Byrnes High (math 31% / reading 75%, grade C-, #140 of 196 statewide, top 72%, 2,217 students, 56% FRL) — zoned schools average 59% FRL vs 39% district-wide (19 pts higher); higher-poverty schools than district average — tighter screening recommended.
- Market conditions: 1 active listings in the ZIP; 5 comparable units currently listed for rent nearby; rentals at typical pace (median 16d on market — plan ~3-4 weeks tenant-placement turnaround); 3,129 units permitted in Spartanburg County in 2024 (40 in 5+ unit buildings).
Forward outlook
- In year one you build about $10k of equity ($2k loan paydown + $8k appreciation (3.0% local appreciation)).
- Spartanburg County population projected at +18% by 2050 — long-run rental-demand tailwind backs the buy-and-hold thesis.
- By year 4, paydown + projected appreciation supports a ~$33k cash-out refi (75% LTV) — recoverable capital for the next deal without selling this one.
Negotiation context
- Only 14 days on market — expect competitive offers; lowballing is unlikely to land.
- 4 sale attempts since 6y ago with the ask held roughly flat each time — persistent listings suggest the price (not the market) is what's stuck; bring a comps-based counter.
- Current owner paid $216k; 20% above their basis — modest negotiation headroom, anchor on the comps not their cost.
Risks & watch-outs
- Climate carrying-cost: extreme-heat days projected 7→16/yr by 2055 (HVAC capex compounding) — expect insurance premiums to compound above CPI over the hold.
Questions for the listing agent
- What do current leases actually rent for vs. the listed asking? Can we see a recent rent roll and the last 12 months of T-12 income?
- What does the HOA fee cover, when was the last increase, and are there any pending special assessments or reserve-fund shortfalls?
- Is there a deadline driving the sale (1031 exchange, divorce, estate, relocation)? That informs how much negotiation room exists.
- Schools are B-rated — typically a magnet for longer-tenancy family renters. What's the average tenant stay here, and is there a school-zone premium baked into asking?
- The area grade is low — what's the realistic commute time and amenity access for the typical tenant pool here? Any planned neighborhood developments (good or bad) we should know about?
- What's the average days-on-market for RENTAL listings here right now (not sales)? A rising rental-DOM trend means longer vacancies and softer asking-rent achievability than the comps imply.
- What's the recent tenant-quality profile in this submarket — average credit score on applications, eviction rate, late-payment / NSF rate, and stable-employment percentage? A property-management company in the area should have these aggregated.
- How much new for-sale + rental construction is in the pipeline within 1–3 miles? Heavy new supply typically softens prices + rents 12–24 months out; constrained supply supports both.
Investment metrics
- 1% rule
- 0.69% ✗
- Cap rate
- 5.27%
- Cash-on-cash
- -3.66%
- DSCR
- 0.84
- GRM
- 12.2
CMA / ARV
- ARV (on-the-fly)
- $274,736
- Comps found
- 12
Show comp detail 12 sales within ~0.75 mi
| Address | Dist | Beds/Ba | Sqft | Sold | Price | $/sf | Match |
|---|---|---|---|---|---|---|---|
| 3379 Cypress Hollow Dr | 0.15mi | 3/2.0 | 1,618 (+4%) | 1mo | $289,990 | $179 | 86 |
| 3363 Cypress Hollow Dr | 0.16mi | 3/2.0 | 1,618 (+4%) | 1mo | $284,500 | $176 | 86 |
| 3392 Cypress Hollow Dr | 0.18mi | 3/2.0 | 1,618 (+4%) | 0mo | $285,000 | $176 | 85 |
| 3371 Cypress Hollow Dr | 0.16mi | 3/2.0 | 1,618 (+4%) | 1mo | $285,000 | $176 | 85 |
| 3397 Cypress Hollow Dr | 0.15mi | 3/2.0 | 1,343 (-14%) | 1mo | $273,990 | $204 | 69 |
| 3355 Cypress Hollow Dr | 0.17mi | 3/2.0 | 1,343 (-14%) | 2mo | $265,000 | $197 | 67 |
| 3396 Cypress Hollow Dr | 0.16mi | 4/2.0 (+1) | 1,764 (+13%) | 1mo | $295,490 | $168 | 65 |
| 3359 Cypress Hollow Dr | 0.17mi | 4/2.0 (+1) | 1,764 (+13%) | 1mo | $288,990 | $164 | 64 |
| 3384 Cypress Hollow Dr | 0.19mi | 4/2.0 (+1) | 1,764 (+13%) | 1mo | $289,900 | $164 | 64 |
| 3335 Cypress Hollow Dr | 0.19mi | 4/2.0 (+1) | 1,764 (+13%) | 2mo | $282,900 | $160 | 63 |
| 3342 Cypress Hollow Dr | 0.22mi | 4/2.0 (+1) | 1,764 (+13%) | 2mo | $285,900 | $162 | 62 |
| 454 Fenwick Dr | 0.64mi | 4/2.0 (+1) | 1,764 (+13%) | 2mo | $305,000 | $173 | 42 |
Match score weights: distance 35% · size 25% · config 20% · recency 20%. Top-matched comps best support the ARV.
Projected returns pro-forma
3.0% appreciation · 3.0% rent growth · sell at horizon
- IRR
- 4.1%
- Equity multiple
- 1.23×
- Total profit
- $17,088
- Equity at exit
- $116,907
- IRR
- 7.3%
- Equity multiple
- 2.11×
- Total profit
- $80,610
- Equity at exit
- $180,167
Cash invested: $72,800 (down + closing). Projections, not guarantees.
Landlord ↔ Tenant lean methodology
- Overall (STATE)
- 90 Strongly Landlord-Friendly
- State South Carolina
- 90 Strongly Landlord-Friendly · R+6
- County
- — inherits STATE
- City
- — inherits STATE
ZIP-level market 29369-9812
- Active inventory
- 1
- Price-to-rent
- 12.2×
Monthly cashflow live
- Estimated rent
- $1,783 high interval (Pro) →
- Mortgage (P&I)
- −$1,363
- Tax from tax record
- −$113 /mo · $1,354/yr
- Insurance
- −$108
- HOA
- −$46
- Vacancy / Maint / Mgmt
- −$374
- Net cashflow
- $-222
Break-even live
Sensitivity live
| Price | -10% $-75 | -5% $-149 | +0% $-222 | +5% $-296 | +10% $-369 |
|---|---|---|---|---|---|
| Rent | -10% $-363 | -5% $-293 | +0% $-222 | +5% $-152 | +10% $-81 |
| Rate | -1.0pp $-91 | -0.5pp $-156 | base $-222 | +0.5pp $-290 | +1.0pp $-358 |
UW: 25.0% down · 7.5% · 30yr · 1.5% tax · 5.0% vac · 8.0% maint · 8.0% mgmt
Financing live
Cash to close
- Down payment
- $65,000
- Closing costs
- $7,800
- Reserves months
- —
- Total cash needed
- —
Loan-product check · same deal, 3 products live
Conventional
25% down · 7.5% · 30yr
- Down + closing
- —
- Monthly P&I
- —
- Monthly cashflow
- —
- DSCR
- —
- Eligible?
- —
Personal DTI + credit; lowest rate.
DSCR
20% down · 8.5% · 30yr
- Down + closing
- —
- Monthly P&I
- —
- Monthly cashflow
- —
- DSCR
- —
- Eligible?
- —
No personal income docs; deal must DSCR.
Hard money
10% down · 12.0% · 12mo
- Down + closing
- —
- Monthly P&I
- —
- Monthly cashflow
- —
- DSCR
- —
- Eligible?
- —
Short-term bridge; refi at stabilization.
Rent comps 5 comps
| Address | Beds | Baths | Sqft | Rent | $/sqft | DOM | Units | Dist |
|---|---|---|---|---|---|---|---|---|
| 3125 Hickory Ridge Trl Moore, SC | 4.0 | 2.5 | 2175 | $2,045 | $0.94 | 5d | 1 | 0.28mi |
| 130 Fenwick Dr Woodruff, SC | 3.0 | 2.0 | 1618 | $1,895 | $1.17 | 21d | 1 | 0.36mi |
| 1071 Lightwood Knot Rd Woodruff, SC | 4.0 | 2.0 | 1544 | $1,545 | $1.00 | 15d | 1 | 1.33mi |
| 445 Pine Hills Rd Woodruff, SC | 3.0 | 2.0 | 1296 | $1,220 | $0.94 | 5d | 1 | 1.34mi |
| 975 Lightwood Knot Rd Woodruff, SC | 3.0 | 2.0 | 1261 | $950 | $0.75 | 15d | 1 | 1.48mi |
HOA detail
- Monthly dues
- $46 · $552/yr
Listing history 11 events
-
2026-06-22days on market $259,999 Active 14 DOM
-
2026-06-18days on market $259,999 Active 11 DOM
-
2026-06-17days on market $259,999 Active 10 DOM
-
2026-06-16days on market $259,999 Active 9 DOM
-
2026-06-15pricedays on market $259,999 Active 8 DOM
-
2026-06-14days on market $264,999 Active 6 DOM
-
2026-06-13days on market $264,999 Active 5 DOM
-
2026-06-10days on market $264,999 Active 3 DOM
-
2026-06-09days on market $264,999 Active 2 DOM
-
2026-06-07remarks 693-char remark
-
2026-06-07$264,999 Active 1 DOM
ⓘ Source: listings_history table (triggers on properties + properties_extension) + one-shot
backfill from property_details.listing_events for pre-trigger history.
Tax reassessment forecast SC · Resets to sale price
- Current annual tax
- $1,354 · $113/mo
- Projected year-2 tax
- $1,482 · $123/mo
- Expected delta
- +$128/yr (+$11/mo · 9.5%)
ⓘ Screening estimate from a state-policy table — verify with the county assessor before closing.
Climate risk First Street
- Flood 1/10 Low FEMA zone X (unshaded) · 0% chance over 30 yrs
- Wildfire 4/10 Moderate
- Heat 6/10 Major 7 d/yr ≥105°F today · 16 d/yr by 30 yrs out
- Wind 2/10 Low 2% chance of damaging wind over 30 yrs
- Air quality 4/10 Moderate 4 unhealthy d/yr today · 5 by 30 yrs out
Nearby sold comps map
Loading sold comps map…
Walkable amenities ~0.75 mi
Loading nearby amenities…
Taxation est. · year 1
- Rental income
- $21,392
- − Mortgage interest
- −$14,564
- − Property taxes
- −$1,354
- − Insurance
- −$1,300
- − Repairs & maintenance
- −$1,711
- − Management
- −$1,711
- − HOA
- −$552
- − Depreciation
- −$7,564
- Taxable loss
- −$7,364
- Est. tax savings @ 24.0%
- +$1,767
- After-tax cash flow
- $-900/yr
For passive investors: Depreciation is non-cash, so a rental often shows a tax loss while cash-flowing — sheltering income. Rental losses are passive: they offset passive income freely, and up to $25,000/yr can offset ordinary (W-2) income if you actively participate and your MAGI is under $100k (phasing out to $0 by $150k); unused losses carry forward. On sale, claimed depreciation is recaptured at up to 25%, and gains may owe capital-gains tax (a 1031 exchange can defer both). Figures are a year-1 estimate at your 24.0% rate — not tax advice; consult a CPA.
Schools (NCES district)
- District
- Spartanburg 05
- NCES district ID
- 4503600
- Math proficiency
- 45% ▼ -11.00%
- Reading proficiency
- 51% ▬ 0.00%
- Median HH income
- $52,127
- Composite
- 41.31/100
- National rank
- #3512
- State rank
- #13 of 80 in SC
Livability — Reidville
- Score
- 80/100
- State rank
- #12
- US rank
- #1810
Category grades
Schools grade is shown separately in the Schools card above.
Census & demographics
No demographic data for this ZIP.
Market trends
- HPI YoY
- —
- Current HPI
- —
- Rent YoY
- —
- Metro
- —
- State GDP YoY
- ▲ 4.51%
- F500 in state
- 2
Industry mix (Fortune 500 HQ in SC)
| Industry | F500 HQs | Revenue |
|---|---|---|
| Packaging | 1 | $7B |
|
||
Price history
+25.0% since first listed18 events — show timeline
- 2026-06-07 Listed $264,999 Greater Greenville MLS
- 2025-12-29 Listing Removed — Greater Greenville MLS
- 2025-09-18 Price Changed $259,500 Greater Greenville MLS
- 2025-09-18 Price Changed $259,500 SPMLS
- 2025-08-07 Price Changed $262,000 Greater Greenville MLS
- 2025-08-07 Price Changed $262,000 SPMLS
- 2025-08-07 Price Changed $262,000 GAOR
- 2025-07-24 Price Changed $265,000 GAOR
- 2025-07-23 Price Changed $265,000 Greater Greenville MLS
- 2025-07-23 Price Changed $265,000 SPMLS
- 2025-06-28 Listed $269,900 Greater Greenville MLS
- 2025-06-26 Listed $269,999 SPMLS
- 2021-08-16 Sold (MLS) $215,990 SPMLS
- 2021-05-20 Pending — SPMLS
- 2021-02-13 Contingent — SPMLS
- 2021-02-02 Price Changed $215,990 SPMLS
- 2021-01-19 Price Changed $213,990 SPMLS
- 2020-12-08 Listed $211,990 SPMLS
Property tax history
+112.7%/yrLatest (2025): $1,354 · +0.7% YoY. Source: county tax records.
Cash-flow waterfall
monthlySold comps — $/sqft
last 12 mo · ≤1 miLoading sold comps…