 Multi-family
223+225 Neil St · Saranac Lake, NY
Flood risk 1/10 · Minimal
- FEMA flood zone
- X
- Chance of flooding over 30 yrs
- 0.0%
- Est. flood insurance / yr
- $473 – $860
Fire risk 3/10 · Minor
- Est. fire insurance / yr
- $691 – $1,283
Heat risk 1/10 · Minimal
- Hot days now (above 88°F)
- 7 days/yr
- Hot days in 30 yrs
- 16 days/yr
Wind risk 1/10 · Minimal
- Chance of severe wind over 30 yrs
- —
Air-quality risk 1/10 · Minimal
- Unhealthy air days now
- 0 days/yr
- Unhealthy air days in 30 yrs
- 0 days/yr
Risk factors via First Street. Map © Google.
Why this score? — see what drove the B- grade
The composite is a weighted blend of 9 inputs, each scored 0–100. Each bar is that input's sub-score; the figure is the points it added to the 100-point composite (weight × sub-score).
- Cash flow +30.0/30.0
- DSCR +10.0/10.0
- 1% rule +8.9/10.0
- ARV discount +8.6/15.0
- Livability +3.8/5.0
- Schools +3.6/10.0
- Rent growth +2.5/5.0
- Condition / age +2.2/5.0
- Appreciation +0.0/10.0
$459,900
🖨 Deal sheet 📄 Offer letter ✓ Due diligence
Multi-family units
County records classify this as Multi-Family (2-4 Unit). Listing-text estimate: 1 unit. estimate disagrees with records
Listing remarks MLS
Rare multi-unit investment opportunity featuring two separate buildings on one property. The first building is a standalone single-family style home offering 3 bedrooms and 1.5 baths, providing flexible rental options or potential owner-occupant use. The second building consists of 3 units: 3/1, 2/1 and 1/1 (basement) The property currently generates $4,300/month in rental income, with clear upside potential as rents are below current market value. Separate layouts allow for diversified tenant mix and strong long-term cash flow potential. Ideal for investors seeking immediate income with room to increase returns over time. Fully rented with long term tenants Perfect setup for owner occupied main building and rental building to supplement mortgage.
Key facts
- Immediate income
- 7,840 sq ft lot
- 6 parking spots
Tags
Neighborhood map
What this means for you Summary
Snapshot
- This is a ?-bed/0.5-bath multifamily listed at $460k. Condition is rated fair.
Deal economics
- At list price, monthly cash flow is $2k ($22k/yr) — positive.
- The deal already cash-flows at list — no discount required.
- Meets the 1% rule at list price ($6k rent vs $460k).
- Recommended offer: $419k (9.0% below list) — sets the bar for market timing.
- Cap rate 11.2% vs local median 2.5% in Saranac Lake — top-decile yield for the area; either an underpriced asset or a hidden risk that comps aren't pricing in. Stress-test before assuming the spread holds.
Location & tenants
- Location reads 75/100 on livability (#274 in NY, #4,341 nationally) — a middle-class / working-renter tenant base. Strengths: housing A+, cost of living A-; Watch: health & safety C-, crime D+, amenities D+.
- Saranac Lake Central School District (town): math 35% / reading 48% proficiency, ranked #497 of 590 in NY (top 84%) — families likely to look elsewhere, expect single-tenant / working-renter base with shorter leases.
- Market conditions: 77 active listings in the ZIP; 124 units permitted in Franklin County in 2024 (0 in 5+ unit buildings).
Forward outlook
- Local home prices are declining (-3.0%/yr); year-one equity from $3k of loan paydown is wiped out by about $14k of value loss. Plan a longer hold.
- Franklin County population projected at -14% by 2050 — secular population decline; favor cash flow + early exit over multi-decade hold.
- At projected returns (-3.0% appreciation + 3.0% rent growth), your $129k cash investment doubles in ~7 years — after that, you're playing with house money.
Negotiation context
- It's been on market 118 days — a 9% lower offer ($419k) is reasonable based on typical stale-listing flexibility.
Risks & watch-outs
- Watch-outs: built in 1920 — expect roof / HVAC / electrical / plumbing capex.
Questions for the listing agent
- It's been on market 118 days. Have you received any prior offers? Is the seller open to a 9% concession, seller financing, or rate buy-down credit?
- Have any recent inspections been done? Can we get a copy of the seller's disclosures and any deferred-maintenance estimates?
- Built in 1920 — when were the roof, HVAC, electrical panel, plumbing, and water heater last replaced?
- Why hasn't it sold? Are there any deal-killer items the seller is aware of (foundation, flood, title, zoning, code violations)?
- Is there a deadline driving the sale (1031 exchange, divorce, estate, relocation)? That informs how much negotiation room exists.
- Schools are B-rated — typically a magnet for longer-tenancy family renters. What's the average tenant stay here, and is there a school-zone premium baked into asking?
- Crime grade is D in this area — have there been break-ins, vandalism, or insurance claims at this property in the last 3 years? What carrier currently insures it and at what premium?
- What's the average days-on-market for RENTAL listings here right now (not sales)? A rising rental-DOM trend means longer vacancies and softer asking-rent achievability than the comps imply.
- What's the recent tenant-quality profile in this submarket — average credit score on applications, eviction rate, late-payment / NSF rate, and stable-employment percentage? A property-management company in the area should have these aggregated.
- How much new apartment / multifamily construction is in the pipeline within 1–3 miles? Heavy new supply (>2% of stock underway) typically softens rents 12–24 months out; light construction supports rent growth.
Investment metrics
- 1% rule
- 1.39% ✓
- Cap rate
- 11.16%
- Cash-on-cash
- 17.39%
- DSCR
- 1.77
- GRM
- 6.0
CMA / ARV
- ARV (median comp)
- $471,236
- List price
- $459,900
- Delta
- -2.41%
- Verdict
- FAIR
- Comps
- 11 within 1.0 mi
Show comp detail 1 sale within ~0.75 mi
| Address | Dist | Beds/Ba | Sqft | Sold | Price | $/sf | Match |
|---|---|---|---|---|---|---|---|
| 51 Front St | 0.39mi | —/— | 3,442 (-7%) | 6mo | $400,000 | $116 | 65 |
Match score weights: distance 35% · size 25% · config 20% · recency 20%. Top-matched comps best support the ARV.
Projected returns pro-forma
-3.0% appreciation · 3.0% rent growth · sell at horizon
- IRR
- 8.8%
- Equity multiple
- 1.34×
- Total profit
- $44,412
- Equity at exit
- $68,573
- IRR
- 18.0%
- Equity multiple
- 2.49×
- Total profit
- $192,089
- Equity at exit
- $39,764
Cash invested: $128,772 (down + closing). Projections, not guarantees.
Landlord ↔ Tenant lean methodology
- Overall (STATE)
- 15 Strongly Tenant-Friendly
- State New York
- 15 Strongly Tenant-Friendly · D+10
- County
- — inherits STATE
- City
- — inherits STATE
ZIP-level market 12983
- Home prices YoY
- -12.9%
- Active inventory
- 77
- Price-to-rent
- 23.1×
Monthly cashflow live
- Estimated rent
- $6,385 medium interval (Pro) →
- Mortgage (P&I)
- −$2,412
- Tax est. 1.5%
- −$575 /mo · $6,898/yr
- Insurance
- −$192
- HOA
- −$0
- Vacancy / Maint / Mgmt
- −$1,341
- Net cashflow
- $1,866
Break-even live
4-unit breakdown (identical units grouped — click to expand)
| Units | Beds | Baths | Est. rent |
|---|---|---|---|
| 1× unit | 3 | 1.5 | $1,656 |
| 1× unit | 3 | 1 | $1,656 |
| 1× unit | 2 | 1 | $1,514 |
| 1× unit | 1 | 1 | $1,559 |
| Total (4 units) | $6,385 | ||
UW: 25.0% down · 7.5% · 30yr · 1.5% tax · 5.0% vac · 8.0% maint · 8.0% mgmt
Financing live
Cash to close
- Down payment
- $114,975
- Closing costs
- $13,797
- Reserves months
- —
- Total cash needed
- —
Loan-product check · same deal, 3 products live
Conventional
25% down · 7.5% · 30yr
- Down + closing
- —
- Monthly P&I
- —
- Monthly cashflow
- —
- DSCR
- —
- Eligible?
- —
Personal DTI + credit; lowest rate.
DSCR
20% down · 8.5% · 30yr
- Down + closing
- —
- Monthly P&I
- —
- Monthly cashflow
- —
- DSCR
- —
- Eligible?
- —
No personal income docs; deal must DSCR.
Hard money
10% down · 12.0% · 12mo
- Down + closing
- —
- Monthly P&I
- —
- Monthly cashflow
- —
- DSCR
- —
- Eligible?
- —
Short-term bridge; refi at stabilization.
Listing history 15 events
-
2026-06-18days on market $459,900 Active 118 DOM
-
2026-06-17days on market $459,900 Active 117 DOM
-
2026-06-16days on market $459,900 Active 116 DOM
-
2026-06-15days on market $459,900 Active 115 DOM
-
2026-06-13days on market $459,900 Active 113 DOM
-
2026-06-12days on market $459,900 Active 112 DOM
-
2026-06-09days on market $459,900 Active 109 DOM
-
2026-06-08days on market $459,900 Active 108 DOM
-
2026-06-07days on market $459,900 Active 107 DOM
-
2026-06-07days on market $459,900 Active 106 DOM
-
2026-06-04days on market $459,900 Active 103 DOM
-
2026-06-02days on market $459,900 Active 102 DOM
-
2026-06-01days on market $459,900 Active 101 DOM
-
2026-05-31days on market $459,900 Active 100 DOM
-
2026-02-21$459,900 Active 763-char remark
Show marketing remark (763 chars)
Rare multi-unit investment opportunity featuring two separate buildings on one property. The first building is a standalone single-family style home offering 3 bedrooms and 1.5 baths, providing flexible rental options or potential owner-occupant use. The second building consists of 3 units: 3/1, 2/1 and 1/1 (basement) The property currently generates $4,300/month in rental income, with clear upside potential as rents are below current market value. Separate layouts allow for diversified tenant mix and strong long-term cash flow potential. Ideal for investors seeking immediate income with room to increase returns over time. Fully rented with long term tenants Perfect setup for owner occupied main building and rental building to supplement mortgage.
ⓘ Source: listings_history table (triggers on properties + properties_extension) + one-shot
backfill from property_details.listing_events for pre-trigger history.
Climate risk First Street
- Flood 1/10 Low FEMA zone X · 0% chance over 30 yrs
- Wildfire 3/10 Moderate
- Heat 1/10 Low 7 d/yr ≥88°F today · 16 d/yr by 30 yrs out
- Wind 1/10 Low
- Air quality 1/10 Low 0 unhealthy d/yr today · 0 by 30 yrs out
Nearby sold comps map
Loading sold comps map…
Walkable amenities ~0.75 mi
Loading nearby amenities…
Taxation est. · year 1
- Rental income
- $76,620
- − Mortgage interest
- −$25,762
- − Property taxes
- −$6,898
- − Insurance
- −$2,300
- − Repairs & maintenance
- −$6,130
- − Management
- −$6,130
- − Depreciation
- −$13,379
- Taxable income
- $16,022
- Est. tax owed @ 24.0%
- −$3,845
- After-tax cash flow
- $18,545/yr
For passive investors: Depreciation is non-cash, so a rental often shows a tax loss while cash-flowing — sheltering income. Rental losses are passive: they offset passive income freely, and up to $25,000/yr can offset ordinary (W-2) income if you actively participate and your MAGI is under $100k (phasing out to $0 by $150k); unused losses carry forward. On sale, claimed depreciation is recaptured at up to 25%, and gains may owe capital-gains tax (a 1031 exchange can defer both). Figures are a year-1 estimate at your 24.0% rate — not tax advice; consult a CPA.
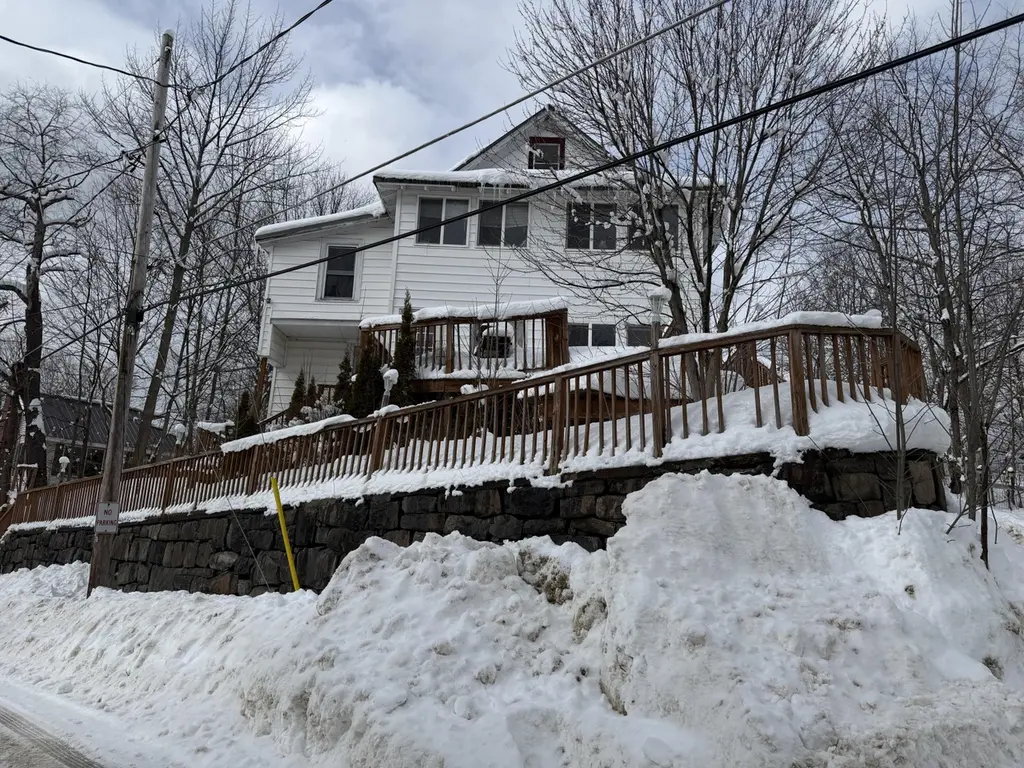
Condition & rehab AI · 3 photos
The property requires significant repairs and updates to its roof, siding, paint, flooring, interior, systems, and landscaping, which would significantly increase its value for both resale and rental purposes.
Repairs flagged
- Major roof — Significant snow accumulation and visible signs of wear suggest a major repair is needed.
- Major siding — Peeling siding and chipping paint indicate a major repair is needed.
- Major flooring — The overall condition of the property suggests the flooring may need replacement.
- Major interior walls/paint — The exterior condition suggests the interior may be in a similar state, requiring major repairs.
- Major systems — The overall condition of the property suggests the systems may need updating or replacement.
- Major landscaping — The landscaping is overgrown and the curb appeal is low, indicating a major repair is needed to improve the property's appearance.
Value-add opportunities
- Both roof replacement — Replacing the roof would improve the property's appearance and functionality, increasing both resale and rental value.
- Both siding and paint repair — Repairing the siding and repainting would significantly improve the property's curb appeal and overall condition, enhancing both resale and rental value.
- Both landscaping and curb appeal — Improving the landscaping and curb appeal would make the property more attractive and increase its value for both resale and rental purposes.
- Both interior repairs and updates — Updating the interior, including flooring and walls, would improve the property's overall condition and increase its value for both resale and rental purposes.
- Both system upgrades — Upgrading the systems, such as HVAC and electrical, would improve the property's functionality and increase its value for both resale and rental purposes.
Renovation cost estimate screening
| Repair item | Severity | Est. cost |
|---|---|---|
| roof · Significant snow accumulation and visible signs of wear suggest a major repair is needed. | Major | $15,000–50,000 |
| siding · Peeling siding and chipping paint indicate a major repair is needed. | Major | $15,000–50,000 |
| flooring · The overall condition of the property suggests the flooring may need replacement. | Major | $15,000–50,000 |
| interior walls/paint · The exterior condition suggests the interior may be in a similar state, requiring major repairs. | Major | $15,000–50,000 |
| systems · The overall condition of the property suggests the systems may need updating or replacement. | Major | $15,000–50,000 |
| landscaping · The landscaping is overgrown and the curb appeal is low, indicating a major repair is needed to improve the property's appearance. | Major | $15,000–50,000 |
| Total estimated repair cost · 6 items | $90,000–300,000 |
Value-add ROI direction
- Both roof replacement — Replacing the roof would improve the property's appearance and functionality, increasing both resale and rental value. ↑
- Both siding and paint repair — Repairing the siding and repainting would significantly improve the property's curb appeal and overall condition, enhancing both resale and rental value. ↑
- Both landscaping and curb appeal — Improving the landscaping and curb appeal would make the property more attractive and increase its value for both resale and rental purposes. ↑
- Both interior repairs and updates — Updating the interior, including flooring and walls, would improve the property's overall condition and increase its value for both resale and rental purposes. ↑
- Both system upgrades — Upgrading the systems, such as HVAC and electrical, would improve the property's functionality and increase its value for both resale and rental purposes. ↑
ⓘ Cost ranges are severity-bucket heuristics (US national rule-of-thumb). Get contractor quotes + a written scope before underwriting a rehab budget.
Schools (NCES district)
- District
- Saranac Lake Central School District
- NCES district ID
- 3625740
- Math proficiency
- 35% ▼ -7.00%
- Reading proficiency
- 48% ▲ 7.00%
- Median HH income
- $50,434
- Composite
- 35.73/100
- National rank
- #4856
- State rank
- #497 of 590 in NY
Livability — Saranac Lake
- Score
- 75/100
- State rank
- #274
- US rank
- #4341
Category grades
Schools grade is shown separately in the Schools card above.
Census & demographics
- Census place
- Saranac Lake, NY
- Population (ZIP)
- 7,410
Population outlook (Franklin County) Hauer SSP2
- Today (2025)
- 48,098 people
- By 2030
- 46,790 · -2.7%
- By 2040
- 44,400 · -7.7%
- By 2050
- 41,256 · -14.2%
- By 2075
- 32,190 · -33.1%
- By 2100
- 23,407 · -51.3%
Race, ethnicity, and origin ACS 2023
- Neighborhood character
- Predominantly White (92%)
- Race & ethnicity
- White 92% Two or more races 3% Hispanic / Latino 3% Black 2%
- Common ancestry
- Lithuanian 7% Romanian 5% Slovak 3%
- Foreign-born
- 1% · Canada
- Languages at home
- 97% English-only · French/Haitian/Cajun 1% Spanish 1% German/W. Germanic 1%
Political lean MEDSL · Franklin
- 2024 margin
- Lean R (+9.0) · D 45.5% · R 54.5%
- 2008→2024 swing
- -31.2pp toward R · 2008: 22.2pp · 2024: -9.0pp
- All cycles
- 2024: R+9.0 2020: R+2.2 2016: R+7.4 2012: D+26.3 2008: D+22.2
Not yet ingested
- Civics
- —
Market trends
- HPI YoY
- ▼ -47.20%
- Current HPI
- 318.7218
- Rent YoY
- —
- Metro
- —
- State GDP YoY
- ▲ 2.60%
- F500 in state
- 92
Industry mix (Fortune 500 HQ in NY)
| Industry | F500 HQs | Revenue |
|---|---|---|
| Financial Services | 10 | $950B |
|
||
| Consumer Goods | 9 | $162B |
|
||
| Insurance | 4 | $225B |
|
||
| Telecommunications | 2 | $144B |
|
||
| Pharmaceuticals | 2 | $112B |
|
||
| Media / Entertainment | 2 | $69B |
|
||
Price history
1 event — show timeline
- 2026-02-21 Listed $459,900 ACVMLS
Cash-flow waterfall
monthlySold comps — $/sqft
last 12 mo · ≤1 miLoading sold comps…