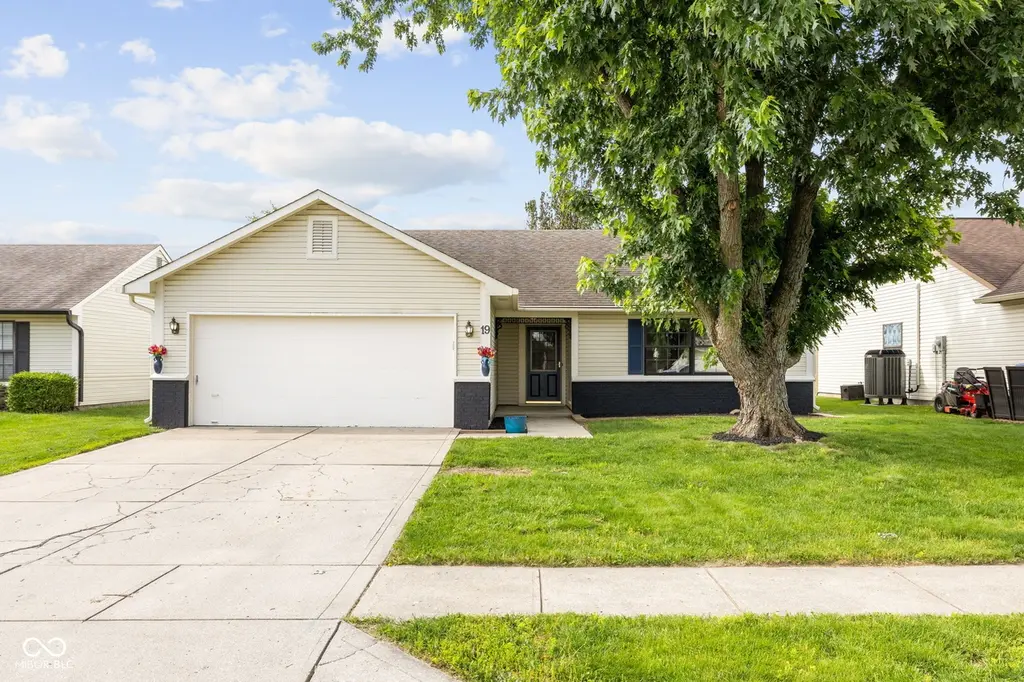
19 Lake Dr S · Brownsburg, IN
Flood risk 1/10 · Minimal
- FEMA flood zone
- X (unshaded)
- Chance of flooding over 30 yrs
- 0.0%
- Est. flood insurance / yr
- $507 – $1,088
Fire risk 1/10 · Minimal
- Est. fire insurance / yr
- $717 – $1,331
Heat risk 3/10 · Minor
- Hot days now (above 100°F)
- 7 days/yr
- Hot days in 30 yrs
- 19 days/yr
Wind risk 2/10 · Minimal
- Chance of severe wind over 30 yrs
- 0.0%
Air-quality risk 2/10 · Minimal
- Unhealthy air days now
- 1 days/yr
- Unhealthy air days in 30 yrs
- 2 days/yr
Risk factors via First Street. Map © Google.
Why this score? — see what drove the D- grade
The composite is a weighted blend of 9 inputs, each scored 0–100. Each bar is that input's sub-score; the figure is the points it added to the 100-point composite (weight × sub-score).
- Cash flow +10.3/30.0
- Schools +6.3/10.0
- Rent growth +4.1/5.0
- Livability +3.8/5.0
- ARV discount +3.1/15.0
- DSCR +3.0/10.0
- Condition / age +2.5/5.0
- 1% rule +2.3/10.0
- Appreciation +0.0/10.0
$269,900
🖨 Deal sheet 📄 Offer letter ✓ Due diligence
Listing remarks MLS
Attractive ranch in Brownsburg’s Cedar Run Lake w/lots of updates through out! Home has new laminate flooring in great room, kitchen w/new carpet in the bedrooms & vinyl flooring in both bathrooms. Lots of new light fixtures throughout home. Great floor plan w/cathedral ceilings in great room w/new ceiling fan open the eat-in kitchen & much more! Lots of cabinets & all appliances to stay with home. A very nice brick patio w/nice back yard with no houses behind the lot! Home is ready to be moved in & is in a great location in Brownsburg near schools and so much more! Laundry room off the garage w/water softener and both washer and dryer to stay. A very nice 2 car attached garage and much more!!!! Show and Sell!!!!!
Key facts
- Private lot
- Walk-in closet
- Split floor plan
Tags
Property features AI
Finance
- Other: Mandatory fee ownership
- HOA & community: Homeowners association with annual fee (maintenance included); Association provides grounds maintenance
Exterior
- Parking: Attached finished garage; Two-car garage (approx. 400 sq ft)
- Utilities: Public water; Municipal sewer; Cable available; No solid waste service (per listing)
- Home design: Single-family residence; One level (single story); Less than 1/4 acre lot (approx. 0.15 acre)
- Construction: Brick and vinyl siding exterior; Slab foundation
- Exterior features: Front porch; Storage shed; Partial fencing; Sidewalks; Mature trees
Interior
- Kitchen: Electric oven; Range hood; Refrigerator; Dishwasher; Eat-in kitchen
- Bedrooms: Three bedrooms on the main level; Bedroom sizes include 12x10 and 11x9
- Bathrooms: Two full bathrooms; Primary bathroom has a full shower stall
- Heating & cooling: Forced air heating; Heat pump; Electric heating; Central air conditioning
- Interior features: Attic access; Cathedral ceilings; Eat-in kitchen; Water softener (owned); Smoke alarm
- Laundry & utility: Main-level laundry; Washer; Dryer; Electric water heater
Neighborhood map
What this means for you Summary
Snapshot
- This is a 3-bed/2.0-bath single-family listed at $270k.
Deal economics
- At list price, monthly cash flow is $-147 ($-2k/yr) — negative.
- To cash-flow at today's rent, offer at most $244k (9.6% below list).
- To meet the 1% rule (rent ≥ 1% of price), the offer needs to be $196k (27.3% below list).
- Recommended offer: $196k (27.3% below list) — sets the bar for 1% rule.
- Cap rate 5.6% vs local median 3.8% in Brownsburg — top-decile yield for the area; either an underpriced asset or a hidden risk that comps aren't pricing in. Stress-test before assuming the spread holds.
Location & tenants
- Location reads 75/100 on livability (#61 in IN, #4,105 nationally) — a middle-class / working-renter tenant base. Strengths: crime A+, employment A+, cost of living A+; Watch: amenities F, commute F, health & safety F.
- Brownsburg Community School Corporation (suburban): math 72% / reading 72% proficiency, ranked #2 of 301 in IN (top 1%) — strong family-tenant draw, lease renewals of 3-5y typical; only 17% free/reduced lunch — higher-income household profile.
- Zoned schools: Eagle Elementary School (math 84% / reading 75%, grade A, #8 of 994 statewide, top 1%, 586 students, 28% FRL); Brownsburg High School (math 61% / reading 83%, grade B+, #12 of 369 statewide, top 4%, 3,177 students, 33% FRL).
- Market conditions: Rents rising fast (+6.3%/yr); 328 active listings in the ZIP; 4 comparable units currently listed for rent nearby; rentals leasing fast (median 8d on market — plan ~1-2 weeks tenant-placement turnaround); high-income renter base; 1,294 units permitted in Hendricks County in 2024 (18 in 5+ unit buildings).
Forward outlook
- Local home prices are declining (-3.0%/yr); year-one equity from $2k of loan paydown is wiped out by about $8k of value loss. Plan a longer hold.
- Hendricks County population projected at +35% by 2050 — long-run rental-demand tailwind backs the buy-and-hold thesis.
Negotiation context
- Only 2 days on market — expect competitive offers; lowballing is unlikely to land.
- 2 sale attempts since 4y ago with the ask held roughly flat each time — persistent listings suggest the price (not the market) is what's stuck; bring a comps-based counter.
Questions for the listing agent
- What do current leases actually rent for vs. the listed asking? Can we see a recent rent roll and the last 12 months of T-12 income?
- What does the HOA fee cover, when was the last increase, and are there any pending special assessments or reserve-fund shortfalls?
- Is there a deadline driving the sale (1031 exchange, divorce, estate, relocation)? That informs how much negotiation room exists.
- Schools are A-rated — typically a magnet for longer-tenancy family renters. What's the average tenant stay here, and is there a school-zone premium baked into asking?
- The area grade is low — what's the realistic commute time and amenity access for the typical tenant pool here? Any planned neighborhood developments (good or bad) we should know about?
- What's the average days-on-market for RENTAL listings here right now (not sales)? A rising rental-DOM trend means longer vacancies and softer asking-rent achievability than the comps imply.
- What's the recent tenant-quality profile in this submarket — average credit score on applications, eviction rate, late-payment / NSF rate, and stable-employment percentage? A property-management company in the area should have these aggregated.
- How much new for-sale + rental construction is in the pipeline within 1–3 miles? Heavy new supply typically softens prices + rents 12–24 months out; constrained supply supports both.
Investment metrics
- 1% rule
- 0.73% ✗
- Cap rate
- 5.64%
- Cash-on-cash
- -2.33%
- DSCR
- 0.90
- GRM
- 11.5
CMA / ARV
- ARV (on-the-fly)
- $246,000
- Comps found
- 12
Show comp detail 12 sales within ~0.75 mi
| Address | Dist | Beds/Ba | Sqft | Sold | Price | $/sf | Match |
|---|---|---|---|---|---|---|---|
| 27 Lake Dr S | 0.02mi | 3/2.0 | 1,200 (0%) | 1mo | $240,000 | $200 | 98 |
| 6 Kristelli Ct | 0.17mi | 3/2.0 | 1,200 (0%) | 2mo | $270,000 | $225 | 90 |
| 2 Nash Ct | 0.12mi | 3/2.0 | 1,308 (+9%) | 4mo | $268,000 | $205 | 76 |
| 1493 Hideaway Cir | 0.25mi | 2/2.0 (-1) | 1,260 (+5%) | 1mo | $296,500 | $235 | 74 |
| 108 Prairie Pkwy | 0.52mi | 3/2.0 | 1,175 (-2%) | 0mo | $252,000 | $214 | 72 |
| 48 Picadilly Ct | 0.36mi | 3/1.5 | 1,274 (+6%) | 4mo | $230,000 | $181 | 67 |
| 6750 E County Road 425 N | 0.30mi | 3/2.0 | 1,360 (+13%) | 3mo | $300,000 | $221 | 61 |
| 14 James Ct | 0.67mi | 3/1.0 | 1,232 (+3%) | 3mo | $165,000 | $134 | 58 |
| 506 S Green St | 0.70mi | 3/1.0 | 1,264 (+5%) | 1mo | $245,000 | $194 | 53 |
| 308 Maplebrook Dr | 0.71mi | 3/1.5 | 1,275 (+6%) | 6mo | $234,000 | $184 | 49 |
| 505 Stephen Dr | 0.70mi | 3/2.0 | 1,096 (-9%) | 6mo | $237,000 | $216 | 48 |
| 541 S Alpha Ave | 0.67mi | 3/2.0 | 1,361 (+13%) | 0mo | $230,000 | $169 | 46 |
Match score weights: distance 35% · size 25% · config 20% · recency 20%. Top-matched comps best support the ARV.
Projected returns pro-forma
-3.0% appreciation · 6.31% rent growth · sell at horizon
- IRR
- -16.9%
- Equity multiple
- 0.39×
- Total profit
- $-46,394
- Equity at exit
- $40,243
- IRR
- -4.1%
- Equity multiple
- 0.69×
- Total profit
- $-23,070
- Equity at exit
- $23,336
Cash invested: $75,572 (down + closing). Projections, not guarantees.
Landlord ↔ Tenant lean methodology
- Overall (STATE)
- 90 Strongly Landlord-Friendly
- State Indiana
- 90 Strongly Landlord-Friendly · R+11
- County
- — inherits STATE
- City
- — inherits STATE
ZIP-level market 46112
- Rents YoY
- 6.3%
- Active inventory
- 328
- Price-to-rent
- 11.5×
Monthly cashflow live
- Estimated rent
- $1,962 medium interval (Pro) →
- Mortgage (P&I)
- −$1,415
- Tax from tax record
- −$150 /mo · $1,794/yr
- Insurance
- −$112
- HOA
- −$19
- Vacancy / Maint / Mgmt
- −$412
- Net cashflow
- $-147
Break-even live
UW: 25.0% down · 7.5% · 30yr · 1.5% tax · 5.0% vac · 8.0% maint · 8.0% mgmt
Financing live
Cash to close
- Down payment
- $67,475
- Closing costs
- $8,097
- Reserves months
- —
- Total cash needed
- —
Loan-product check · same deal, 3 products live
Conventional
25% down · 7.5% · 30yr
- Down + closing
- —
- Monthly P&I
- —
- Monthly cashflow
- —
- DSCR
- —
- Eligible?
- —
Personal DTI + credit; lowest rate.
DSCR
20% down · 8.5% · 30yr
- Down + closing
- —
- Monthly P&I
- —
- Monthly cashflow
- —
- DSCR
- —
- Eligible?
- —
No personal income docs; deal must DSCR.
Hard money
10% down · 12.0% · 12mo
- Down + closing
- —
- Monthly P&I
- —
- Monthly cashflow
- —
- DSCR
- —
- Eligible?
- —
Short-term bridge; refi at stabilization.
Rent comps 4 comps
| Address | Beds | Baths | Sqft | Rent | $/sqft | DOM | Units | Dist |
|---|---|---|---|---|---|---|---|---|
| 28 Parkwood Dr Brownsburg, IN | 3.0 | 2.0 | 1422 | $1,760 | $1.24 | 17d | 1 | 1.09mi |
| 4155 N County Road 575 E Brownsburg, IN | 2.0 | 1.0 | 783 | $1,100 | $1.40 | 1d | 1 | 1.32mi |
| 2860 Hayward Ave Brownsburg, IN | 2.0 | 2.0 | 1457 | $2,212 | $1.52 | 1d | 6 | 1.40mi |
| 102 Murphy Ln Brownsburg, IN | 3.0 | 1.5 | 1248 | $1,775 | $1.42 | 7d | 1 | 1.44mi |
HOA detail
- Monthly dues
- $19 · $228/yr
- Likely covers
- water
Listing history 2 events
-
2026-06-07remarks 699-char remark
-
2026-06-07$269,900 Pending 2 DOM
ⓘ Source: listings_history table (triggers on properties + properties_extension) + one-shot
backfill from property_details.listing_events for pre-trigger history.
Tax reassessment forecast IN · Partial reset (capped growth)
- Current annual tax
- $1,794 · $150/mo
- Projected year-2 tax
- $2,044 · $170/mo
- Expected delta
- +$250/yr (+$21/mo · 13.9%)
ⓘ Screening estimate from a state-policy table — verify with the county assessor before closing.
Climate risk First Street
- Flood 1/10 Low FEMA zone X (unshaded) · 0% chance over 30 yrs
- Wildfire 1/10 Low
- Heat 3/10 Moderate 7 d/yr ≥100°F today · 19 d/yr by 30 yrs out
- Wind 2/10 Low 0% chance of damaging wind over 30 yrs
- Air quality 2/10 Low 1 unhealthy d/yr today · 2 by 30 yrs out
Nearby sold comps map
Loading sold comps map…
Walkable amenities ~0.75 mi
Loading nearby amenities…
Taxation est. · year 1
- Rental income
- $23,541
- − Mortgage interest
- −$15,119
- − Property taxes
- −$1,794
- − Insurance
- −$1,350
- − Repairs & maintenance
- −$1,883
- − Management
- −$1,883
- − HOA
- −$228
- − Depreciation
- −$7,852
- Taxable loss
- −$6,567
- Est. tax savings @ 24.0%
- +$1,576
- After-tax cash flow
- $-183/yr
For passive investors: Depreciation is non-cash, so a rental often shows a tax loss while cash-flowing — sheltering income. Rental losses are passive: they offset passive income freely, and up to $25,000/yr can offset ordinary (W-2) income if you actively participate and your MAGI is under $100k (phasing out to $0 by $150k); unused losses carry forward. On sale, claimed depreciation is recaptured at up to 25%, and gains may owe capital-gains tax (a 1031 exchange can defer both). Figures are a year-1 estimate at your 24.0% rate — not tax advice; consult a CPA.
Schools (NCES district)
- District
- Brownsburg Community School Corporation
- NCES district ID
- 1801020
- Math proficiency
- 72% ▼ -5.00%
- Reading proficiency
- 72% ▼ -4.00%
- Median HH income
- $75,304
- Composite
- 63.45/100
- National rank
- #616
- State rank
- #2 of 301 in IN
Livability — Brownsburg
- Score
- 75/100
- State rank
- #61
- US rank
- #4105
Category grades
Schools grade is shown separately in the Schools card above.
Census & demographics
- Census place
- Brownsburg, IN
- County
- Hendricks County · 143,373 people
- City population
- 44,220
- Metro
- Indianapolis-Carmel-Anderson, IN
- Population (ZIP)
- 44,220
- Household income
- $112,565
- Rent vs Own
- Severe rent burden
- 614.0
Population outlook (Hendricks County) Hauer SSP2
- Today (2025)
- 187,418 people
- By 2030
- 201,494 · +7.5%
- By 2040
- 228,487 · +21.9%
- By 2050
- 253,068 · +35.0%
- By 2075
- 308,920 · +64.8%
- By 2100
- 336,510 · +79.6%
Race, ethnicity, and origin ACS 2023
- Neighborhood character
- Predominantly White (83%)
- Race & ethnicity
- White 83% Black 10% Two or more races 4% Hispanic / Latino 4%
- Common ancestry
- Slovak 3% Iranian 2% Romanian 2%
- Foreign-born
- 6% · Canada, China
- Languages at home
- 93% English-only · Spanish 2% French/Haitian/Cajun 1%
Political lean MEDSL · Hendricks
- 2024 margin
- Strong R (+21.5) · D 38.4% · R 59.9% · Other 1.7%
- 2008→2024 swing
- +1.9pp toward D · 2008: -23.4pp · 2024: -21.5pp
- All cycles
- 2024: R+21.5 2020: R+23.9 2016: R+34.2 2012: R+34.9 2008: R+23.4
Not yet ingested
- Civics
- —
Market trends
- HPI YoY
- ▼ -135.99%
- Current HPI
- 217.3787
- Rent YoY
- ▲ 6.31%
- Metro
- Indianapolis-Carmel-Anderson, IN
- State GDP YoY
- ▲ 2.90%
- F500 in state
- 18
Industry mix (Fortune 500 HQ in IN)
| Industry | F500 HQs | Revenue |
|---|---|---|
| Industrial Machinery | 2 | $37B |
|
||
| Healthcare | 1 | $177B |
|
||
| Pharmaceuticals | 1 | $45B |
|
||
| Metals / Steel | 1 | $18B |
|
||
| Agriculture | 1 | $17B |
|
||
| Packaging | 1 | $12B |
|
||
Price history
+12.5% since first listed5 events — show timeline
- 2026-06-06 Pending — MIBOR as Distributed by MLS Grid
- 2026-06-04 Listed $269,900 MIBOR as Distributed by MLS Grid
- 2022-10-07 Sold (MLS) $234,900 MIBOR as Distributed by MLS Grid
- 2022-09-16 Pending — MIBOR as Distributed by MLS Grid
- 2022-09-12 Listed $239,900 MIBOR as Distributed by MLS Grid
Property tax history
+8.7%/yrLatest (2025): $1,794 · +10.1% YoY. Source: county tax records.
Cash-flow waterfall
monthlySold comps — $/sqft
last 12 mo · ≤1 miLoading sold comps…