 Multi-family
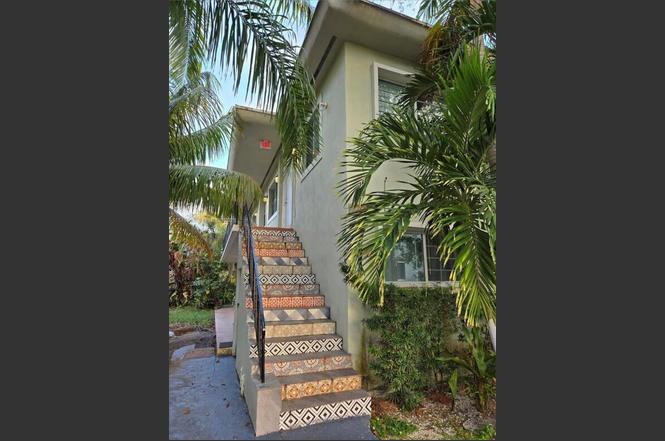
7025 Rue Granville · Miami Beach, FL
Flood risk 9/10 · Severe
- FEMA flood zone
- AE
- Chance of flooding over 30 yrs
- 0.99%
- Est. flood insurance / yr
- $1,737 – $8,500
Fire risk 1/10 · Minimal
- Est. fire insurance / yr
- $947 – $1,759
Heat risk 10/10 · Severe
- Hot days now (above 101°F)
- 7 days/yr
- Hot days in 30 yrs
- 29 days/yr
Wind risk 10/10 · Severe
- Chance of severe wind over 30 yrs
- 99.0%
Air-quality risk 2/10 · Minimal
- Unhealthy air days now
- 1 days/yr
- Unhealthy air days in 30 yrs
- 2 days/yr
Risk factors via First Street. Map © Google.
Why this score? — see what drove the F grade
The composite is a weighted blend of 9 inputs, each scored 0–100. Each bar is that input's sub-score; the figure is the points it added to the 100-point composite (weight × sub-score).
- ARV discount +7.5/15.0
- Schools +4.2/10.0
- Livability +4.0/5.0
- Rent growth +2.6/5.0
- Condition / age +2.5/5.0
- Cash flow +1.2/30.0
- 1% rule +0.0/10.0
- DSCR +0.0/10.0
- Appreciation +0.0/10.0
$1,765,000
🖨 Deal sheet 📄 Offer letter ✓ Due diligence
Multi-family units
County records classify this as Multi-Family (2-4 Unit). Listing-text estimate: 1 unit. estimate disagrees with records
Listing remarks MLS
WOW!!! THIS IS A DEAL OF A LIFETIME. A 2 STORY FOUR-PLEX IN THE HEART OF MIAMI BEACH FOR AN UNBELIEVABLE PRICE! ALL 4 UNITS ARE 2/2 & ABOUT 885 SQ/FT. BLDG NEEDS TLC & HAS UNBELIEVABLE POTENTIAL FOR A REAL GEM! GREAT OPPORTUNITY FOR A CONDO CONVERSION OR L EAVE AS RENTAL INCOME. THE CITY OF MIAMI BEACH JUST FINISHED PUTTING THE FINAL TOUCHES ON THE BEAUTIFUL COMMUNITY POOL, BASKETBALL COURTS, & CHILDREN'S PLAYGROUND LOCATED DIRECTLY BEHIND THE PROPERTY. THE BEACH IS JUST MINS AWAY. VERY EASY TO SEE!
Key facts
- In-unit laundry
- Private garden space
- Pvc plumbing
Tags
Property features AI
Finance
- Financial info: 4 total units; Tenants pay common area maintenance, electricity, sewer, and water
- HOA & community: No association amenities
Exterior
- Utilities: Public sewer; Sewer available
- Home design: Quadruplex; Resale property
- Construction: CBS construction; Other roof
- Exterior features: Not waterfront; No waterfront features
Interior
- Flooring: Other flooring
- Bathrooms: 8 total bathrooms
- Heating & cooling: Central heating; Central air conditioning
- Interior features: Other flooring
Neighborhood map
What this means for you Summary
Snapshot
- This is a 10-bed/8.0-bath multifamily listed at $1.76M.
Deal economics
- At list price, monthly cash flow is $-8k ($-91k/yr) — negative.
- To cash-flow at today's rent, offer at most $428k (75.8% below list).
- To meet the 1% rule (rent ≥ 1% of price), the offer needs to be $540k (69.4% below list).
- Recommended offer: $428k (75.8% below list) — sets the bar for cash-flow.
Location & tenants
- Location reads 80/100 on livability (#108 in FL, #1,672 nationally) — a professional / high-income tenant draw. Strengths: crime A+, commute A+, health & safety A+; Watch: housing C-, amenities D-, cost of living F.
- Miami-Dade (suburban): math 45% / reading 54% proficiency, ranked #40 of 73 in FL (top 55%) — families likely to look elsewhere, expect single-tenant / working-renter base with shorter leases; 64% free/reduced lunch — lower-income household profile, screen leases tightly.
- Market conditions: Rents flat; 644 active listings in the ZIP; 10,051 units permitted in Miami-Dade County in 2024 (7,758 in 5+ unit buildings).
- At $5,396/mo this rent would consume 94% of the median local household income ($69k/yr) (locally 3521% of renters already pay >50% of income on rent) — very limited rent-growth headroom before tenants either downsize or default.
Forward outlook
- Local home prices are declining (-3.0%/yr); year-one equity from $12k of loan paydown is wiped out by about $53k of value loss. Plan a longer hold.
- Miami-Dade County population projected at +28% by 2050 — long-run rental-demand tailwind backs the buy-and-hold thesis.
Negotiation context
- It's been on market 147 days — a 12% lower offer ($1.55M) is reasonable based on typical stale-listing flexibility.
- 3 sale attempts with the ask held roughly flat each time — persistent listings suggest the price (not the market) is what's stuck; bring a comps-based counter.
- Current owner paid $460k; list at $1.76M implies a 284% gain — meaningful room to come down on a strong offer.
Risks & watch-outs
- Watch-outs: flood insurance adds $427/mo; built in 1955 — expect roof / HVAC / electrical / plumbing capex.
- Climate carrying-cost: in FEMA flood zone AE (mandatory federal flood insurance); severe wind risk, 99% chance of damaging wind over 30y; extreme-heat days projected 7→29/yr by 2055 (HVAC capex compounding) — expect insurance premiums to compound above CPI over the hold.
Questions for the listing agent
- What do current leases actually rent for vs. the listed asking? Can we see a recent rent roll and the last 12 months of T-12 income?
- It's been on market 147 days. Have you received any prior offers? Is the seller open to a 76% concession, seller financing, or rate buy-down credit?
- Built in 1955 — when were the roof, HVAC, electrical panel, plumbing, and water heater last replaced?
- What's the actual annual flood-insurance premium (NFIP or private), and is the property in a SFHA with mandatory coverage?
- Why hasn't it sold? Are there any deal-killer items the seller is aware of (foundation, flood, title, zoning, code violations)?
- Is there a deadline driving the sale (1031 exchange, divorce, estate, relocation)? That informs how much negotiation room exists.
- Schools are A-rated — typically a magnet for longer-tenancy family renters. What's the average tenant stay here, and is there a school-zone premium baked into asking?
- The area grade is low — what's the realistic commute time and amenity access for the typical tenant pool here? Any planned neighborhood developments (good or bad) we should know about?
- What's the average days-on-market for RENTAL listings here right now (not sales)? A rising rental-DOM trend means longer vacancies and softer asking-rent achievability than the comps imply.
- What's the recent tenant-quality profile in this submarket — average credit score on applications, eviction rate, late-payment / NSF rate, and stable-employment percentage? A property-management company in the area should have these aggregated.
- How much new apartment / multifamily construction is in the pipeline within 1–3 miles? Heavy new supply (>2% of stock underway) typically softens rents 12–24 months out; light construction supports rent growth.
Investment metrics
- 1% rule
- 0.31% ✗
- Cap rate
- 1.44%
- Cash-on-cash
- -17.34%
- DSCR
- 0.23
- GRM
- 27.3
CMA / ARV
No comps found within radius.
Projected returns pro-forma
-3.0% appreciation · 0.44% rent growth · sell at horizon
- IRR
- -55.6%
- Equity multiple
- -0.58×
- Total profit
- $-781,761
- Equity at exit
- $263,167
- IRR
- —
- Equity multiple
- -1.74×
- Total profit
- $-1,354,888
- Equity at exit
- $152,605
Cash invested: $494,200 (down + closing). Projections, not guarantees.
Landlord ↔ Tenant lean methodology
- Overall (STATE)
- 87 Strongly Landlord-Friendly
- State Florida
- 87 Strongly Landlord-Friendly · R+3
- County
- — inherits STATE
- City
- — inherits STATE
ZIP-level market 33141
- Rents YoY
- 0.4%
- Active inventory
- 644
- Price-to-rent
- 27.3×
Monthly cashflow live
- Estimated rent
- $5,396 medium interval (Pro) →
- Mortgage (P&I)
- −$9,256
- Tax from tax record
- −$1,414 /mo · $16,966/yr
- Insurance
- −$735
- Flood insurance flood zone
- −$427 /mo · $5,118/yr
- HOA
- −$0
- Vacancy / Maint / Mgmt
- −$1,133
- Net cashflow
- $-7,569
Break-even live
UW: 25.0% down · 7.5% · 30yr · 1.5% tax · 5.0% vac · 8.0% maint · 8.0% mgmt
Financing live
Cash to close
- Down payment
- $441,250
- Closing costs
- $52,950
- Reserves months
- —
- Total cash needed
- —
Loan-product check · same deal, 3 products live
Conventional
25% down · 7.5% · 30yr
- Down + closing
- —
- Monthly P&I
- —
- Monthly cashflow
- —
- DSCR
- —
- Eligible?
- —
Personal DTI + credit; lowest rate.
DSCR
20% down · 8.5% · 30yr
- Down + closing
- —
- Monthly P&I
- —
- Monthly cashflow
- —
- DSCR
- —
- Eligible?
- —
No personal income docs; deal must DSCR.
Hard money
10% down · 12.0% · 12mo
- Down + closing
- —
- Monthly P&I
- —
- Monthly cashflow
- —
- DSCR
- —
- Eligible?
- —
Short-term bridge; refi at stabilization.
Listing history 26 events
-
2026-06-18days on market $1,765,000 Active 147 DOM
-
2026-06-17days on market $1,765,000 Active 146 DOM
-
2026-06-16days on market $1,765,000 Active 145 DOM
-
2026-06-15days on market $1,765,000 Active 144 DOM
-
2026-06-13days on market $1,765,000 Active 142 DOM
-
2026-06-09days on market $1,765,000 Active 138 DOM
-
2026-06-08days on market $1,765,000 Active 137 DOM
-
2026-06-07days on market $1,765,000 Active 136 DOM
-
2026-06-04days on market $1,765,000 Active 133 DOM
-
2026-06-03days on market $1,765,000 Active 132 DOM
-
2026-06-02days on market $1,765,000 Active 131 DOM
-
2026-06-01days on market $1,765,000 Active 130 DOM
-
2026-05-31days on market $1,765,000 Active 129 DOM
-
2026-04-02historical
-
2026-01-22$1,765,000 Active
-
2025-08-19status Active
-
2025-04-14historical
-
2025-02-13$1,765,000 Active
-
2009-01-23soldstatus $460,000
-
2007-04-12soldstatus $450,000 521-char remark
Show marketing remark (521 chars)
WOW!!! THIS IS A DEAL OF A LIFETIME. A 2 STORY FOUR-PLEX IN THE HEART OF MIAMI BEACH FOR AN UNBELIEVABLE PRICE! ALL 4 UNITS ARE 2/2 & ABOUT 885 SQ/FT. BLDG NEEDS TLC & HAS UNBELIEVABLE POTENTIAL FOR A REAL GEM! GREAT OPPORTUNITY FOR A CONDO CONVERSION OR L EAVE AS RENTAL INCOME. THE CITY OF MIAMI BEACH JUST FINISHED PUTTING THE FINAL TOUCHES ON THE BEAUTIFUL COMMUNITY POOL, BASKETBALL COURTS, & CHILDREN'S PLAYGROUND LOCATED DIRECTLY BEHIND THE PROPERTY. THE BEACH IS JUST MINS AWAY. VERY EASY TO SEE!
-
2002-02-15soldstatus $315,000
-
2001-10-16soldstatus $240,000
-
1997-11-20soldstatus $240,000
-
1996-07-19soldstatus $180,000
-
1992-12-16soldstatus $115,000
-
1990-02-27soldstatus $137,000
ⓘ Source: listings_history table (triggers on properties + properties_extension) + one-shot
backfill from property_details.listing_events for pre-trigger history.
Tax reassessment forecast FL · Resets to sale price
- Current annual tax
- $16,966 · $1,414/mo
- Projected year-2 tax
- $16,966 · $1,414/mo
- Expected delta
- $0/yr ($0/mo · 0.0%)
ⓘ Screening estimate from a state-policy table — verify with the county assessor before closing.
Climate risk First Street
- Flood 9/10 Extreme FEMA zone AE · 99% chance over 30 yrs
- Wildfire 1/10 Low
- Heat 10/10 Extreme 7 d/yr ≥101°F today · 29 d/yr by 30 yrs out
- Wind 10/10 Extreme 99% chance of damaging wind over 30 yrs
- Air quality 2/10 Low 1 unhealthy d/yr today · 2 by 30 yrs out
Nearby sold comps map
Loading sold comps map…
Walkable amenities ~0.75 mi
Loading nearby amenities…
Taxation est. · year 1
- Rental income
- $64,752
- − Mortgage interest
- −$98,867
- − Property taxes
- −$16,966
- − Insurance
- −$13,944
- − Repairs & maintenance
- −$5,180
- − Management
- −$5,180
- − Depreciation
- −$51,345
- Taxable loss
- −$126,730
- Est. tax savings @ 24.0%
- +$30,415
- After-tax cash flow
- $-60,410/yr
For passive investors: Depreciation is non-cash, so a rental often shows a tax loss while cash-flowing — sheltering income. Rental losses are passive: they offset passive income freely, and up to $25,000/yr can offset ordinary (W-2) income if you actively participate and your MAGI is under $100k (phasing out to $0 by $150k); unused losses carry forward. On sale, claimed depreciation is recaptured at up to 25%, and gains may owe capital-gains tax (a 1031 exchange can defer both). Figures are a year-1 estimate at your 24.0% rate — not tax advice; consult a CPA.
Schools (NCES district)
- District
- Miami-Dade
- NCES district ID
- 1200390
- Math proficiency
- 45% ▼ -16.00%
- Reading proficiency
- 54% ▼ -5.00%
- Median HH income
- $43,928
- Composite
- 41.76/100
- National rank
- #3397
- State rank
- #40 of 73 in FL
Livability — Miami Beach
- Score
- 80/100
- State rank
- #108
- US rank
- #1672
Category grades
Schools grade is shown separately in the Schools card above.
Census & demographics
- Census place
- Miami Beach, FL
- County
- Miami-Dade County · 2,697,751 people
- City population
- 90,533
- Metro
- Miami-Fort Lauderdale-Pompano Beach, FL
- Population (ZIP)
- 36,438
- Household income
- $68,738
- Rent vs Own
- Severe rent burden
- 3521.0
Population outlook (Miami-Dade County) Hauer SSP2
- Today (2025)
- 3,126,439 people
- By 2030
- 3,325,765 · +6.4%
- By 2040
- 3,697,561 · +18.3%
- By 2050
- 4,012,134 · +28.3%
- By 2075
- 4,605,612 · +47.3%
- By 2100
- 4,866,598 · +55.7%
Race, ethnicity, and origin ACS 2023
- Neighborhood character
- Predominantly Hispanic (67%)
- Race & ethnicity
- Hispanic / Latino 67% Two or more races 36% White 20% Black 4% Asian 3%
- Hispanic origin (detail)
- Mexican 1% Puerto Rican 3% Cuban 27% Salvadoran 6%
- Common ancestry
- Scotch-Irish 2% Romanian 2% Armenian 1%
- Foreign-born
- 62% · Canada, Jamaica, Dominican Republic
- Languages at home
- 18% English-only · Spanish 69% Other Indo-European 4% French/Haitian/Cajun 3%
Political lean MEDSL · Miami-Dade
- 2024 margin
- R (+11.4) · D 43.9% · R 55.4%
- 2008→2024 swing
- -27.6pp toward R · 2008: 16.1pp · 2024: -11.4pp
- All cycles
- 2024: R+11.4 2020: D+7.3 2016: D+29.6 2012: D+23.7 2008: D+16.1
Not yet ingested
- Civics
- —
Market trends
- HPI YoY
- ▼ -472.71%
- Current HPI
- 336.7298
- Rent YoY
- ▲ 0.44%
- Metro
- Miami-Fort Lauderdale-Pompano Beach, FL
- State GDP YoY
- ▲ 3.28%
- F500 in state
- 36
Industry mix (Fortune 500 HQ in FL)
| Industry | F500 HQs | Revenue |
|---|---|---|
| Industrial Technology | 2 | $29B |
|
||
| Insurance | 2 | $17B |
|
||
| Retail | 1 | $60B |
|
||
| Technology Distribution | 1 | $58B |
|
||
| Homebuilding | 1 | $35B |
|
||
| Technology Manufacturing | 1 | $35B |
|
||
Price history
+1188.3% since first listed13 events — show timeline
- 2026-04-02 Listing Removed — MARMLS
- 2026-01-22 Listed $1,765,000 Beaches MLS
- 2025-08-19 Relisted — MARMLS
- 2025-04-14 Listing Removed — MARMLS
- 2025-02-13 Listed $1,765,000 MARMLS
- 2009-01-23 Sold (Public Records) $460,000 Public Records
- 2007-04-12 Sold (MLS) $450,000 MARMLS
- 2002-02-15 Sold (Public Records) $315,000 Public Records
- 2001-10-16 Sold (Public Records) $240,000 Public Records
- 1997-11-20 Sold (Public Records) $240,000 Public Records
- 1996-07-19 Sold (Public Records) $180,000 Public Records
- 1992-12-16 Sold (Public Records) $115,000 Public Records
- 1990-02-27 Sold (Public Records) $137,000 Public Records
Property tax history
+8.4%/yrLatest (2025): $16,966 · +9.4% YoY. Source: county tax records.
Cash-flow waterfall
monthlySold comps — $/sqft
last 12 mo · ≤1 miLoading sold comps…