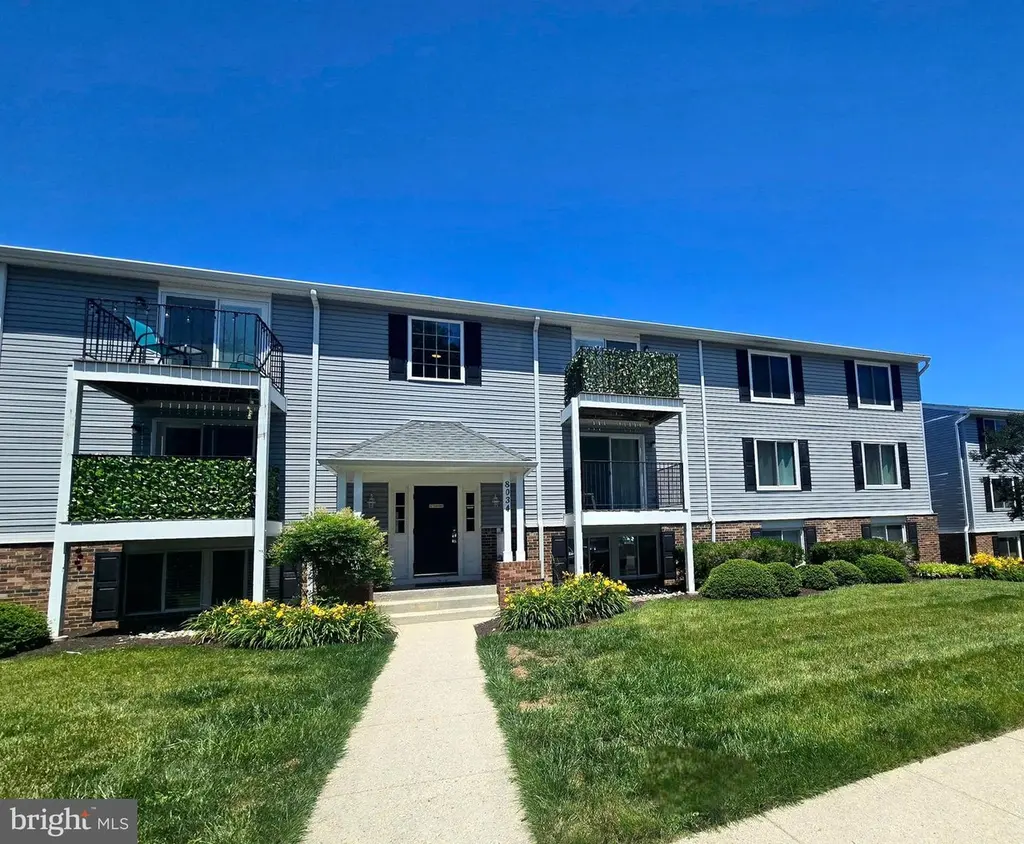
8034-F Abbey Ct Unit F · Lake Shore, MD
Flood risk 1/10 · Minimal
- FEMA flood zone
- X (unshaded)
- Chance of flooding over 30 yrs
- 0.0%
- Est. flood insurance / yr
- $473 – $860
Fire risk 1/10 · Minimal
- Est. fire insurance / yr
- $755 – $1,403
Heat risk 8/10 · Major
- Hot days now (above 103°F)
- 7 days/yr
- Hot days in 30 yrs
- 15 days/yr
Wind risk 6/10 · Moderate
- Chance of severe wind over 30 yrs
- 58.0%
Air-quality risk 3/10 · Minor
- Unhealthy air days now
- 2 days/yr
- Unhealthy air days in 30 yrs
- 3 days/yr
Risk factors via First Street. Map © Google.
Why this score? — see what drove the D- grade
The composite is a weighted blend of 9 inputs, each scored 0–100. Each bar is that input's sub-score; the figure is the points it added to the 100-point composite (weight × sub-score).
- Cash flow +13.0/30.0
- ARV discount +7.5/15.0
- 1% rule +4.5/10.0
- DSCR +3.9/10.0
- Livability +3.0/5.0
- Schools +2.9/10.0
- Rent growth +2.7/5.0
- Condition / age +2.5/5.0
- Appreciation +0.0/10.0
$230,000
🖨 Deal sheet 📄 Offer letter ✓ Due diligence
Listing remarks MLS
* * * * CUTE, CLEAN 2ND LEVEL CONDO IN CHESTERFIElD * * * * Unit is in good shape, has flow from kitchen to living/dining area and shows well! Great opportunity to own in Pasadena with reasonalble condo fees! See this one as soon as you can--won't last very long!! Seller providing buyer with 1 year AHS HOME WARRANTY !!! QUICK SETTLEMENT NOT A SHORT SALE!!!
Key facts
- $274 HOA
- Community pool
- Built 1987
Property features AI
Finance
- Other: Property manager present; Pets allowed with number limits; Ground rent paid annually
- HOA & community: Monthly condo fee of $274; Professional off-site management; Condo fee includes exterior building maintenance, insurance, pool(s), snow removal, management, common area maintenance, sewer, trash, water, and lawn care/maintenance; Community amenities include pool, tennis courts, playgrounds, sports fields/courts, picnic areas, and community center
Exterior
- Parking: Parking lot with paved, lighted spaces; Unassigned parking in general common elements
- Utilities: Public water; Public sewer; Electric service (electric heating, cooling, and hot water); Cable TV available; Phone available; Internet options: broadband, cable, fiber optic
- Home design: Condominium unit (Unit/Flat); Garden-style building (1–4 floors); Three total stories in building; Entry on second floor; Unit spans three floors; Building faces suburban setting
- Construction: Combination of brick and vinyl siding; Built with above-grade and below-grade structures; Double-hung, energy-efficient, insulated replacement windows with screens
- Exterior features: Deck(s); Backs to open common area; Community pool (in-ground concrete, lap/exercise); Common grounds and outdoor recreation facilities
Interior
- Kitchen: Dishwasher; Disposal; Electric oven/range; Refrigerator; Upgraded countertops; Exhaust fan
- Bedrooms: Two bedrooms on the main level
- Flooring: Ceramic tile; Carpet; Luxury vinyl plank
- Bathrooms: One full bathroom on the main level
- Heating & cooling: Heat pump heating and cooling (electric)
- Interior features: Breakfast area; Window treatments; Traditional and open floor plan elements; Tub with shower; Built-ins; Ceiling fans; Pantry; Walk-in closet(s); Upgraded countertops; Entry-level bedroom
- Laundry & utility: Washer and dryer in unit; Washer and dryer included; Electric water heater
Neighborhood map
What this means for you Summary
Snapshot
- This is a 2-bed/1.0-bath condo listed at $230k.
Deal economics
- At list price, monthly cash flow is $-13 ($-155/yr) — negative.
- To cash-flow at today's rent, offer at most $228k (1.0% below list).
- To meet the 1% rule (rent ≥ 1% of price), the offer needs to be $219k (4.7% below list).
- Recommended offer: $219k (4.7% below list) — sets the bar for 1% rule.
- Cap rate 6.2% vs local median 2.8% in Lake Shore — top-decile yield for the area; either an underpriced asset or a hidden risk that comps aren't pricing in. Stress-test before assuming the spread holds.
Location & tenants
- Location reads 59/100 on livability (#378 in MD) — a working-class tenant base; expect higher turnover. Strengths: employment A+, housing A+; Watch: amenities F, commute F, cost of living F.
- Anne Arundel County Public Schools (suburban): math 20% / reading 37% proficiency, ranked #10 of 24 in MD (top 42%) — low school quality limits family demand, transient renter base, plan for 1-2y turnover.
- Zoned schools: Chesapeake Bay Middle (math 15% / reading 42%, grade F, #74 of 225 statewide, top 33%, 1,067 students, 26% FRL); Chesapeake High (math 50% / reading 71%, grade C+, #71 of 222 statewide, top 32%, 1,419 students, 23% FRL) — zoned schools at 25% FRL track the district average.
- Zoned-school proficiency averages 44% at this address vs 28% district-wide (+16 pts) — the actual schools serving this property are materially stronger than the Anne Arundel County Public Schools average implies; a family-tenant draw the district grade alone would hide.
- Market conditions: Rents flat; 254 active listings in the ZIP; 6 comparable units currently listed for rent nearby; rentals at typical pace (median 18d on market — plan ~3-4 weeks tenant-placement turnaround); high-income renter base; 1,303 units permitted in Anne Arundel County in 2024 (299 in 5+ unit buildings).
Forward outlook
- Local home prices are declining (-3.0%/yr); year-one equity from $2k of loan paydown is wiped out by about $7k of value loss. Plan a longer hold.
- Anne Arundel County population projected at +17% by 2050 — long-run rental-demand tailwind backs the buy-and-hold thesis.
Negotiation context
- Only 8 days on market — expect competitive offers; lowballing is unlikely to land.
- 4 sale attempts since 14y ago; this cycle's ask is 107% above the opening price — seller raised mid-cycle; expect resistance to lowballs.
- Current owner paid $142k; list at $230k implies a 62% gain — meaningful room to come down on a strong offer.
Risks & watch-outs
- Climate carrying-cost: major wind risk, 58% chance of damaging wind over 30y; extreme-heat days projected 7→15/yr by 2055 (HVAC capex compounding) — expect insurance premiums to compound above CPI over the hold.
Questions for the listing agent
- What do current leases actually rent for vs. the listed asking? Can we see a recent rent roll and the last 12 months of T-12 income?
- What does the HOA fee cover, when was the last increase, and are there any pending special assessments or reserve-fund shortfalls?
- Any open or pending special assessments — roof, HVAC, plumbing, elevator, façade? What's the per-unit balance and payoff schedule, and is the seller paying it off at close or rolling it to the buyer?
- Is there a deadline driving the sale (1031 exchange, divorce, estate, relocation)? That informs how much negotiation room exists.
- Schools are D-rated, which usually means shorter tenancies and higher turnover. Who's the typical renter profile here, and what's been the actual vacancy rate?
- The area grade is low — what's the realistic commute time and amenity access for the typical tenant pool here? Any planned neighborhood developments (good or bad) we should know about?
- What's the average days-on-market for RENTAL listings here right now (not sales)? A rising rental-DOM trend means longer vacancies and softer asking-rent achievability than the comps imply.
- What's the recent tenant-quality profile in this submarket — average credit score on applications, eviction rate, late-payment / NSF rate, and stable-employment percentage? A property-management company in the area should have these aggregated.
- How much new apartment / multifamily construction is in the pipeline within 1–3 miles? Heavy new supply (>2% of stock underway) typically softens rents 12–24 months out; light construction supports rent growth.
Investment metrics
- 1% rule
- 0.95% ✗
- Cap rate
- 6.23%
- Cash-on-cash
- -0.24%
- DSCR
- 0.99
- GRM
- 8.7
CMA / ARV
No comps found within radius.
Projected returns pro-forma
-3.0% appreciation · 0.76% rent growth · sell at horizon
- IRR
- -19.4%
- Equity multiple
- 0.34×
- Total profit
- $-42,794
- Equity at exit
- $34,294
- IRR
- -18.2%
- Equity multiple
- 0.12×
- Total profit
- $-56,752
- Equity at exit
- $19,886
Cash invested: $64,400 (down + closing). Projections, not guarantees.
Landlord ↔ Tenant lean methodology
- Overall (STATE)
- 27 Tenant-Leaning
- State Maryland
- 27 Tenant-Leaning · D+14
- County
- — inherits STATE
- City
- — inherits STATE
ZIP-level market 21122
- Rents YoY
- 0.8%
- Active inventory
- 254
- Price-to-rent
- 8.7×
Monthly cashflow live
- Estimated rent
- $2,191 high interval (Pro) →
- Mortgage (P&I)
- −$1,206
- Tax from tax record
- −$168 /mo · $2,013/yr
- Insurance
- −$96
- HOA
- −$274
- Vacancy / Maint / Mgmt
- −$460
- Net cashflow
- $-13
Break-even live
UW: 25.0% down · 7.5% · 30yr · 1.5% tax · 5.0% vac · 8.0% maint · 8.0% mgmt
Financing live
Cash to close
- Down payment
- $57,500
- Closing costs
- $6,900
- Reserves months
- —
- Total cash needed
- —
Loan-product check · same deal, 3 products live
Conventional
25% down · 7.5% · 30yr
- Down + closing
- —
- Monthly P&I
- —
- Monthly cashflow
- —
- DSCR
- —
- Eligible?
- —
Personal DTI + credit; lowest rate.
DSCR
20% down · 8.5% · 30yr
- Down + closing
- —
- Monthly P&I
- —
- Monthly cashflow
- —
- DSCR
- —
- Eligible?
- —
No personal income docs; deal must DSCR.
Hard money
10% down · 12.0% · 12mo
- Down + closing
- —
- Monthly P&I
- —
- Monthly cashflow
- —
- DSCR
- —
- Eligible?
- —
Short-term bridge; refi at stabilization.
Rent comps 6 comps
| Address | Beds | Baths | Sqft | Rent | $/sqft | DOM | Units | Dist |
|---|---|---|---|---|---|---|---|---|
| 8036 Abbey Ct Unit J Pasadena, MD | 2.0 | 1.0 | 924 | $1,850 | $2.00 | 11d | 1 | 0.01mi |
| 3581 Brickwall Ln Pasadena, MD | 3.0 | 1.0 | 1060 | $2,200 | $2.08 | 5d | 1 | 0.20mi |
| 3630 Saltwood Gln Pasadena, MD | 2.0 | 2.0 | 960 | $2,339 | $2.44 | 3d | 1 | 0.30mi |
| 932 12th St Pasadena, MD | 3.0 | 2.5 | 1100 | $2,750 | $2.50 | 43d | 1 | 0.92mi |
| 7810 East Rd Pasadena, MD | 2.0 | 2.0 | 832 | $2,500 | $3.00 | 43d | 1 | 1.06mi |
| 7663 Cedar Dr Pasadena, MD | 1.0 | 1.0 | 1100 | $1,200 | $1.09 | 18d | 1 | 1.45mi |
HOA detail condo
- Monthly dues
- $274 · $3,288/yr
- Assessments
- None detected in remarks — confirm with the listing agent.
Listing history 7 events
-
2026-06-18days on market $230,000 Active 8 DOM
-
2026-06-17days on market $230,000 Active 7 DOM
-
2026-06-16days on market $230,000 Active 6 DOM
-
2026-06-15days on market $230,000 Active 5 DOM
-
2026-06-13statusdays on market $230,000 Active 3 DOM
-
2026-06-09remarks 699-char remark
-
2026-06-09$230,000 Coming Soon 1 DOM
ⓘ Source: listings_history table (triggers on properties + properties_extension) + one-shot
backfill from property_details.listing_events for pre-trigger history.
Tax reassessment forecast MD · Partial reset (capped growth)
- Current annual tax
- $2,013 · $168/mo
- Projected year-2 tax
- $2,260 · $188/mo
- Expected delta
- +$247/yr (+$21/mo · 12.3%)
ⓘ Screening estimate from a state-policy table — verify with the county assessor before closing.
Climate risk First Street
- Flood 1/10 Low FEMA zone X (unshaded) · 0% chance over 30 yrs
- Wildfire 1/10 Low
- Heat 8/10 Severe 7 d/yr ≥103°F today · 15 d/yr by 30 yrs out
- Wind 6/10 Major 58% chance of damaging wind over 30 yrs
- Air quality 3/10 Moderate 2 unhealthy d/yr today · 3 by 30 yrs out
Nearby sold comps map
Loading sold comps map…
Walkable amenities ~0.75 mi
Loading nearby amenities…
Taxation est. · year 1
- Rental income
- $26,291
- − Mortgage interest
- −$12,884
- − Property taxes
- −$2,013
- − Insurance
- −$1,150
- − Repairs & maintenance
- −$2,103
- − Management
- −$2,103
- − HOA
- −$3,288
- − Depreciation
- −$6,691
- Taxable loss
- −$3,941
- Est. tax savings @ 24.0%
- +$946
- After-tax cash flow
- $791/yr
For passive investors: Depreciation is non-cash, so a rental often shows a tax loss while cash-flowing — sheltering income. Rental losses are passive: they offset passive income freely, and up to $25,000/yr can offset ordinary (W-2) income if you actively participate and your MAGI is under $100k (phasing out to $0 by $150k); unused losses carry forward. On sale, claimed depreciation is recaptured at up to 25%, and gains may owe capital-gains tax (a 1031 exchange can defer both). Figures are a year-1 estimate at your 24.0% rate — not tax advice; consult a CPA.
Schools (NCES district)
- District
- Anne Arundel County Public Schools
- NCES district ID
- 2400060
- Math proficiency
- 20% ▼ -21.00%
- Reading proficiency
- 37% ▼ -13.00%
- Median HH income
- $87,880
- Composite
- 28.52/100
- National rank
- #6733
- State rank
- #10 of 24 in MD
Livability — Lake Shore
- Score
- 59/100
- State rank
- #378
- US rank
- #20490
Category grades
Schools grade is shown separately in the Schools card above.
Census & demographics
- Census place
- Lake Shore, MD
- County
- Anne Arundel County · 535,653 people
- City population
- 61,589
- Metro
- Baltimore-Columbia-Towson, MD
- Population (ZIP)
- 61,566
- Household income
- $127,587
- Rent vs Own
- Severe rent burden
- 791.0
Population outlook (Anne Arundel County) Hauer SSP2
- Today (2025)
- 617,384 people
- By 2030
- 642,094 · +4.0%
- By 2040
- 686,621 · +11.2%
- By 2050
- 723,031 · +17.1%
- By 2075
- 809,346 · +31.1%
- By 2100
- 837,658 · +35.7%
Race, ethnicity, and origin ACS 2023
- Neighborhood character
- Predominantly White (80%)
- Race & ethnicity
- White 80% Two or more races 7% Black 7% Hispanic / Latino 5% Asian 2%
- Common ancestry
- Romanian 4% Lithuanian 2% Slovak 2%
- Foreign-born
- 4% · Canada, China
- Languages at home
- 93% English-only · Spanish 3% Other Indo-European 1% Chinese 0%
Political lean MEDSL · Anne Arundel
- 2024 margin
- D (+13.9) · D 55.7% · R 41.7% · Other 2.6%
- 2008→2024 swing
- +15.7pp toward D · 2008: -1.8pp · 2024: 13.9pp
- All cycles
- 2024: D+13.9 2020: D+14.5 2016: D+0.7 2012: R+0.9 2008: R+1.8
Not yet ingested
- Civics
- —
Market trends
- HPI YoY
- ▼ -401.00%
- Current HPI
- 283.1566
- Rent YoY
- ▲ 0.76%
- Metro
- Baltimore-Columbia-Towson, MD
- State GDP YoY
- ▲ 2.97%
- F500 in state
- 12
Industry mix (Fortune 500 HQ in MD)
| Industry | F500 HQs | Revenue |
|---|---|---|
| Aerospace / Defense | 1 | $71B |
|
||
| Utilities | 1 | $25B |
|
||
| Hotels | 1 | $24B |
|
||
| Consumer Goods | 1 | $7B |
|
||
| Real Estate | 1 | $6B |
|
||
| Chemicals | 1 | $2B |
|
||
Price history
+107.2% since first listed13 events — show timeline
- 2026-06-09 Coming Soon $230,000 BRIGHT MLS
- 2018-05-21 Sold (Public Records) $142,000 Public Records
- 2013-05-15 Sold (Public Records) $106,000 Public Records
- 2013-04-19 Sold (MLS) $106,000 BRIGHT MLS
- 2013-04-19 Sold (MLS) $106,000 MRIS
- 2013-03-14 Pending — MRIS
- 2013-03-14 Listing Removed — BRIGHT MLS
- 2013-02-23 Relisted — MRIS
- 2013-02-12 Pending — MRIS
- 2012-12-10 Relisted — MRIS
- 2012-11-24 Delisted — MRIS
- 2012-11-19 Listed $111,000 MRIS
- 2012-11-19 Listed $111,000 BRIGHT MLS
Property tax history
+1.7%/yrLatest (2025): $2,013 · +13.6% YoY. Source: county tax records.
Cash-flow waterfall
monthlySold comps — $/sqft
last 12 mo · ≤1 miLoading sold comps…