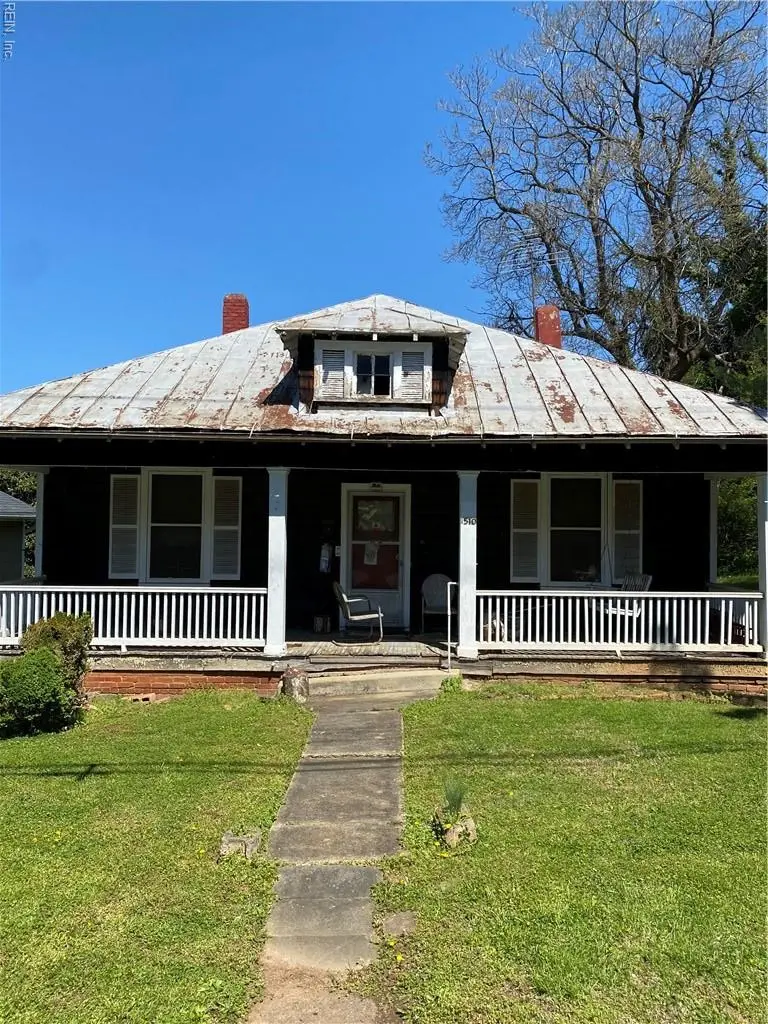
1510 Monroe St · Lynchburg, VA
Flood risk 1/10 · Minimal
- FEMA flood zone
- X (unshaded)
- Chance of flooding over 30 yrs
- 0.0%
- Est. flood insurance / yr
- $473 – $860
Fire risk 2/10 · Minimal
- Est. fire insurance / yr
- $666 – $1,236
Heat risk 6/10 · Moderate
- Hot days now (above 102°F)
- 7 days/yr
- Hot days in 30 yrs
- 18 days/yr
Wind risk 2/10 · Minimal
- Chance of severe wind over 30 yrs
- 3.0%
Air-quality risk 2/10 · Minimal
- Unhealthy air days now
- 0 days/yr
- Unhealthy air days in 30 yrs
- 1 days/yr
Risk factors via First Street. Map © Google.
Why this score? — see what drove the B+ grade
The composite is a weighted blend of 9 inputs, each scored 0–100. Each bar is that input's sub-score; the figure is the points it added to the 100-point composite (weight × sub-score).
- Cash flow +29.2/30.0
- ARV discount +15.0/15.0
- DSCR +10.0/10.0
- 1% rule +7.2/10.0
- Livability +4.5/5.0
- Schools +4.0/10.0
- Rent growth +3.6/5.0
- Condition / age +2.5/5.0
- Appreciation +0.0/10.0
$100,000
🖨 Deal sheet (PDF) 📄 Offer letter ✓ Due diligence
Listing remarks MLS
PROPERTY TO BE SOLD AS-IS, WHERE-AS. INVESTORS SPECIAL WITH PLENTY OF LAND. 200 YARDS OF LAND IN THE REAR!!!!
Key facts
- Built 1926
- Listed 71 days
Neighborhood map
What this means for you Summary
Snapshot
- This is a 3-bed/1.0-bath single-family listed at $100k.
Deal economics
- At list price, monthly cash flow is $349 ($4k/yr) — positive.
- The deal already cash-flows at list — no discount required.
- Meets the 1% rule at list price ($1k rent vs $100k).
- Recommended offer: $94k (6.0% below list) — sets the bar for market timing.
- Cap rate 10.5% vs local median 4.0% in Lynchburg — top-decile yield for the area; either an underpriced asset or a hidden risk that comps aren't pricing in. Stress-test before assuming the spread holds.
Location & tenants
- Location reads 91/100 on livability (#1 in VA, #58 nationally) — a professional / high-income tenant draw. Strengths: amenities A+, commute A+, cost of living A+; Watch: crime C-, employment D+.
- Lynchburg City Public School District (urban): math 36% / reading 61% proficiency, ranked #104 of 131 in VA (top 79%) — families likely to look elsewhere, expect single-tenant / working-renter base with shorter leases; 61% free/reduced lunch — lower-income household profile, screen leases tightly.
- Market conditions: Rents rising fast (+4.6%/yr); 105 active listings in the ZIP; 22 comparable units currently listed for rent nearby; rentals at typical pace (median 22d on market — plan ~3-4 weeks tenant-placement turnaround); 41% of comp listings sitting > 30 days — soft ceiling on asking rent; 472 units permitted in Lynchburg city in 2024 (240 in 5+ unit buildings).
Forward outlook
- Local home prices are declining (-3.0%/yr); year-one equity from $691 of loan paydown is wiped out by about $3k of value loss. Plan a longer hold.
- Lynchburg County population projected at +37% by 2050 — long-run rental-demand tailwind backs the buy-and-hold thesis.
- At projected returns (-3.0% appreciation + 4.6% rent growth), your $28k cash investment doubles in ~8 years — after that, you're playing with house money.
Negotiation context
- It's been on market 72 days — a 6% lower offer ($94k) is reasonable based on typical stale-listing flexibility.
Risks & watch-outs
- Watch-outs: built in 1926 — expect roof / HVAC / electrical / plumbing capex.
- Climate carrying-cost: extreme-heat days projected 7→18/yr by 2055 (HVAC capex compounding) — expect insurance premiums to compound above CPI over the hold.
Questions for the listing agent
- It's been on market 72 days. Have you received any prior offers? Is the seller open to a 6% concession, seller financing, or rate buy-down credit?
- Built in 1926 — when were the roof, HVAC, electrical panel, plumbing, and water heater last replaced?
- Why hasn't it sold? Are there any deal-killer items the seller is aware of (foundation, flood, title, zoning, code violations)?
- Is there a deadline driving the sale (1031 exchange, divorce, estate, relocation)? That informs how much negotiation room exists.
- Schools are A-rated — typically a magnet for longer-tenancy family renters. What's the average tenant stay here, and is there a school-zone premium baked into asking?
- What's the average days-on-market for RENTAL listings here right now (not sales)? A rising rental-DOM trend means longer vacancies and softer asking-rent achievability than the comps imply.
- What's the recent tenant-quality profile in this submarket — average credit score on applications, eviction rate, late-payment / NSF rate, and stable-employment percentage? A property-management company in the area should have these aggregated.
- How much new for-sale + rental construction is in the pipeline within 1–3 miles? Heavy new supply typically softens prices + rents 12–24 months out; constrained supply supports both.
Investment metrics
- 1% rule
- 1.22% ✓
- Cap rate
- 10.48%
- Cash-on-cash
- 14.96%
- DSCR
- 1.67
- GRM
- 6.8
CMA / ARV
- ARV (median comp)
- $148,214
- List price
- $100,000
- Delta
- -32.53%
- Verdict
- UNDERPRICED
- Comps
- 20 within 1.0 mi
Show comp detail 12 sales within ~0.75 mi
| Address | Dist | Beds/Ba | Sqft | Sold | Price | $/sf | Match |
|---|---|---|---|---|---|---|---|
| 1307 14th St | 0.18mi | 2/1.0 (-1) | 934 (-2%) | 8mo | $60,000 | $64 | 76 |
| 1418 Wise St | 0.13mi | 2/1.0 (-1) | 1,024 (+8%) | 6mo | $141,000 | $138 | 72 |
| 817 Polk St | 0.47mi | 2/1.0 (-1) | 979 (+3%) | 2mo | $105,000 | $107 | 67 |
| 1725 Otey St | 0.67mi | 3/1.0 | 961 (+1%) | 4mo | $120,000 | $125 | 63 |
| 217 Race St | 0.61mi | 2/1.0 (-1) | 936 (-2%) | 2mo | $130,000 | $139 | 62 |
| 1114 Knight St | 0.25mi | 3/2.0 | 1,085 (+14%) | 0mo | $43,600 | $40 | 61 |
| 1658 Edmunds St | 0.65mi | 2/2.0 (-1) | 961 (+1%) | 0mo | $103,000 | $107 | 59 |
| 1706 Floyd St | 0.23mi | 2/1.0 (-1) | 1,082 (+14%) | 6mo | $145,000 | $134 | 57 |
| 2013 Poplar St | 0.41mi | 3/2.5 | 1,040 (+9%) | 4mo | $176,000 | $169 | 56 |
| 811 Polk St | 0.49mi | 4/1.0 (+1) | 1,036 (+9%) | 2mo | $149,000 | $144 | 56 |
| 909 Virginia St | 0.55mi | 3/1.0 | 1,064 (+12%) | 6mo | $171,000 | $161 | 50 |
| 1534 Otey St. St | 0.69mi | 2/1.0 (-1) | 1,031 (+8%) | 7mo | $169,900 | $165 | 43 |
Match score weights: distance 35% · size 25% · config 20% · recency 20%. Top-matched comps best support the ARV.
Projected returns pro-forma
-3.0% appreciation · 4.56% rent growth · sell at horizon
- IRR
- 7.1%
- Equity multiple
- 1.28×
- Total profit
- $7,945
- Equity at exit
- $14,910
- IRR
- 17.7%
- Equity multiple
- 2.56×
- Total profit
- $43,688
- Equity at exit
- $8,646
Cash invested: $28,000 (down + closing). Projections, not guarantees.
Landlord ↔ Tenant lean methodology
- Overall (STATE)
- 55 Moderately Landlord-Leaning
- State Virginia
- 55 Moderately Landlord-Leaning · D+2
- County
- — inherits STATE
- City
- — inherits STATE
ZIP-level market 24504
- Home prices YoY
- -12.7%
- Rents YoY
- 4.6%
- Active inventory
- 105
- Price-to-rent
- 6.8×
Monthly cashflow live
- Estimated rent
- $1,223 high interval (Pro) →
- Mortgage (P&I)
- −$524
- Tax from tax record
- −$51 /mo · $612/yr
- Insurance
- −$42
- HOA
- −$0
- Vacancy / Maint / Mgmt
- −$257
- Net cashflow
- $349
Break-even live
Sensitivity live
| Price | -10% $406 | -5% $377 | +0% $349 | +5% $321 | +10% $292 |
|---|---|---|---|---|---|
| Rent | -10% $252 | -5% $301 | +0% $349 | +5% $397 | +10% $446 |
| Rate | -1.0pp $399 | -0.5pp $374 | base $349 | +0.5pp $323 | +1.0pp $297 |
UW: 25.0% down · 7.5% · 30yr · 1.5% tax · 5.0% vac · 8.0% maint · 8.0% mgmt
Financing live
Cash to close
- Down payment
- $25,000
- Closing costs
- $3,000
- Reserves months
- —
- Total cash needed
- —
Loan-product check · same deal, 3 products live
Conventional
25% down · 7.5% · 30yr
- Down + closing
- —
- Monthly P&I
- —
- Monthly cashflow
- —
- DSCR
- —
- Eligible?
- —
Personal DTI + credit; lowest rate.
DSCR
20% down · 8.5% · 30yr
- Down + closing
- —
- Monthly P&I
- —
- Monthly cashflow
- —
- DSCR
- —
- Eligible?
- —
No personal income docs; deal must DSCR.
Hard money
10% down · 12.0% · 12mo
- Down + closing
- —
- Monthly P&I
- —
- Monthly cashflow
- —
- DSCR
- —
- Eligible?
- —
Short-term bridge; refi at stabilization.
Rent comps 22 comps
| Address | Beds | Baths | Sqft | Rent | $/sqft | DOM | Units | Dist |
|---|---|---|---|---|---|---|---|---|
| 1810 Laurel St Lynchburg, VA | 2.0 | 1.0 | 720 | $995 | $1.38 | 44d | 1 | 0.19mi |
| 1106 Pierce St Lynchburg, VA | 3.0 | 2.0 | 1018 | $875 | $0.86 | 21d | 1 | 0.40mi |
| 900 Polk St Unit A Lynchburg, VA | 3.0 | 1.0 | 1100 | $895 | $0.81 | 14d | 1 | 0.44mi |
| 1401 Kemper St Lynchburg, VA | 2.0–3.0 | 2.0 | 1118 | $1,167 | $1.04 | 21d | 6 | 0.49mi |
| 1500 Main St Lynchburg, VA | 1.0–2.0 | 1.0 | 1182 | $1,600 | $1.35 | 14d | 6 | 0.57mi |
| 801 Church St Unit 8 Lynchburg, VA | 2.0 | 2.0 | 875 | $1,850 | $2.11 | 14d | 1 | 0.70mi |
| 317 Polk St Lynchburg, VA | 3.0 | 2.0 | 925 | $1,650 | $1.78 | 44d | 1 | 0.81mi |
| 2336 Aragon St Lynchburg, VA | 2.0 | 1.0 | 1042 | $995 | $0.95 | 14d | 1 | 0.85mi |
| 2107 Park Ave Unit 4 Lynchburg, VA | 2.0 | 1.0 | 800 | $785 | $0.98 | 14d | 1 | 0.87mi |
| 612 Commerce St Lynchburg, VA | 1.0–2.0 | 1.0–2.0 | 716 | $1,250 | $1.74 | 14d | 2 | 0.88mi |
| 2021 Rose Ln Lynchburg, VA | 2.0 | 1.0 | 836 | $1,095 | $1.31 | 21d | 1 | 0.90mi |
| 1625 Shaffer St Lynchburg, VA | 2.0 | 1.0 | 895 | $850 | $0.95 | 44d | 1 | 0.98mi |
| 317 Grove St Unit A Lynchburg, VA | 2.0 | 1.0 | 900 | $895 | $0.99 | 44d | 1 | 0.99mi |
| 318 Wadsworth St Lynchburg, VA | 3.0 | 1.0 | 943 | $995 | $1.06 | 21d | 1 | 1.00mi |
| 2518 Carter St Lynchburg, VA | 3.0 | 2.0 | 1091 | $1,500 | $1.37 | 44d | 1 | 1.02mi |
| 2734 Fort Ave Lynchburg, VA | 1.0–2.0 | 1.0–2.0 | 875 | $1,450 | $1.66 | 44d | 1 | 1.04mi |
| 2205 Easley Ave Lynchburg, VA | 2.0 | 2.0 | 870 | $1,400 | $1.61 | 44d | 1 | 1.07mi |
| 905 Centerdale St Lynchburg, VA | 2.0 | 1.0 | 780 | $895 | $1.15 | 14d | 1 | 1.07mi |
| 1705 1st St Unit A Lynchburg, VA | 2.0 | 1.0 | 1100 | $1,395 | $1.27 | 21d | 1 | 1.07mi |
| 216 Kenyon St Lynchburg, VA | 2.0 | 1.0 | 1114 | $995 | $0.89 | 44d | 1 | 1.21mi |
| 803 Mansfield Ave Lynchburg, VA | 2.0 | 1.0 | 900 | $1,300 | $1.44 | 21d | 1 | 1.45mi |
| 2210 Haden St Lynchburg, VA | 2.0 | 1.0 | 784 | $1,050 | $1.34 | 44d | 1 | 1.48mi |
Listing history 17 events
-
2026-06-19days on market $100,000 Active 72 DOM
-
2026-06-18days on market $100,000 Active 71 DOM
-
2026-06-17days on market $100,000 Active 70 DOM
-
2026-06-16days on market $100,000 Active 69 DOM
-
2026-06-15days on market $100,000 Active 68 DOM
-
2026-06-14days on market $100,000 Active 66 DOM
-
2026-06-13days on market $100,000 Active 65 DOM
-
2026-06-10days on market $100,000 Active 63 DOM
-
2026-06-09days on market $100,000 Active 62 DOM
-
2026-06-08days on market $100,000 Active 61 DOM
-
2026-06-07days on market $100,000 Active 60 DOM
-
2026-06-03days on market $100,000 Active 56 DOM
-
2026-06-02days on market $100,000 Active 55 DOM
-
2026-06-01days on market $100,000 Active 54 DOM
-
2026-05-31days on market $100,000 Active 53 DOM
-
2026-05-30days on market $100,000 Active 52 DOM
-
2026-04-07$100,000 Active 109-char remark
Show marketing remark (109 chars)
PROPERTY TO BE SOLD AS-IS, WHERE-AS. INVESTORS SPECIAL WITH PLENTY OF LAND. 200 YARDS OF LAND IN THE REAR!!!!
ⓘ Source: listings_history table (triggers on properties + properties_extension) + one-shot
backfill from property_details.listing_events for pre-trigger history.
Tax reassessment forecast VA · Resets to sale price
- Current annual tax
- $612 · $51/mo
- Projected year-2 tax
- $820 · $68/mo
- Expected delta
- +$208/yr (+$17/mo · 33.9%)
ⓘ Screening estimate from a state-policy table — verify with the county assessor before closing.
Climate risk First Street
- Flood 1/10 Low FEMA zone X (unshaded) · 0% chance over 30 yrs
- Wildfire 2/10 Low
- Heat 6/10 Major 7 d/yr ≥102°F today · 18 d/yr by 30 yrs out
- Wind 2/10 Low 3% chance of damaging wind over 30 yrs
- Air quality 2/10 Low 0 unhealthy d/yr today · 1 by 30 yrs out
Nearby sold comps map
Loading sold comps map…
Walkable amenities ~0.75 mi
Loading nearby amenities…
Taxation est. · year 1
- Rental income
- $14,675
- − Mortgage interest
- −$5,602
- − Property taxes
- −$612
- − Insurance
- −$500
- − Repairs & maintenance
- −$1,174
- − Management
- −$1,174
- − Depreciation
- −$2,909
- Taxable income
- $2,704
- Est. tax owed @ 24.0%
- −$649
- After-tax cash flow
- $3,539/yr
For passive investors: Depreciation is non-cash, so a rental often shows a tax loss while cash-flowing — sheltering income. Rental losses are passive: they offset passive income freely, and up to $25,000/yr can offset ordinary (W-2) income if you actively participate and your MAGI is under $100k (phasing out to $0 by $150k); unused losses carry forward. On sale, claimed depreciation is recaptured at up to 25%, and gains may owe capital-gains tax (a 1031 exchange can defer both). Figures are a year-1 estimate at your 24.0% rate — not tax advice; consult a CPA.
Schools (NCES district)
- District
- Lynchburg City Public School District
- NCES district ID
- 5102340
- Math proficiency
- 36% ▼ -38.00%
- Reading proficiency
- 61% ▼ -8.00%
- Median HH income
- $39,097
- Composite
- 40.4/100
- National rank
- #3730
- State rank
- #104 of 131 in VA
Livability — Lynchburg
- Score
- 91/100
- State rank
- #1
- US rank
- #58
Category grades
Schools grade is shown separately in the Schools card above.
Census & demographics
- Census place
- Lynchburg, VA
- County
- Lynchburg City · 97,036 people
- City population
- 97,036
- Metro
- Lynchburg, VA
- Population (ZIP)
- 9,632
- Household income
- $52,571
- Rent vs Own
- Severe rent burden
- 552.0
Population outlook (Lynchburg County) Hauer SSP2
- Today (2025)
- 87,977 people
- By 2030
- 93,626 · +6.4%
- By 2040
- 106,145 · +20.7%
- By 2050
- 120,783 · +37.3%
- By 2075
- 162,249 · +84.4%
- By 2100
- 191,358 · +117.5%
Race, ethnicity, and origin ACS 2023
- Neighborhood character
- Diverse neighborhood (Simpson 0.57)
- Race & ethnicity
- White 51% Black 40% Two or more races 6% Hispanic / Latino 4%
- Common ancestry
- Italian 3% Lithuanian 1% Serbian 1%
- Foreign-born
- 4% · Canada, China
- Languages at home
- 95% English-only · Spanish 3% Chinese 1%
Political lean MEDSL · Lynchburg
- 2024 margin
- Lean R (+7.9) · D 45.4% · R 53.3% · Other 1.3%
- 2008→2024 swing
- -3.9pp toward R · 2008: -4.0pp · 2024: -7.9pp
- All cycles
- 2024: R+7.9 2020: D+2.6 2016: R+9.0 2012: R+10.6 2008: R+4.0
Not yet ingested
- Civics
- —
Market trends
- HPI YoY
- ▼ -33.39%
- Current HPI
- 229.4423
- Rent YoY
- ▲ 4.56%
- Metro
- Lynchburg, VA
- State GDP YoY
- ▲ 2.40%
- F500 in state
- 50
Industry mix (Fortune 500 HQ in VA)
| Industry | F500 HQs | Revenue |
|---|---|---|
| Aerospace / Defense | 4 | $236B |
|
||
| Technology / Defense | 3 | $32B |
|
||
| Financial Services | 2 | $176B |
|
||
| Utilities | 2 | $27B |
|
||
| Insurance | 2 | $25B |
|
||
| Technology | 2 | $15B |
|
||
Price history
1 event — show timeline
- 2026-04-07 Listed $100,000 REINMLS
Property tax history
+4.4%/yrLatest (2025): $612 · +74.2% YoY. Source: county tax records.
Cash-flow waterfall
monthlySold comps — $/sqft
last 12 mo · ≤1 miLoading sold comps…