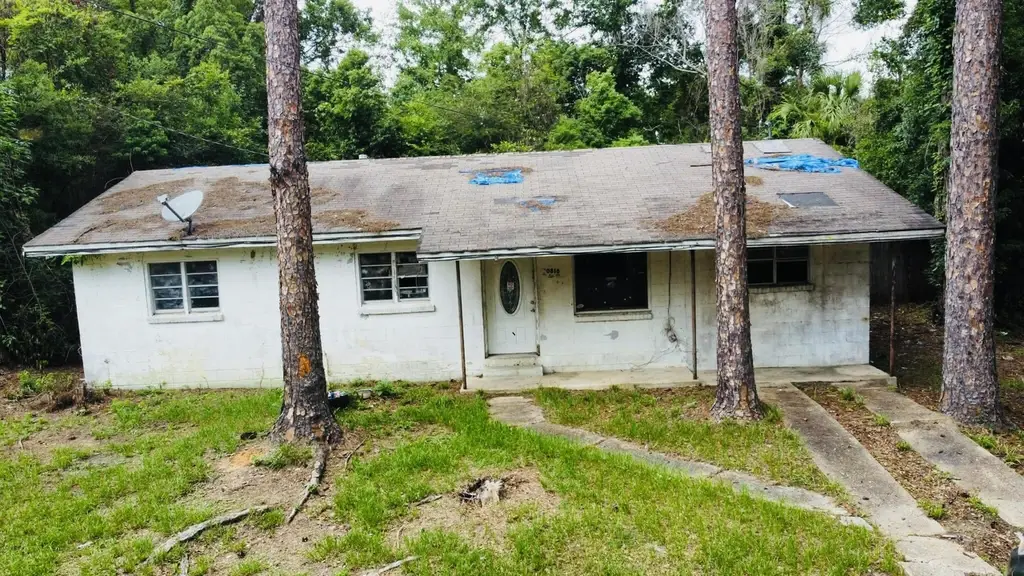
20816 SE Ray Ave · Blountstown, FL
Flood risk 1/10 · Minimal
- FEMA flood zone
- X (unshaded)
- Chance of flooding over 30 yrs
- 0.0%
- Est. flood insurance / yr
- $507 – $1,088
Fire risk 3/10 · Minor
- Est. fire insurance / yr
- $947 – $1,759
Heat risk 8/10 · Major
- Hot days now (above 108°F)
- 7 days/yr
- Hot days in 30 yrs
- 20 days/yr
Wind risk 9/10 · Severe
- Chance of severe wind over 30 yrs
- 99.0%
Air-quality risk 2/10 · Minimal
- Unhealthy air days now
- 2 days/yr
- Unhealthy air days in 30 yrs
- 2 days/yr
Risk factors via First Street. Map © Google.
Why this score? — see what drove the B+ grade
The composite is a weighted blend of 9 inputs, each scored 0–100. Each bar is that input's sub-score; the figure is the points it added to the 100-point composite (weight × sub-score).
- Cash flow +30.0/30.0
- 1% rule +10.0/10.0
- DSCR +10.0/10.0
- ARV discount +7.5/15.0
- Appreciation +6.1/10.0
- Schools +4.4/10.0
- Livability +3.4/5.0
- Rent growth +2.5/5.0
- Condition / age +2.5/5.0
$39,000
🖨 Deal sheet 📄 Offer letter ✓ Due diligence
Listing remarks
HANDY MAN SPECIAL , BLOCK HOUSE BIG YARD IN GOOD AREA , CLOSE TO SCHOOLS , HOSPITAL AND SHOPPING 55 MINUTES TO BEACH
Key facts
- Big yard
- Close to hospital
- 55 minutes to beach
Tags
Property features AI
Finance
- Other: Pets allowed (cats and dogs OK)
Exterior
- Parking: Five total parking spaces; No carport
- Utilities: Public water; Public sewer; 150 amp electric service; Electricity and phone available
- Home design: Single-family residence; One story; Resale property; North-facing
- Construction: Block/CBS construction; Shingle roof; Concrete perimeter foundation; Built as a single-story building
- Exterior features: Back yard fencing; Other exterior structures; Paved public-maintained city street frontage; Interior lot (not waterfront)
Interior
- Kitchen: Electric range
- Bedrooms: Three bedrooms on the main level
- Flooring: Vinyl flooring; Other flooring
- Bathrooms: One full bathroom
- Heating & cooling: Electric heating; Ceiling fans; Wall/window cooling units; Has heating and cooling
- Interior features: Satellite dish; Other window features
- Laundry & utility: Laundry area (other features)
Neighborhood map
What this means for you Summary
Snapshot
- This is a 3-bed/1.0-bath single-family listed at $39k.
Deal economics
- At list price, monthly cash flow is $436 ($5k/yr) — positive.
- The deal already cash-flows at list — no discount required.
- Meets the 1% rule at list price ($910 rent vs $39k).
- Recommended offer: $38k (1.5% below list) — sets the bar for market timing.
- Cap rate 19.7% vs local median 3.1% in Blountstown — top-decile yield for the area; either an underpriced asset or a hidden risk that comps aren't pricing in. Stress-test before assuming the spread holds.
Location & tenants
- Location reads 67/100 on livability (#562 in FL) — a middle-class / working-renter tenant base. Strengths: cost of living A+, housing A+, schools B; Watch: amenities F, commute F, employment F.
- Calhoun (rural): math 52% / reading 55% proficiency, ranked #27 of 73 in FL (top 37%) — acceptable for families but not a draw, mixed tenant base, ~2y average lease.
- Market conditions: 44 active listings in the ZIP; 30 units permitted in Calhoun County in 2024 (0 in 5+ unit buildings).
Forward outlook
- In year one you build about $1k of equity ($270 loan paydown + $826 appreciation (2.1% local appreciation)).
- Calhoun County population projected at -14% by 2050 — secular population decline; favor cash flow + early exit over multi-decade hold.
- At projected returns (2.1% appreciation + 3.0% rent growth), your $11k cash investment doubles in ~2 years — after that, you're playing with house money.
Negotiation context
- It's been on market 20 days — a 2% lower offer ($38k) is reasonable based on typical stale-listing flexibility.
Risks & watch-outs
- Climate carrying-cost: severe wind risk, 99% chance of damaging wind over 30y; extreme-heat days projected 7→20/yr by 2055 (HVAC capex compounding) — expect insurance premiums to compound above CPI over the hold.
Questions for the listing agent
- Built in 1960 — when were the roof, HVAC, electrical panel, plumbing, and water heater last replaced?
- Is there a deadline driving the sale (1031 exchange, divorce, estate, relocation)? That informs how much negotiation room exists.
- Schools are B-rated — typically a magnet for longer-tenancy family renters. What's the average tenant stay here, and is there a school-zone premium baked into asking?
- What's the average days-on-market for RENTAL listings here right now (not sales)? A rising rental-DOM trend means longer vacancies and softer asking-rent achievability than the comps imply.
- What's the recent tenant-quality profile in this submarket — average credit score on applications, eviction rate, late-payment / NSF rate, and stable-employment percentage? A property-management company in the area should have these aggregated.
- How much new for-sale + rental construction is in the pipeline within 1–3 miles? Heavy new supply typically softens prices + rents 12–24 months out; constrained supply supports both.
Investment metrics
- 1% rule
- 2.33% ✓
- Cap rate
- 19.71%
- Cash-on-cash
- 47.92%
- DSCR
- 3.13
- GRM
- 3.6
CMA / ARV
- ARV (on-the-fly)
- $131,122
- Comps found
- 4
Show comp detail 4 sales within ~0.75 mi
| Address | Dist | Beds/Ba | Sqft | Sold | Price | $/sf | Match |
|---|---|---|---|---|---|---|---|
| 20837 Lockwood Ave | 0.33mi | 3/2.0 | 1,224 (-1%) | 15mo | $130,000 | $106 | 66 |
| 16088 SE Johnson St | 0.50mi | 3/2.0 | 1,364 (+10%) | 1mo | $200,000 | $147 | 55 |
| 16009 SE Jeffrey St | 0.51mi | 4/2.0 (+1) | 1,326 (+7%) | 11mo | $115,000 | $87 | 46 |
| 20560 NW Folsom Ave | 0.68mi | 2/2.0 (-1) | 1,383 (+12%) | 2mo | $92,500 | $67 | 38 |
Match score weights: distance 35% · size 25% · config 20% · recency 20%. Top-matched comps best support the ARV.
Projected returns pro-forma
2.12% appreciation · 3.0% rent growth · sell at horizon
- IRR
- 52.0%
- Equity multiple
- 3.81×
- Total profit
- $30,706
- Equity at exit
- $15,633
- IRR
- 52.5%
- Equity multiple
- 7.66×
- Total profit
- $72,729
- Equity at exit
- $22,706
Cash invested: $10,920 (down + closing). Projections, not guarantees.
Landlord ↔ Tenant lean methodology
- Overall (STATE)
- 87 Strongly Landlord-Friendly
- State Florida
- 87 Strongly Landlord-Friendly · R+3
- County
- — inherits STATE
- City
- — inherits STATE
ZIP-level market 32424
- Home prices YoY
- 1.2%
- Active inventory
- 44
- Price-to-rent
- 3.6×
Monthly cashflow live
- Estimated rent
- $910 medium interval (Pro) →
- Mortgage (P&I)
- −$205
- Tax from tax record
- −$62 /mo · $747/yr
- Insurance
- −$16
- HOA
- −$0
- Vacancy / Maint / Mgmt
- −$191
- Net cashflow
- $436
Break-even live
UW: 25.0% down · 7.5% · 30yr · 1.5% tax · 5.0% vac · 8.0% maint · 8.0% mgmt
Financing live
Cash to close
- Down payment
- $9,750
- Closing costs
- $1,170
- Reserves months
- —
- Total cash needed
- —
Loan-product check · same deal, 3 products live
Conventional
25% down · 7.5% · 30yr
- Down + closing
- —
- Monthly P&I
- —
- Monthly cashflow
- —
- DSCR
- —
- Eligible?
- —
Personal DTI + credit; lowest rate.
DSCR
20% down · 8.5% · 30yr
- Down + closing
- —
- Monthly P&I
- —
- Monthly cashflow
- —
- DSCR
- —
- Eligible?
- —
No personal income docs; deal must DSCR.
Hard money
10% down · 12.0% · 12mo
- Down + closing
- —
- Monthly P&I
- —
- Monthly cashflow
- —
- DSCR
- —
- Eligible?
- —
Short-term bridge; refi at stabilization.
Listing history 16 events
-
2026-06-19days on market $39,000 Active 20 DOM
-
2026-06-18days on market $39,000 Active 19 DOM
-
2026-06-17days on market $39,000 Active 18 DOM
-
2026-06-16days on market $39,000 Active 17 DOM
-
2026-06-15days on market $39,000 Active 16 DOM
-
2026-06-14days on market $39,000 Active 14 DOM
-
2026-06-13days on market $39,000 Active 13 DOM
-
2026-06-10days on market $39,000 Active 11 DOM
-
2026-06-09days on market $39,000 Active 10 DOM
-
2026-06-08days on market $39,000 Active 9 DOM
-
2026-06-07days on market $39,000 Active 8 DOM
-
2026-06-03days on market $39,000 Active 4 DOM
-
2026-06-02days on market $39,000 Active 3 DOM
-
2026-06-01days on market $39,000 Active 2 DOM
-
2026-05-30remarks 119-char remark
-
2026-05-30$39,000 Active 1 DOM
ⓘ Source: listings_history table (triggers on properties + properties_extension) + one-shot
backfill from property_details.listing_events for pre-trigger history.
Tax reassessment forecast FL · Resets to sale price
- Current annual tax
- $747 · $62/mo
- Projected year-2 tax
- $747 · $62/mo
- Expected delta
- $0/yr ($0/mo · 0.0%)
ⓘ Screening estimate from a state-policy table — verify with the county assessor before closing.
Climate risk First Street
- Flood 1/10 Low FEMA zone X (unshaded) · 0% chance over 30 yrs
- Wildfire 3/10 Moderate
- Heat 8/10 Severe 7 d/yr ≥108°F today · 20 d/yr by 30 yrs out
- Wind 9/10 Extreme 99% chance of damaging wind over 30 yrs
- Air quality 2/10 Low 2 unhealthy d/yr today · 2 by 30 yrs out
Nearby sold comps map
Loading sold comps map…
Walkable amenities ~0.75 mi
Loading nearby amenities…
Taxation est. · year 1
- Rental income
- $10,923
- − Mortgage interest
- −$2,185
- − Property taxes
- −$747
- − Insurance
- −$195
- − Repairs & maintenance
- −$874
- − Management
- −$874
- − Depreciation
- −$1,135
- Taxable income
- $4,914
- Est. tax owed @ 24.0%
- −$1,179
- After-tax cash flow
- $4,054/yr
For passive investors: Depreciation is non-cash, so a rental often shows a tax loss while cash-flowing — sheltering income. Rental losses are passive: they offset passive income freely, and up to $25,000/yr can offset ordinary (W-2) income if you actively participate and your MAGI is under $100k (phasing out to $0 by $150k); unused losses carry forward. On sale, claimed depreciation is recaptured at up to 25%, and gains may owe capital-gains tax (a 1031 exchange can defer both). Figures are a year-1 estimate at your 24.0% rate — not tax advice; consult a CPA.
Schools (NCES district)
- District
- Calhoun
- NCES district ID
- 1200210
- Math proficiency
- 52% ▼ -12.00%
- Reading proficiency
- 55% ▼ -7.00%
- Median HH income
- $33,844
- Composite
- 44.14/100
- National rank
- #2863
- State rank
- #27 of 73 in FL
Livability — Blountstown
- Score
- 67/100
- State rank
- #562
- US rank
- #10782
Category grades
Schools grade is shown separately in the Schools card above.
Census & demographics
- Census place
- Blountstown, FL
- Population (ZIP)
- 7,430
Population outlook (Calhoun County) Hauer SSP2
- Today (2025)
- 13,969 people
- By 2030
- 13,584 · -2.8%
- By 2040
- 12,853 · -8.0%
- By 2050
- 12,006 · -14.1%
- By 2075
- 9,504 · -32.0%
- By 2100
- 6,541 · -53.2%
Race, ethnicity, and origin ACS 2023
- Neighborhood character
- Majority White (64%)
- Race & ethnicity
- White 64% Black 20% Two or more races 9% Hispanic / Latino 8%
- Hispanic origin (detail)
- Puerto Rican 3% Cuban 1%
- Common ancestry
- Slovak 2% Iranian 1% Italian 1%
- Foreign-born
- 4% · Canada, Vietnam
- Languages at home
- 92% English-only · Spanish 6% French/Haitian/Cajun 1% German/W. Germanic 1%
Political lean MEDSL · Calhoun
- 2024 margin
- Solid R (+67.6) · D 15.9% · R 83.5%
- 2008→2024 swing
- -27.2pp toward R · 2008: -40.4pp · 2024: -67.6pp
- All cycles
- 2024: R+67.6 2020: R+62.3 2016: R+56.2 2012: R+43.9 2008: R+40.4
Not yet ingested
- Civics
- —
Market trends
- HPI YoY
- ▲ 2.12%
- Current HPI
- 182.1718
- Rent YoY
- —
- Metro
- —
- State GDP YoY
- ▲ 3.28%
- F500 in state
- 36
Industry mix (Fortune 500 HQ in FL)
| Industry | F500 HQs | Revenue |
|---|---|---|
| Industrial Technology | 2 | $29B |
|
||
| Insurance | 2 | $17B |
|
||
| Retail | 1 | $60B |
|
||
| Technology Distribution | 1 | $58B |
|
||
| Homebuilding | 1 | $35B |
|
||
| Technology Manufacturing | 1 | $35B |
|
||
Price history
1 event — show timeline
- 2026-05-30 Listed $39,000 Beaches MLS
Property tax history
+22.4%/yrLatest (2025): $747 · +12.5% YoY. Source: county tax records.
Cash-flow waterfall
monthlySold comps — $/sqft
last 12 mo · ≤1 miLoading sold comps…