 🏷️ Likely Rental
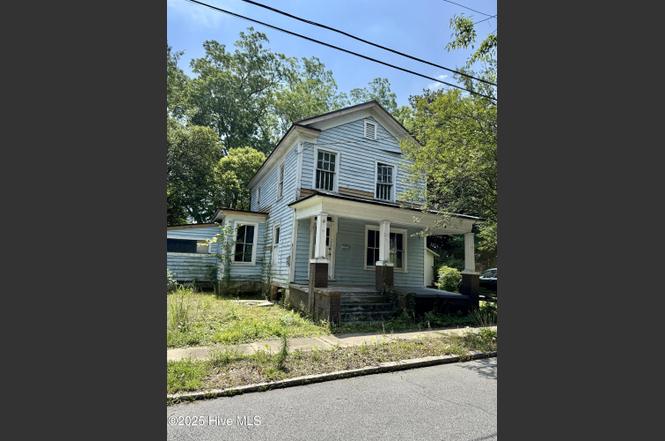
207 N Pierce St · Washington, NC
Flood risk 8/10 · Major
- FEMA flood zone
- X (shaded)
- Chance of flooding over 30 yrs
- 0.98%
- Est. flood insurance / yr
- $507 – $1,088
Fire risk 3/10 · Minor
- Est. fire insurance / yr
- $906 – $1,684
Heat risk 9/10 · Severe
- Hot days now (above 108°F)
- 7 days/yr
- Hot days in 30 yrs
- 17 days/yr
Wind risk 8/10 · Major
- Chance of severe wind over 30 yrs
- 80.0%
Air-quality risk 2/10 · Minimal
- Unhealthy air days now
- 2 days/yr
- Unhealthy air days in 30 yrs
- 2 days/yr
Risk factors via First Street. Map © Google.
Why this score? — see what drove the B- grade
The composite is a weighted blend of 9 inputs, each scored 0–100. Each bar is that input's sub-score; the figure is the points it added to the 100-point composite (weight × sub-score).
- Cash flow +30.0/30.0
- 1% rule +10.0/10.0
- DSCR +10.0/10.0
- ARV discount +7.5/15.0
- Schools +3.4/10.0
- Livability +3.2/5.0
- Rent growth +2.5/5.0
- Condition / age +2.5/5.0
- Appreciation +0.0/10.0
$89,000
🖨 Deal sheet 📄 Offer letter ✓ Due diligence
Listing remarks MLS
Good Little investment opportunity, just a few blocks from downtown, long time tenant.
Key facts
- Downtown washington
- Total renovation
- 1900s house
Tags
Property features AI
Exterior
- Parking: 1 open parking space; Off-street, on-site unpaved parking
- Utilities: Public water; Sewer available; Water available
- Home design: Single-family residence; Two levels
- Construction: Wood siding/frame construction; Metal roof
- Exterior features: Covered porch; Open lot; Paved road access
Interior
- Bathrooms: 1 full bathroom
- Heating & cooling: No heating; No cooling
- Interior features: 5 total rooms; Crawl space basement; no full basement
Neighborhood map
What this means for you Summary
Snapshot
- This is a 2-bed/1.0-bath single-family listed at $89k.
Deal economics
- At list price, monthly cash flow is $453 ($5k/yr) — positive.
- The deal already cash-flows at list — no discount required.
- Meets the 1% rule at list price ($1k rent vs $89k).
- Recommended offer: $78k (12.0% below list) — sets the bar for market timing.
- Cap rate 13.3% vs local median 2.3% in Washington — top-decile yield for the area; either an underpriced asset or a hidden risk that comps aren't pricing in. Stress-test before assuming the spread holds.
Location & tenants
- Location reads 64/100 on livability (#341 in NC) — a middle-class / working-renter tenant base. Strengths: cost of living A+, health & safety A+, housing B+; Watch: crime F, amenities F, commute F.
- Beaufort County Schools (rural): math 39% / reading 42% proficiency, ranked #112 of 178 in NC (top 63%) — families likely to look elsewhere, expect single-tenant / working-renter base with shorter leases; 67% free/reduced lunch — lower-income household profile, screen leases tightly.
- Zoned schools: Eastern Elementary (475 students, 99% FRL); P S Jones Middle (math 32% / reading 42%, grade F, #262 of 475 statewide, top 57%, 727 students, 100% FRL); Washington High (math 27% / reading 32%, grade F, #459 of 535 statewide, top 87%, 839 students, 99% FRL) — zoned schools average 99% FRL vs 67% district-wide (33 pts higher); higher-poverty schools than district average — tighter screening recommended.
- Market conditions: 162 active listings in the ZIP; 1 comparable units currently listed for rent nearby; 216 units permitted in Beaufort County in 2024 (0 in 5+ unit buildings).
Forward outlook
- Local home prices are declining (-3.0%/yr); year-one equity from $615 of loan paydown is wiped out by about $3k of value loss. Plan a longer hold.
- Beaufort County population projected at -10% by 2050 — secular population decline; favor cash flow + early exit over multi-decade hold.
- At projected returns (-3.0% appreciation + 3.0% rent growth), your $25k cash investment doubles in ~6 years — after that, you're playing with house money.
Negotiation context
- It's been on market 358 days — a 12% lower offer ($78k) is reasonable based on typical stale-listing flexibility.
- 2 sale attempts since 4y ago; this cycle's ask has dropped $31k (26%) from the opening price — seller is motivated, your offer sets the floor, not the list.
- Current owner paid $41k; list at $89k implies a 117% gain — meaningful room to come down on a strong offer.
Risks & watch-outs
- Watch-outs: flood insurance adds $66/mo; built in 1900 — expect roof / HVAC / electrical / plumbing capex.
- Climate carrying-cost: severe flood risk; severe wind risk, 80% chance of damaging wind over 30y; extreme-heat days projected 7→17/yr by 2055 (HVAC capex compounding) — expect insurance premiums to compound above CPI over the hold.
Questions for the listing agent
- It's been on market 358 days. Have you received any prior offers? Is the seller open to a 12% concession, seller financing, or rate buy-down credit?
- Built in 1900 — when were the roof, HVAC, electrical panel, plumbing, and water heater last replaced?
- What's the actual annual flood-insurance premium (NFIP or private), and is the property in a SFHA with mandatory coverage?
- Why hasn't it sold? Are there any deal-killer items the seller is aware of (foundation, flood, title, zoning, code violations)?
- Is there a deadline driving the sale (1031 exchange, divorce, estate, relocation)? That informs how much negotiation room exists.
- Schools are D-rated, which usually means shorter tenancies and higher turnover. Who's the typical renter profile here, and what's been the actual vacancy rate?
- Crime grade is F in this area — have there been break-ins, vandalism, or insurance claims at this property in the last 3 years? What carrier currently insures it and at what premium?
- What's the average days-on-market for RENTAL listings here right now (not sales)? A rising rental-DOM trend means longer vacancies and softer asking-rent achievability than the comps imply.
- What's the recent tenant-quality profile in this submarket — average credit score on applications, eviction rate, late-payment / NSF rate, and stable-employment percentage? A property-management company in the area should have these aggregated.
- How much new for-sale + rental construction is in the pipeline within 1–3 miles? Heavy new supply typically softens prices + rents 12–24 months out; constrained supply supports both.
Investment metrics
- 1% rule
- 1.51% ✓
- Cap rate
- 13.29%
- Cash-on-cash
- 25.00%
- DSCR
- 2.11
- GRM
- 5.5
CMA / ARV
- ARV (on-the-fly)
- $218,988
- Comps found
- 10
Show comp detail 10 sales within ~0.75 mi
| Address | Dist | Beds/Ba | Sqft | Sold | Price | $/sf | Match |
|---|---|---|---|---|---|---|---|
| 743 W 2nd St | 0.21mi | 3/2.0 (+1) | 1,394 (-2%) | 6mo | $215,000 | $154 | 73 |
| 612 Van Norden St | 0.38mi | 3/2.0 (+1) | 1,327 (-7%) | 0mo | $173,100 | $130 | 62 |
| 510 Hackney Ave | 0.43mi | 2/1.0 | 1,267 (-11%) | 2mo | $121,175 | $96 | 60 |
| 233 E Water St | 0.67mi | 2/2.5 | 1,440 (+1%) | 2mo | $575,000 | $399 | 59 |
| 750 W 2nd St | 0.22mi | 2/2.0 | 1,572 (+10%) | 11mo | $295,918 | $188 | 59 |
| 601 W 2nd St | 0.05mi | 3/2.0 (+1) | 1,562 (+10%) | 21mo | $353,000 | $226 | 55 |
| 108 E 7th St | 0.62mi | 3/1.0 (+1) | 1,396 (-2%) | 18mo | $187,000 | $134 | 48 |
| 708 Gladden St | 0.47mi | 3/2.0 (+1) | 1,233 (-13%) | 14mo | $190,000 | $154 | 36 |
| 318 E 2nd St | 0.71mi | 2/1.5 | 1,554 (+9%) | 20mo | $445,000 | $286 | 32 |
| 115 E 8th St | 0.67mi | 3/1.0 (+1) | 1,250 (-12%) | 22mo | $68,000 | $54 | 26 |
Match score weights: distance 35% · size 25% · config 20% · recency 20%. Top-matched comps best support the ARV.
Projected returns pro-forma
-3.0% appreciation · 3.0% rent growth · sell at horizon
- IRR
- 14.5%
- Equity multiple
- 1.58×
- Total profit
- $14,433
- Equity at exit
- $13,270
- IRR
- 23.2%
- Equity multiple
- 3.00×
- Total profit
- $49,765
- Equity at exit
- $7,695
Cash invested: $24,920 (down + closing). Projections, not guarantees.
Landlord ↔ Tenant lean methodology
- Overall (STATE)
- 85 Strongly Landlord-Friendly
- State North Carolina
- 85 Strongly Landlord-Friendly · R+3
- County
- — inherits STATE
- City
- — inherits STATE
ZIP-level market 27889
- Home prices YoY
- -24.4%
- Active inventory
- 162
- Price-to-rent
- 5.5×
Monthly cashflow live
- Estimated rent
- $1,341 medium interval (Pro) →
- Mortgage (P&I)
- −$467
- Tax from tax record
- −$36 /mo · $438/yr
- Insurance
- −$37
- Flood insurance flood zone
- −$66 /mo · $798/yr
- HOA
- −$0
- Vacancy / Maint / Mgmt
- −$282
- Net cashflow
- $453
Break-even live
UW: 25.0% down · 7.5% · 30yr · 1.5% tax · 5.0% vac · 8.0% maint · 8.0% mgmt
Financing live
Cash to close
- Down payment
- $22,250
- Closing costs
- $2,670
- Reserves months
- —
- Total cash needed
- —
Loan-product check · same deal, 3 products live
Conventional
25% down · 7.5% · 30yr
- Down + closing
- —
- Monthly P&I
- —
- Monthly cashflow
- —
- DSCR
- —
- Eligible?
- —
Personal DTI + credit; lowest rate.
DSCR
20% down · 8.5% · 30yr
- Down + closing
- —
- Monthly P&I
- —
- Monthly cashflow
- —
- DSCR
- —
- Eligible?
- —
No personal income docs; deal must DSCR.
Hard money
10% down · 12.0% · 12mo
- Down + closing
- —
- Monthly P&I
- —
- Monthly cashflow
- —
- DSCR
- —
- Eligible?
- —
Short-term bridge; refi at stabilization.
Rent comps 1 comps
| Address | Beds | Baths | Sqft | Rent | $/sqft | DOM | Units | Dist |
|---|---|---|---|---|---|---|---|---|
| 1509 N Respess St Washington, NC | 3.0 | 2.0 | 1284 | $1,650 | $1.29 | 20d | 1 | 1.03mi |
Listing history 22 events
-
2026-06-19days on market $89,000 Active 358 DOM
-
2026-06-18days on market $89,000 Active 357 DOM
-
2026-06-17days on market $89,000 Active 356 DOM
-
2026-06-16days on market $89,000 Active 355 DOM
-
2026-06-15days on market $89,000 Active 354 DOM
-
2026-06-14days on market $89,000 Active 352 DOM
-
2026-06-13days on market $89,000 Active 351 DOM
-
2026-06-10days on market $89,000 Active 349 DOM
-
2026-06-09days on market $89,000 Active 348 DOM
-
2026-06-08days on market $89,000 Active 347 DOM
-
2026-06-07days on market $89,000 Active 346 DOM
-
2026-06-03days on market $89,000 Active 342 DOM
-
2026-06-02days on market $89,000 Active 341 DOM
-
2026-06-01days on market $89,000 Active 340 DOM
-
2026-05-31days on market $89,000 Active 339 DOM
-
2026-05-30days on market $89,000 Active 338 DOM
-
2026-04-21price $89,000
-
2025-10-01price $105,000
-
2025-06-26$120,000 Active
-
2022-10-12soldstatus $41,000 Closed 86-char remark
Show marketing remark (86 chars)
Good Little investment opportunity, just a few blocks from downtown, long time tenant.
-
2022-09-14status Pending 86-char remark
Show marketing remark (86 chars)
Good Little investment opportunity, just a few blocks from downtown, long time tenant.
-
2022-09-14$45,000 Active 86-char remark
Show marketing remark (86 chars)
Good Little investment opportunity, just a few blocks from downtown, long time tenant.
ⓘ Source: listings_history table (triggers on properties + properties_extension) + one-shot
backfill from property_details.listing_events for pre-trigger history.
Tax reassessment forecast NC · Resets to sale price
- Current annual tax
- $438 · $36/mo
- Projected year-2 tax
- $730 · $61/mo
- Expected delta
- +$292/yr (+$24/mo · 66.6%)
ⓘ Screening estimate from a state-policy table — verify with the county assessor before closing.
Climate risk First Street
- Flood 8/10 Severe FEMA zone X (shaded) · 98% chance over 30 yrs
- Wildfire 3/10 Moderate
- Heat 9/10 Extreme 7 d/yr ≥108°F today · 17 d/yr by 30 yrs out
- Wind 8/10 Severe 80% chance of damaging wind over 30 yrs
- Air quality 2/10 Low 2 unhealthy d/yr today · 2 by 30 yrs out
Nearby sold comps map
Loading sold comps map…
Walkable amenities ~0.75 mi
Loading nearby amenities…
Taxation est. · year 1
- Rental income
- $16,095
- − Mortgage interest
- −$4,985
- − Property taxes
- −$438
- − Insurance
- −$1,242
- − Repairs & maintenance
- −$1,288
- − Management
- −$1,288
- − Depreciation
- −$2,589
- Taxable income
- $4,265
- Est. tax owed @ 24.0%
- −$1,024
- After-tax cash flow
- $4,410/yr
For passive investors: Depreciation is non-cash, so a rental often shows a tax loss while cash-flowing — sheltering income. Rental losses are passive: they offset passive income freely, and up to $25,000/yr can offset ordinary (W-2) income if you actively participate and your MAGI is under $100k (phasing out to $0 by $150k); unused losses carry forward. On sale, claimed depreciation is recaptured at up to 25%, and gains may owe capital-gains tax (a 1031 exchange can defer both). Figures are a year-1 estimate at your 24.0% rate — not tax advice; consult a CPA.
Schools (NCES district)
- District
- Beaufort County Schools
- NCES district ID
- 3700330
- Math proficiency
- 39% ▬ 0.00%
- Reading proficiency
- 42% ▲ 3.00%
- Median HH income
- $40,486
- Composite
- 33.99/100
- National rank
- #5320
- State rank
- #112 of 178 in NC
Livability — Washington
- Score
- 64/100
- State rank
- #341
- US rank
- #13721
Category grades
Schools grade is shown separately in the Schools card above.
Census & demographics
- Census place
- Washington, NC
- County
- Beaufort County · 24,371 people
- City population
- 24,371
- Metro
- Washington, NC
- Population (ZIP)
- 24,371
- Household income
- $53,179
- Rent vs Own
- Severe rent burden
- 857.0
Population outlook (Beaufort County) Hauer SSP2
- Today (2025)
- 47,069 people
- By 2030
- 46,417 · -1.4%
- By 2040
- 44,455 · -5.6%
- By 2050
- 42,239 · -10.3%
- By 2075
- 37,349 · -20.7%
- By 2100
- 32,434 · -31.1%
Race, ethnicity, and origin ACS 2023
- Neighborhood character
- Diverse neighborhood (Simpson 0.58)
- Race & ethnicity
- White 58% Black 27% Hispanic / Latino 10% Two or more races 7%
- Hispanic origin (detail)
- Mexican 8% Puerto Rican 1%
- Common ancestry
- Slovak 1% Serbian 1% Italian 1%
- Foreign-born
- 5% · Canada, Vietnam
- Languages at home
- 91% English-only · Spanish 8% Vietnamese 1%
Political lean MEDSL · Beaufort
- 2024 margin
- Solid R (+31.1) · D 34.1% · R 65.2%
- 2008→2024 swing
- -13.7pp toward R · 2008: -17.4pp · 2024: -31.1pp
- All cycles
- 2024: R+31.1 2020: R+25.9 2016: R+24.5 2012: R+19.3 2008: R+17.4
Not yet ingested
- Civics
- —
Market trends
- HPI YoY
- ▼ -94.40%
- Current HPI
- 291.9128
- Rent YoY
- —
- Metro
- Washington, NC
- State GDP YoY
- ▲ 3.28%
- F500 in state
- 26
Industry mix (Fortune 500 HQ in NC)
| Industry | F500 HQs | Revenue |
|---|---|---|
| Financial Services | 2 | $213B |
|
||
| Retail | 2 | $95B |
|
||
| Industrial Conglomerate | 1 | $38B |
|
||
| Metals / Steel | 1 | $35B |
|
||
| Utilities | 1 | $30B |
|
||
| Industrial Machinery | 1 | $19B |
|
||
Price history
+97.8% since first listed6 events — show timeline
- 2026-04-21 Price Changed $89,000 Hive MLS
- 2025-10-01 Price Changed $105,000 Hive MLS
- 2025-06-26 Listed $120,000 Hive MLS
- 2022-10-12 Sold (MLS) $41,000 Hive MLS
- 2022-09-14 Pending — Hive MLS
- 2022-09-14 Listed $45,000 Hive MLS
Property tax history
-0.9%/yrLatest (2025): $438 · +76.5% YoY. Source: county tax records.
Cash-flow waterfall
monthlySold comps — $/sqft
last 12 mo · ≤1 miLoading sold comps…