398 Sawtell Ave SE · Atlanta, GA
Flood risk 1/10 · Minimal
- FEMA flood zone
- X (unshaded)
- Chance of flooding over 30 yrs
- 0.0%
- Est. flood insurance / yr
- $473 – $860
Fire risk 1/10 · Minimal
- Est. fire insurance / yr
- $963 – $1,789
Heat risk 5/10 · Moderate
- Hot days now (above 105°F)
- 7 days/yr
- Hot days in 30 yrs
- 18 days/yr
Wind risk 6/10 · Moderate
- Chance of severe wind over 30 yrs
- 27.0%
Air-quality risk 4/10 · Minor
- Unhealthy air days now
- 4 days/yr
- Unhealthy air days in 30 yrs
- 6 days/yr
Risk factors via First Street. Map © Google.
Why this score? — see what drove the B grade
The composite is a weighted blend of 9 inputs, each scored 0–100. Each bar is that input's sub-score; the figure is the points it added to the 100-point composite (weight × sub-score).
- Cash flow +30.0/30.0
- 1% rule +10.0/10.0
- DSCR +10.0/10.0
- ARV discount +7.5/15.0
- Livability +4.2/5.0
- Rent growth +3.3/5.0
- Schools +2.7/10.0
- Condition / age +2.5/5.0
- Appreciation +0.0/10.0
$89,900
🖨 Deal sheet 📄 Offer letter ✓ Due diligence
Listing remarks MLS
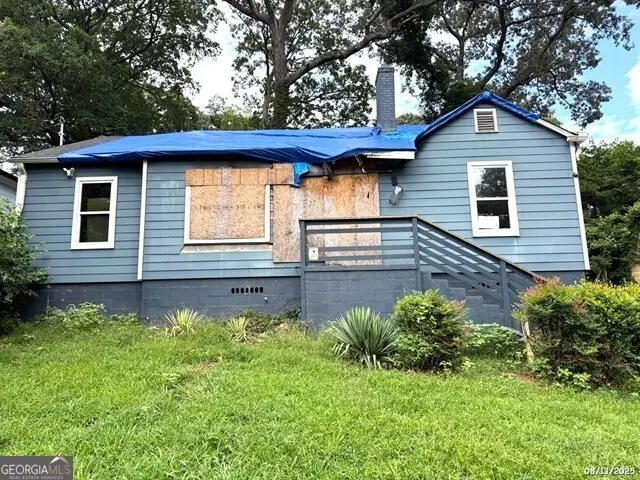
This Is It! Investor Special - Fire-Damaged Property Calling all investors and rehabbers! This home is in need of a full renovation due to fire damage a true blank slate with endless potential. Don't miss this opportunity to transform a property in a rapidly growing area. Conveniently located near schools, shopping, and just minutes from Grant Park, The Beacon, The Beltline, The Westside, Downtown South Atlanta, and major highways. Prime location with strong upside!
Key facts
- 7,753 sq ft lot
- 2 parking spots
- Built 1945
Property features AI
Exterior
- Parking: Parking pad with space for 2 vehicles
- Utilities: Public water; Public sewer; Electric service: 110 volts; Electricity, sewer, and water available
- Home design: One-level home; Fee simple ownership; EarthCraft Home verification
- Construction: Built with other/unspecified construction materials; Other roof material; Block foundation
- Exterior features: Paved road frontage; Near public transport
Interior
- Kitchen: No kitchen features listed
- Bedrooms: Three main-level bedrooms; Bedroom features: Other
- Bathrooms: Two full bathrooms, both on the main level; Master bathroom: None
- Heating & cooling: Heating: Other; Cooling: Other
- Interior features: No shared/common walls; Crawl space foundation; Fixer condition
- Laundry & utility: Laundry features: Other
Neighborhood map
What this means for you Summary
Snapshot
- This is a 3-bed/2.0-bath single-family listed at $90k.
Deal economics
- At list price, monthly cash flow is $699 ($8k/yr) — positive.
- The deal already cash-flows at list — no discount required.
- Meets the 1% rule at list price ($2k rent vs $90k).
- Recommended offer: $89k (1.5% below list) — sets the bar for market timing.
- Cap rate 15.6% vs local median 3.1% in Atlanta — top-decile yield for the area; either an underpriced asset or a hidden risk that comps aren't pricing in. Stress-test before assuming the spread holds.
Location & tenants
- Location reads 83/100 on livability (#6 in GA, #919 nationally) — a professional / high-income tenant draw. Strengths: amenities A+, commute A+, housing A+; Watch: cost of living C-.
- Atlanta Public Schools (urban): math 28% / reading 35% proficiency, ranked #80 of 174 in GA (top 46%) — families likely to look elsewhere, expect single-tenant / working-renter base with shorter leases; 71% free/reduced lunch — lower-income household profile, screen leases tightly.
- Zoned schools: Thomas Heathe Slater Elementary School (math 2% / reading 8%, grade F, #1,160 of 1,228 statewide, top 98%, 569 students, 100% FRL); Judson Price Middle School (math 2% / reading 8%, grade F, #462 of 470 statewide, top 99%, 283 students, 100% FRL) — zoned schools average 100% FRL vs 71% district-wide (29 pts higher); higher-poverty schools than district average — tighter screening recommended.
- Zoned-school proficiency averages 5% at this address vs 32% district-wide (-26 pts) — the specific schools serving this property underperform the Atlanta Public Schools average; the district grade overstates school quality for this exact location.
- Market conditions: Rents rising (+3.2%/yr); 378 active listings in the ZIP; 40 comparable units currently listed for rent nearby; rentals at typical pace (median 18d on market — plan ~3-4 weeks tenant-placement turnaround); 11,565 units permitted in Fulton County in 2024 (8,159 in 5+ unit buildings).
Forward outlook
- Local home prices are declining (-3.0%/yr); year-one equity from $622 of loan paydown is wiped out by about $3k of value loss. Plan a longer hold.
- Fulton County population projected at +38% by 2050 — long-run rental-demand tailwind backs the buy-and-hold thesis.
- At projected returns (-3.0% appreciation + 3.2% rent growth), your $25k cash investment doubles in ~4 years — after that, you're playing with house money.
Negotiation context
- It's been on market 30 days — a 2% lower offer ($89k) is reasonable based on typical stale-listing flexibility.
- 10 sale attempts since 5y ago with the ask held roughly flat each time — persistent listings suggest the price (not the market) is what's stuck; bring a comps-based counter.
Risks & watch-outs
- Watch-outs: property tax is 4.3% of price; built in 1945 — expect roof / HVAC / electrical / plumbing capex.
- Climate carrying-cost: major wind risk, 27% chance of damaging wind over 30y; extreme-heat days projected 7→18/yr by 2055 (HVAC capex compounding) — expect insurance premiums to compound above CPI over the hold.
Questions for the listing agent
- Built in 1945 — when were the roof, HVAC, electrical panel, plumbing, and water heater last replaced?
- Property tax is high relative to price — has the assessment been appealed recently, and will the sale trigger a re-assessment?
- Is there a deadline driving the sale (1031 exchange, divorce, estate, relocation)? That informs how much negotiation room exists.
- What's the average days-on-market for RENTAL listings here right now (not sales)? A rising rental-DOM trend means longer vacancies and softer asking-rent achievability than the comps imply.
- What's the recent tenant-quality profile in this submarket — average credit score on applications, eviction rate, late-payment / NSF rate, and stable-employment percentage? A property-management company in the area should have these aggregated.
- How much new for-sale + rental construction is in the pipeline within 1–3 miles? Heavy new supply typically softens prices + rents 12–24 months out; constrained supply supports both.
Investment metrics
- 1% rule
- 2.16% ✓
- Cap rate
- 15.63%
- Cash-on-cash
- 33.33%
- DSCR
- 2.48
- GRM
- 3.9
CMA / ARV
- ARV (median comp)
- $248,246
- List price
- $89,900
- Delta
- -63.79%
- Verdict
- UNDERPRICED
- Comps
- 20 within 1.0 mi
Show comp detail 12 sales within ~0.75 mi
| Address | Dist | Beds/Ba | Sqft | Sold | Price | $/sf | Match |
|---|---|---|---|---|---|---|---|
| 1688 Oak Knoll Cir SE | 0.18mi | 3/2.0 | 1,160 (+5%) | 2mo | $295,000 | $254 | 82 |
| 1120 Oak Knoll Ter | 0.02mi | 3/1.0 | 1,206 (+9%) | 1mo | $50,000 | $41 | 79 |
| 710 Thomasville Blvd SE | 0.65mi | 3/2.0 | 1,084 (-2%) | 0mo | $213,000 | $196 | 66 |
| 1825 Shadydale Ave SE | 0.58mi | 3/1.5 | 1,046 (-5%) | 0mo | $155,000 | $148 | 62 |
| 366 Wyndham Way SE | 0.60mi | 3/1.0 | 1,147 (+4%) | 2mo | $187,000 | $163 | 60 |
| 36 Park Ave SE | 0.56mi | 4/1.0 (+1) | 1,118 (+1%) | 5mo | $100,000 | $89 | 58 |
| 1864 Shadydale Ave SE | 0.59mi | 3/2.0 | 1,184 (+7%) | 4mo | $259,900 | $220 | 57 |
| 156 Rhodesia Ave SE | 0.42mi | 3/2.0 | 1,259 (+14%) | 1mo | $255,000 | $203 | 56 |
| 1970 Compton Dr SE | 0.63mi | 3/2.0 | 1,000 (-10%) | 5mo | $239,500 | $240 | 51 |
| 5 Adair Ave SE | 0.72mi | 3/1.0 | 1,032 (-7%) | 4mo | $140,000 | $136 | 48 |
| 172 Meador Way SE | 0.75mi | 3/2.0 | 1,000 (-10%) | 3mo | $138,900 | $139 | 47 |
| 85 Meldon Ave SE | 0.71mi | 3/2.0 | 1,232 (+12%) | 2mo | $270,000 | $219 | 46 |
Match score weights: distance 35% · size 25% · config 20% · recency 20%. Top-matched comps best support the ARV.
Projected returns pro-forma
-3.0% appreciation · 3.23% rent growth · sell at horizon
- IRR
- 29.0%
- Equity multiple
- 2.21×
- Total profit
- $30,569
- Equity at exit
- $13,404
- IRR
- 36.6%
- Equity multiple
- 4.43×
- Total profit
- $86,457
- Equity at exit
- $7,773
Cash invested: $25,172 (down + closing). Projections, not guarantees.
Landlord ↔ Tenant lean methodology
- Overall (STATE)
- 90 Strongly Landlord-Friendly
- State Georgia
- 90 Strongly Landlord-Friendly · R+3
- County
- — inherits STATE
- City
- — inherits STATE
ZIP-level market 30315
- Rents YoY
- 3.2%
- Active inventory
- 378
- Price-to-rent
- 3.9×
Monthly cashflow live
- Estimated rent
- $1,939 high interval (Pro) →
- Mortgage (P&I)
- −$471
- Tax from tax record
- −$324 /mo · $3,883/yr
- Insurance
- −$37
- HOA
- −$0
- Vacancy / Maint / Mgmt
- −$407
- Net cashflow
- $699
Break-even live
UW: 25.0% down · 7.5% · 30yr · 1.5% tax · 5.0% vac · 8.0% maint · 8.0% mgmt
Financing live
Cash to close
- Down payment
- $22,475
- Closing costs
- $2,697
- Reserves months
- —
- Total cash needed
- —
Loan-product check · same deal, 3 products live
Conventional
25% down · 7.5% · 30yr
- Down + closing
- —
- Monthly P&I
- —
- Monthly cashflow
- —
- DSCR
- —
- Eligible?
- —
Personal DTI + credit; lowest rate.
DSCR
20% down · 8.5% · 30yr
- Down + closing
- —
- Monthly P&I
- —
- Monthly cashflow
- —
- DSCR
- —
- Eligible?
- —
No personal income docs; deal must DSCR.
Hard money
10% down · 12.0% · 12mo
- Down + closing
- —
- Monthly P&I
- —
- Monthly cashflow
- —
- DSCR
- —
- Eligible?
- —
Short-term bridge; refi at stabilization.
Rent comps 40 comps
| Address | Beds | Baths | Sqft | Rent | $/sqft | DOM | Units | Dist |
|---|---|---|---|---|---|---|---|---|
| 1754 Richmond Cir SE Atlanta, GA | 2.0 | 2.0 | 1200 | $1,750 | $1.46 | 7d | 2 | 0.07mi |
| 1770 Richmond Cir SE Unit 500F Atlanta, GA | 2.0 | 2.0 | 1200 | $1,750 | $1.46 | 24d | 1 | 0.17mi |
| 1770 Richmond Cir SE Unit 1000E Atlanta, GA | 2.0 | 2.0 | 1200 | $1,365 | $1.14 | 24d | 1 | 0.17mi |
| 1875 Conrad Ave SE Atlanta, GA | 3.0 | 2.0 | 1088 | $1,803 | $1.66 | 21d | 1 | 0.49mi |
| 402 McDonough Blvd SE Atlanta, GA | 3.0 | 3.5 | 1270 | $2,350 | $1.85 | 24d | 1 | 0.49mi |
| 340 Adelle St SE Atlanta, GA | 3.0 | 1.0 | 1122 | $1,500 | $1.34 | 2d | 1 | 0.49mi |
| 1515 Jonesboro Rd SE Atlanta, GA | 3.0 | 2.0 | 1360 | $2,300 | $1.69 | 12d | 1 | 0.52mi |
| 41 Meldon Ave SE Atlanta, GA | 4.0 | 1.5 | 1323 | $1,495 | $1.13 | 16d | 1 | 0.56mi |
| 2087 Lakewood Trl SE Atlanta, GA | 3.0 | 2.5 | 1056 | $2,256 | $2.14 | 24d | 1 | 0.63mi |
| 52 Claire Dr SE Atlanta, GA | 2.0 | 2.0 | 800 | $1,750 | $2.19 | 18d | 1 | 0.63mi |
| 1455 Jonesboro Rd SE Atlanta, GA | 2.0 | 1.0 | 700 | $2,000 | $2.86 | 24d | 1 | 0.63mi |
| 95 Thirkield Ave SE Atlanta, GA | 3.0 | 2.0 | 1096 | $1,850 | $1.69 | 15d | 1 | 0.69mi |
| 91 Thirkield Ave SE Atlanta, GA | 2.0 | 1.0 | 1092 | $1,995 | $1.83 | 24d | 1 | 0.69mi |
| 117 Thayer Ave SE Atlanta, GA | 3.0 | 1.0 | 1241 | $1,666 | $1.34 | 13d | 1 | 0.71mi |
| 172 Meador Way SE Atlanta, GA | 3.0 | 2.0 | 1100 | $1,950 | $1.77 | 24d | 1 | 0.77mi |
| 1394 Cozy Cir SE Atlanta, GA | 3.0 | 3.0 | 1500 | $2,850 | $1.90 | 13d | 1 | 0.79mi |
| 672 Cassanova St SE Unit B Atlanta, GA | 2.0 | 1.5 | 1245 | $2,300 | $1.85 | 17d | 1 | 0.79mi |
| 752 McDonough Blvd SE Atlanta, GA | 3.0 | 2.0 | 1120 | $1,895 | $1.69 | 24d | 1 | 0.82mi |
| 141 McDonough Blvd SE Atlanta, GA | 3.0 | 2.0 | 1242 | $2,250 | $1.81 | 24d | 1 | 0.83mi |
| 1267 Zucchini Cir SE Atlanta, GA | 3.0 | 3.0 | 1500 | $3,800 | $2.53 | 24d | 1 | 0.87mi |
| 1267 Zucchini Cir SE Atlanta, GA | 3.0 | 3.0 | 1500 | $3,300 | $2.20 | 7d | 1 | 0.87mi |
| 386 Lindsey Dr SE Atlanta, GA | 3.0 | 1.0 | 1040 | $1,808 | $1.74 | 14d | 1 | 0.90mi |
| 76 Schell Rd SE Atlanta, GA | 3.0 | 1.0 | 1080 | $1,623 | $1.50 | 24d | 1 | 0.91mi |
| 174 Moury Ave SW Atlanta, GA | 1.0–3.0 | 1.0–2.0 | 926 | $1,728 | $1.87 | 2d | 6 | 1.02mi |
| 825 Hank Aaron Dr SW Atlanta, GA | 2.0 | 2.0 | 861 | $1,470 | $1.71 | 24d | 1 | 1.02mi |
| 1940 Fisher Rd SE Atlanta, GA | 2.0 | 1.0 | 760 | $1,300 | $1.71 | 24d | 1 | 1.03mi |
| 430 Englewood Ave SE Atlanta, GA | 3.0 | 1.0–2.0 | 938 | $3,605 | $3.84 | 1d | 28 | 1.03mi |
| 125 Milton Ave SE Atlanta, GA | 2.0 | 1.0–2.0 | 965 | $2,494 | $2.58 | 1d | 29 | 1.07mi |
| 972 Welch St SE Atlanta, GA | 3.0 | 2.0 | 1100 | $900 | $0.82 | 5d | 1 | 1.09mi |
| 250 Amal Dr SW #7009 Atlanta, GA | 3.0 | 2.5 | 1440 | $1,850 | $1.28 | 7d | 1 | 1.11mi |
| 2145 Macon Dr SW Atlanta, GA | 3.0 | 1.0 | 1059 | $1,450 | $1.37 | 24d | 1 | 1.17mi |
| 73 Polar Rock Rd SW Atlanta, GA | 3.0 | 1.0 | 1098 | $1,850 | $1.68 | 10d | 1 | 1.17mi |
| 245 Amal Dr SW #3004 Atlanta, GA | 2.0 | 2.0 | 1402 | $1,800 | $1.28 | 21d | 1 | 1.17mi |
| 1099 Boulevard SE Atlanta, GA | 2.0 | 1.0–2.0 | 928 | $2,294 | $2.47 | 1d | 30 | 1.18mi |
| 200 Guerin Rd Holly Springs, NC | 2.0–3.0 | 1.0–1.5 | 947 | $1,349 | $1.42 | 21d | 1 | 1.22mi |
| 976 McKay Dr SE Atlanta, GA | 3.0 | 1.0 | 1200 | $1,695 | $1.41 | 2d | 1 | 1.23mi |
| 72 Milton Ave SE Atlanta, GA | 2.0 | 1.0–2.0 | 818 | $2,107 | $2.57 | 1d | 24 | 1.27mi |
| 45 Boynton Ave SE Atlanta, GA | 2.0–4.0 | 2.5–4.0 | 1452 | $2,918 | $2.01 | 1d | 15 | 1.27mi |
| 1979 Turner Rd SE Atlanta, GA | 3.0 | 1.0 | 808 | $1,595 | $1.97 | 10d | 1 | 1.31mi |
| 2332 Baywood Dr SE Atlanta, GA | 3.0 | 2.0 | 1100 | $1,400 | $1.27 | 17d | 1 | 1.31mi |
Listing history 32 events
-
2026-06-07statusdays on market $89,900 Pending 30 DOM
-
2026-06-04days on market $89,900 Active 29 DOM
-
2026-06-03days on market $89,900 Active 28 DOM
-
2026-06-02days on market $89,900 Active 27 DOM
-
2026-06-01days on market $89,900 Active 26 DOM
-
2026-05-31days on market $89,900 Active 25 DOM
-
2026-05-06$89,900 New 470-char remark
Show marketing remark (470 chars)
This Is It! Investor Special - Fire-Damaged Property Calling all investors and rehabbers! This home is in need of a full renovation due to fire damage a true blank slate with endless potential. Don't miss this opportunity to transform a property in a rapidly growing area. Conveniently located near schools, shopping, and just minutes from Grant Park, The Beacon, The Beltline, The Westside, Downtown South Atlanta, and major highways. Prime location with strong upside!
-
2026-05-06$89,900 Active 470-char remark
Show marketing remark (470 chars)
This Is It! Investor Special - Fire-Damaged Property Calling all investors and rehabbers! This home is in need of a full renovation due to fire damage a true blank slate with endless potential. Don't miss this opportunity to transform a property in a rapidly growing area. Conveniently located near schools, shopping, and just minutes from Grant Park, The Beacon, The Beltline, The Westside, Downtown South Atlanta, and major highways. Prime location with strong upside!
-
2026-05-06historical
Show marketing remark (470 chars)
This Is It! Investor Special - Fire-Damaged Property Calling all investors and rehabbers! This home is in need of a full renovation due to fire damage a true blank slate with endless potential. Don't miss this opportunity to transform a property in a rapidly growing area. Conveniently located near schools, shopping, and just minutes from Grant Park, The Beacon, The Beltline, The Westside, Downtown South Atlanta, and major highways. Prime location with strong upside!
-
2026-04-30status Back On Market
-
2026-02-04status Under Contract
-
2025-12-22status Back On Market
-
2025-10-28status Under Contract
-
2025-10-15price $89,900
-
2025-09-29status Back On Market
-
2025-08-27status Under Contract
-
2025-08-14$99,900 New
-
2025-07-30historical
-
2025-07-30historical
-
2025-07-13$110,000 Active
-
2025-07-13$110,000 New
-
2021-11-18soldstatus $290,000
-
2021-11-12soldstatus $290,000 Closed
-
2021-11-12soldstatus $290,000 Sold
-
2021-10-26status Pending
-
2021-10-21status Under Contract
-
2021-10-21historical Active Under Contract
-
2021-10-18$279,900 New
-
2021-10-15$279,900 Active
-
1995-04-12soldstatus $43,900
-
1988-04-28soldstatus $28,000
-
1983-08-05soldstatus $21,500
ⓘ Source: listings_history table (triggers on properties + properties_extension) + one-shot
backfill from property_details.listing_events for pre-trigger history.
Tax reassessment forecast GA · Resets to sale price
- Current annual tax
- $3,883 · $324/mo
- Projected year-2 tax
- $3,883 · $324/mo
- Expected delta
- $0/yr ($0/mo · 0.0%)
ⓘ Screening estimate from a state-policy table — verify with the county assessor before closing.
Climate risk First Street
- Flood 1/10 Low FEMA zone X (unshaded) · 0% chance over 30 yrs
- Wildfire 1/10 Low
- Heat 5/10 Major 7 d/yr ≥105°F today · 18 d/yr by 30 yrs out
- Wind 6/10 Major 27% chance of damaging wind over 30 yrs
- Air quality 4/10 Moderate 4 unhealthy d/yr today · 6 by 30 yrs out
Nearby sold comps map
Loading sold comps map…
Walkable amenities ~0.75 mi
Loading nearby amenities…
Taxation est. · year 1
- Rental income
- $23,265
- − Mortgage interest
- −$5,036
- − Property taxes
- −$3,883
- − Insurance
- −$450
- − Repairs & maintenance
- −$1,861
- − Management
- −$1,861
- − Depreciation
- −$2,615
- Taxable income
- $7,559
- Est. tax owed @ 24.0%
- −$1,814
- After-tax cash flow
- $6,575/yr
For passive investors: Depreciation is non-cash, so a rental often shows a tax loss while cash-flowing — sheltering income. Rental losses are passive: they offset passive income freely, and up to $25,000/yr can offset ordinary (W-2) income if you actively participate and your MAGI is under $100k (phasing out to $0 by $150k); unused losses carry forward. On sale, claimed depreciation is recaptured at up to 25%, and gains may owe capital-gains tax (a 1031 exchange can defer both). Figures are a year-1 estimate at your 24.0% rate — not tax advice; consult a CPA.
Schools (NCES district)
- District
- Atlanta Public Schools
- NCES district ID
- 1300120
- Math proficiency
- 28% ▼ -6.00%
- Reading proficiency
- 35% ▼ -2.00%
- Median HH income
- $48,306
- Composite
- 27.27/100
- National rank
- #7006
- State rank
- #80 of 174 in GA
Livability — Atlanta
- Score
- 83/100
- State rank
- #6
- US rank
- #919
Category grades
Schools grade is shown separately in the Schools card above.
Census & demographics
- Census place
- Atlanta, GA
- County
- Fulton County · 1,094,430 people
- City population
- 629,525
- Metro
- Atlanta-Sandy Springs-Alpharetta, GA
- Population (ZIP)
- 34,264
- Household income
- $50,822
- Rent vs Own
- Severe rent burden
- 2962.0
Population outlook (Fulton County) Hauer SSP2
- Today (2025)
- 1,203,707 people
- By 2030
- 1,299,706 · +8.0%
- By 2040
- 1,488,256 · +23.6%
- By 2050
- 1,664,580 · +38.3%
- By 2075
- 2,036,072 · +69.2%
- By 2100
- 2,222,402 · +84.6%
Race, ethnicity, and origin ACS 2023
- Neighborhood character
- Predominantly Black (72%)
- Race & ethnicity
- Black 72% White 14% Hispanic / Latino 10% Two or more races 4%
- Hispanic origin (detail)
- Mexican 4%
- Common ancestry
- Romanian 1% Italian 1% Lithuanian 1%
- Foreign-born
- 5% · Canada
- Languages at home
- 90% English-only · Spanish 9% French/Haitian/Cajun 1%
Political lean MEDSL · Fulton
- 2024 margin
- Solid D (+44.9) · D 71.9% · R 27.0% · Other 1.1%
- 2008→2024 swing
- +9.8pp toward D · 2008: 35.0pp · 2024: 44.9pp
- All cycles
- 2024: D+44.9 2020: D+46.4 2016: D+42.1 2012: D+29.6 2008: D+35.0
Not yet ingested
- Civics
- —
Market trends
- HPI YoY
- ▼ -281.87%
- Current HPI
- 176.673
- Rent YoY
- ▲ 3.23%
- Metro
- Atlanta-Sandy Springs-Alpharetta, GA
- State GDP YoY
- ▲ 2.66%
- F500 in state
- 28
Industry mix (Fortune 500 HQ in GA)
| Industry | F500 HQs | Revenue |
|---|---|---|
| Paper / Packaging | 2 | $29B |
|
||
| Retail | 1 | $160B |
|
||
| Transportation / Logistics | 1 | $91B |
|
||
| Airlines | 1 | $62B |
|
||
| Consumer Goods | 1 | $47B |
|
||
| Utilities | 1 | $25B |
|
||
Price history
+318.1% since first listed28 events — show timeline
- 2026-06-05 Pending — GAMLS
- 2026-06-05 Pending — FMLS
- 2026-05-06 Listing Removed — GAMLS
- 2026-05-06 Listed $89,900 FMLS
- 2026-05-06 Listed $89,900 GAMLS
- 2026-04-30 Relisted — GAMLS
- 2026-02-04 Pending — GAMLS
- 2025-12-22 Relisted — GAMLS
- 2025-10-28 Pending — GAMLS
- 2025-10-15 Price Changed $89,900 GAMLS
- 2025-09-29 Relisted — GAMLS
- 2025-08-27 Pending — GAMLS
- 2025-08-14 Listed $99,900 GAMLS
- 2025-07-30 Listing Removed — FMLS
- 2025-07-30 Listing Removed — GAMLS
- 2025-07-13 Listed $110,000 FMLS
- 2025-07-13 Listed $110,000 GAMLS
- 2021-11-18 Sold (Public Records) $290,000 Public Records
- 2021-11-12 Sold (MLS) $290,000 GAMLS
- 2021-11-12 Sold (MLS) $290,000 FMLS
- 2021-10-26 Pending — FMLS
- 2021-10-21 Pending — GAMLS
- 2021-10-21 Contingent — FMLS
- 2021-10-18 Listed $279,900 GAMLS
- 2021-10-15 Listed $279,900 FMLS
- 1995-04-12 Sold (Public Records) $43,900 Public Records
- 1988-04-28 Sold (Public Records) $28,000 Public Records
- 1983-08-05 Sold (Public Records) $21,500 Public Records
Property tax history
+24.1%/yrLatest (2025): $3,883 · -2.7% YoY. Source: county tax records.
Cash-flow waterfall
monthlySold comps — $/sqft
last 12 mo · ≤1 miLoading sold comps…