 Triplex
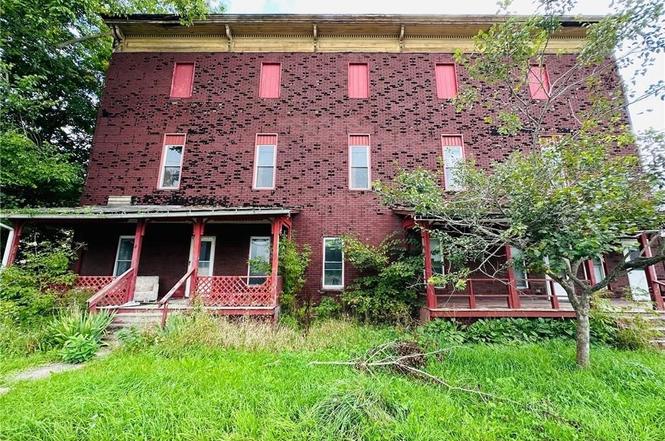
6 Depot St · Antwerp, NY
Flood risk 1/10 · Minimal
- FEMA flood zone
- —
- Chance of flooding over 30 yrs
- 0.0%
- Est. flood insurance / yr
- —
Fire risk 1/10 · Minimal
- Est. fire insurance / yr
- $691 – $1,283
Heat risk 2/10 · Minimal
- Hot days now (above 93°F)
- 7 days/yr
- Hot days in 30 yrs
- 15 days/yr
Wind risk 1/10 · Minimal
- Chance of severe wind over 30 yrs
- —
Air-quality risk 2/10 · Minimal
- Unhealthy air days now
- 0 days/yr
- Unhealthy air days in 30 yrs
- 1 days/yr
Risk factors via First Street. Map © Google.
Why this score? — see what drove the D+ grade
The composite is a weighted blend of 9 inputs, each scored 0–100. Each bar is that input's sub-score; the figure is the points it added to the 100-point composite (weight × sub-score).
- Cash flow +15.0/30.0
- ARV discount +7.5/15.0
- Appreciation +5.4/10.0
- 1% rule +5.0/10.0
- DSCR +5.0/10.0
- Schools +3.5/10.0
- Livability +2.9/5.0
- Rent growth +2.5/5.0
- Condition / age +2.5/5.0
$25,000
🖨 Deal sheet (PDF) 📄 Offer letter ✓ Due diligence
Multi-family units
County records classify this as Multi-Family (2-4 Unit). Listing-text estimate: 3 units. confirmed
Listing remarks MLS
Two rental units and potential for 2 more on the second floor. Priced to sell!!!
Key facts
- 9,737 sq ft lot
- Built 1890
- Listed 281 days
Property features AI
Finance
- Financial info: Building contains 3 rental units (3 separate gas meters and 3 separate electric meters); Operating expense details: see remarks; Tenant responsibility: tenants pay all utilities
Exterior
- Parking: Gravel parking
- Utilities: Public water connected; Sewer connected
- Home design: 3-story multifamily building; Resale property; Wood siding
- Construction: Wood siding construction; Existing structure (previously built)
- Exterior features: Irregular residential lot; Road frontage on a city street and main thoroughfare; Lot dimensions approximately 91 x 107
Interior
- Kitchen: Each 2-bedroom unit includes a dining area with kitchen
- Bedrooms: Three units total: one unit type with unspecified bedrooms (see remarks), and three 2-bedroom units (each with dining area and kitchen)
- Flooring: Carpet; Laminate; Varies by unit
- Bathrooms: Total: 3 full bathrooms and 1 half bathroom in the building; Each 2-bedroom unit includes 1 full bathroom; one unit type lists 1 total bathroom (includes 1 half)
- Heating & cooling: Gas heating (see remarks)
- Interior features: Partial basement; Varied flooring (carpet and laminate)
- Laundry & utility: Water heater included; Tenants pay all utilities
Neighborhood map
What this means for you Summary
Snapshot
- This is a 3 × 2-bed/1.2-bath units multifamily listed at $25k.
Deal economics
- At list price, monthly cash flow is $2k ($29k/yr) — positive. Per door: $799/mo.
- The deal already cash-flows at list — no discount required.
- Meets the 1% rule at list price ($3k rent vs $25k).
- Recommended offer: $22k (12.0% below list) — sets the bar for market timing.
Location & tenants
- Location reads 58/100 on livability (#1,064 in NY) — a working-class tenant base; expect higher turnover. Strengths: cost of living A+, housing A+; Watch: health & safety D, crime F, amenities F.
- Indian River Central School District (rural): math 33% / reading 50% proficiency, ranked #502 of 590 in NY (top 85%) — families likely to look elsewhere, expect single-tenant / working-renter base with shorter leases.
- Zoned schools: Antwerp Primary School (math 24% / reading 34%, grade F, #1,729 of 2,108 statewide, top 84%, 185 students, 54% FRL); Indian River Middle School (math 26% / reading 50%, grade F, #442 of 729 statewide, top 61%, 672 students, 60% FRL); Indian River High School (math 98% / reading 90%, grade A+, #124 of 1,100 statewide, top 12%, 781 students, 49% FRL) — zoned schools average 55% FRL vs 28% district-wide (27 pts higher); higher-poverty schools than district average — tighter screening recommended.
- Zoned-school proficiency averages 54% at this address vs 42% district-wide (+12 pts) — the actual schools serving this property are materially stronger than the Indian River Central School District average implies; a family-tenant draw the district grade alone would hide.
- Market conditions: 19 active listings in the ZIP; 196 units permitted in Jefferson County in 2024 (0 in 5+ unit buildings).
Forward outlook
- In year one you build about $370 of equity ($173 loan paydown + $197 appreciation (0.8% local appreciation)).
- Jefferson County population projected at -12% by 2050 — secular population decline; favor cash flow + early exit over multi-decade hold.
- At projected returns (0.8% appreciation + 3.0% rent growth), your $7k cash investment doubles in ~1 year — after that, you're playing with house money.
Negotiation context
- It's been on market 282 days — a 12% lower offer ($22k) is reasonable based on typical stale-listing flexibility.
- 4 sale attempts since 8y ago; this cycle's ask has dropped $5k (17%) from the opening price — seller is motivated, your offer sets the floor, not the list.
- Current owner paid $20k; 26% above their basis — modest negotiation headroom, anchor on the comps not their cost.
Risks & watch-outs
- Watch-outs: built in 1890 — expect roof / HVAC / electrical / plumbing capex.
Questions for the listing agent
- It's been on market 282 days. Have you received any prior offers? Is the seller open to a 12% concession, seller financing, or rate buy-down credit?
- Can we see the unit-by-unit rent roll, current vacancy, and any below-market leases? What's the average tenancy length?
- What capital expenditures (roof, boiler, parking lot, exteriors) have been made in the last 5 years, and what's planned in the next 2?
- Built in 1890 — when were the roof, HVAC, electrical panel, plumbing, and water heater last replaced?
- Why hasn't it sold? Are there any deal-killer items the seller is aware of (foundation, flood, title, zoning, code violations)?
- Is there a deadline driving the sale (1031 exchange, divorce, estate, relocation)? That informs how much negotiation room exists.
- Crime grade is F in this area — have there been break-ins, vandalism, or insurance claims at this property in the last 3 years? What carrier currently insures it and at what premium?
- The area grade is low — what's the realistic commute time and amenity access for the typical tenant pool here? Any planned neighborhood developments (good or bad) we should know about?
- What's the average days-on-market for RENTAL listings here right now (not sales)? A rising rental-DOM trend means longer vacancies and softer asking-rent achievability than the comps imply.
- What's the recent tenant-quality profile in this submarket — average credit score on applications, eviction rate, late-payment / NSF rate, and stable-employment percentage? A property-management company in the area should have these aggregated.
- How much new apartment / multifamily construction is in the pipeline within 1–3 miles? Heavy new supply (>2% of stock underway) typically softens rents 12–24 months out; light construction supports rent growth.
Investment metrics
- 1% rule
- 13.01% ✓
- Cap rate
- 121.32%
- Cash-on-cash
- 410.80%
- DSCR
- 19.28
- GRM
- 0.6
CMA / ARV
No comps found within radius.
Projected returns pro-forma
0.79% appreciation · 3.0% rent growth · sell at horizon
- IRR
- —
- Equity multiple
- 22.84×
- Total profit
- $152,879
- Equity at exit
- $8,258
- IRR
- —
- Equity multiple
- 48.75×
- Total profit
- $334,226
- Equity at exit
- $10,763
Cash invested: $7,000 (down + closing). Projections, not guarantees.
Landlord ↔ Tenant lean methodology
- Overall (STATE)
- 15 Strongly Tenant-Friendly
- State New York
- 15 Strongly Tenant-Friendly · D+10
- County
- — inherits STATE
- City
- — inherits STATE
ZIP-level market 13608
- Home prices YoY
- 0.1%
- Active inventory
- 19
- Price-to-rent
- 1.9×
Monthly cashflow live
- Estimated rent
- $3,252 medium interval (Pro) →
- Mortgage (P&I)
- −$131
- Tax est. 1.5%
- −$31 /mo · $375/yr
- Insurance
- −$10
- HOA
- −$0
- Vacancy / Maint / Mgmt
- −$683
- Net cashflow
- $2,396
Break-even live
Sensitivity live
| Price | -10% $2,414 | -5% $2,405 | +0% $2,396 | +5% $2,388 | +10% $2,379 |
|---|---|---|---|---|---|
| Rent | -10% $2,139 | -5% $2,268 | +0% $2,396 | +5% $2,525 | +10% $2,653 |
| Rate | -1.0pp $2,409 | -0.5pp $2,403 | base $2,396 | +0.5pp $2,390 | +1.0pp $2,383 |
3-unit breakdown (identical units grouped — click to expand)
| Units | Beds | Baths | Est. rent |
|---|---|---|---|
| 3× units | 2 | 1.2 | $3,252 |
| #1 | 2 | 1.2 | $1,084 |
| #2 | 2 | 1.2 | $1,084 |
| #3 | 2 | 1.2 | $1,084 |
| Total (3 units) | $3,252 | ||
UW: 25.0% down · 7.5% · 30yr · 1.5% tax · 5.0% vac · 8.0% maint · 8.0% mgmt
Financing live
Cash to close
- Down payment
- $6,250
- Closing costs
- $750
- Reserves months
- —
- Total cash needed
- —
Loan-product check · same deal, 3 products live
Conventional
25% down · 7.5% · 30yr
- Down + closing
- —
- Monthly P&I
- —
- Monthly cashflow
- —
- DSCR
- —
- Eligible?
- —
Personal DTI + credit; lowest rate.
DSCR
20% down · 8.5% · 30yr
- Down + closing
- —
- Monthly P&I
- —
- Monthly cashflow
- —
- DSCR
- —
- Eligible?
- —
No personal income docs; deal must DSCR.
Hard money
10% down · 12.0% · 12mo
- Down + closing
- —
- Monthly P&I
- —
- Monthly cashflow
- —
- DSCR
- —
- Eligible?
- —
Short-term bridge; refi at stabilization.
Listing history 29 events
-
2026-06-19days on market $25,000 Active 282 DOM
-
2026-06-18days on market $25,000 Active 281 DOM
-
2026-06-17days on market $25,000 Active 280 DOM
-
2026-06-16days on market $25,000 Active 279 DOM
-
2026-06-15days on market $25,000 Active 278 DOM
-
2026-06-14days on market $25,000 Active 276 DOM
-
2026-06-12days on market $25,000 Active 275 DOM
-
2026-06-09days on market $25,000 Active 272 DOM
-
2026-06-08days on market $25,000 Active 271 DOM
-
2026-06-07days on market $25,000 Active 270 DOM
-
2026-06-05days on market $25,000 Active 267 DOM
-
2026-06-03days on market $25,000 Active 266 DOM
-
2026-06-02days on market $25,000 Active 265 DOM
-
2026-06-01days on market $25,000 Active 264 DOM
-
2026-05-31days on market $25,000 Active 263 DOM
-
2026-05-30days on market $25,000 Active 262 DOM
-
2026-03-06status Active
-
2026-02-24historical Active Under Contract
-
2025-12-10price $25,000
-
2025-09-10$30,000 Active
-
2024-10-17historical
-
2024-10-16historical Active Under Contract
-
2024-08-15price $35,000
-
2024-07-09price $39,900
-
2023-11-22price $44,900
-
2023-09-14price $49,900
-
2023-08-30$59,900 Active
-
2019-04-22soldstatus $19,900 80-char remark
Show marketing remark (80 chars)
Two rental units and potential for 2 more on the second floor. Priced to sell!!!
-
2018-06-22$19,900 80-char remark
Show marketing remark (80 chars)
Two rental units and potential for 2 more on the second floor. Priced to sell!!!
ⓘ Source: listings_history table (triggers on properties + properties_extension) + one-shot
backfill from property_details.listing_events for pre-trigger history.
Climate risk First Street
- Flood 1/10 Low 0% chance over 30 yrs
- Wildfire 1/10 Low
- Heat 2/10 Low 7 d/yr ≥93°F today · 15 d/yr by 30 yrs out
- Wind 1/10 Low
- Air quality 2/10 Low 0 unhealthy d/yr today · 1 by 30 yrs out
Nearby sold comps map
Loading sold comps map…
Walkable amenities ~0.75 mi
Loading nearby amenities…
Taxation est. · year 1
- Rental income
- $39,024
- − Mortgage interest
- −$1,400
- − Property taxes
- −$375
- − Insurance
- −$125
- − Repairs & maintenance
- −$3,122
- − Management
- −$3,122
- − Depreciation
- −$727
- Taxable income
- $30,152
- Est. tax owed @ 24.0%
- −$7,237
- After-tax cash flow
- $21,519/yr
For passive investors: Depreciation is non-cash, so a rental often shows a tax loss while cash-flowing — sheltering income. Rental losses are passive: they offset passive income freely, and up to $25,000/yr can offset ordinary (W-2) income if you actively participate and your MAGI is under $100k (phasing out to $0 by $150k); unused losses carry forward. On sale, claimed depreciation is recaptured at up to 25%, and gains may owe capital-gains tax (a 1031 exchange can defer both). Figures are a year-1 estimate at your 24.0% rate — not tax advice; consult a CPA.
Schools (NCES district)
- District
- Indian River Central School District
- NCES district ID
- 3615300
- Math proficiency
- 33% ▼ -21.00%
- Reading proficiency
- 50% ▲ 1.00%
- Median HH income
- $45,599
- Composite
- 35.25/100
- National rank
- #4977
- State rank
- #502 of 590 in NY
Livability — Antwerp
- Score
- 58/100
- State rank
- #1064
- US rank
- #21270
Category grades
Schools grade is shown separately in the Schools card above.
Census & demographics
- Census place
- Antwerp, NY
- Population (ZIP)
- 1,845
Population outlook (Jefferson County) Hauer SSP2
- Today (2025)
- 111,748 people
- By 2030
- 109,370 · -2.1%
- By 2040
- 103,828 · -7.1%
- By 2050
- 98,523 · -11.8%
- By 2075
- 91,422 · -18.2%
- By 2100
- 78,214 · -30.0%
Race, ethnicity, and origin ACS 2023
- Neighborhood character
- Predominantly White (89%)
- Race & ethnicity
- White 89% Two or more races 7% Hispanic / Latino 3%
- Common ancestry
- Slovak 5% Iranian 4% Lithuanian 4%
- Foreign-born
- 2% · Canada
- Languages at home
- 97% English-only · German/W. Germanic 2% Spanish 1%
Political lean MEDSL · Jefferson
- 2024 margin
- Strong R (+23.6) · D 38.2% · R 61.8%
- 2008→2024 swing
- -18.3pp toward R · 2008: -5.3pp · 2024: -23.6pp
- All cycles
- 2024: R+23.6 2020: R+19.0 2016: R+22.4 2012: R+2.9 2008: R+5.3
Not yet ingested
- Civics
- —
Market trends
- HPI YoY
- ▲ 0.79%
- Current HPI
- 582.0014
- Rent YoY
- —
- Metro
- —
- State GDP YoY
- ▲ 2.60%
- F500 in state
- 92
Industry mix (Fortune 500 HQ in NY)
| Industry | F500 HQs | Revenue |
|---|---|---|
| Financial Services | 10 | $950B |
|
||
| Consumer Goods | 9 | $162B |
|
||
| Insurance | 4 | $225B |
|
||
| Telecommunications | 2 | $144B |
|
||
| Pharmaceuticals | 2 | $112B |
|
||
| Media / Entertainment | 2 | $69B |
|
||
Price history
+25.6% since first listed13 events — show timeline
- 2026-03-06 Relisted — CNYIS
- 2026-02-24 Contingent — CNYIS
- 2025-12-10 Price Changed $25,000 CNYIS
- 2025-09-10 Listed $30,000 CNYIS
- 2024-10-17 Listing Removed — CNYIS
- 2024-10-16 Contingent — CNYIS
- 2024-08-15 Price Changed $35,000 CNYIS
- 2024-07-09 Price Changed $39,900 CNYIS
- 2023-11-22 Price Changed $44,900 CNYIS
- 2023-09-14 Price Changed $49,900 CNYIS
- 2023-08-30 Listed $59,900 CNYIS
- 2019-04-22 Sold (MLS) $19,900 CNYIS
- 2018-06-22 Listed $19,900 CNYIS
Cash-flow waterfall
monthlySold comps — $/sqft
last 12 mo · ≤1 miLoading sold comps…