104 Thomas Cir · Augusta-Richmond County consolidated government (balance), GA
Flood risk 1/10 · Minimal
- FEMA flood zone
- X (unshaded)
- Chance of flooding over 30 yrs
- 0.0%
- Est. flood insurance / yr
- $507 – $1,088
Fire risk 3/10 · Minor
- Est. fire insurance / yr
- $963 – $1,789
Heat risk 8/10 · Major
- Hot days now (above 109°F)
- 7 days/yr
- Hot days in 30 yrs
- 17 days/yr
Wind risk 6/10 · Moderate
- Chance of severe wind over 30 yrs
- 67.0%
Air-quality risk 3/10 · Minor
- Unhealthy air days now
- 3 days/yr
- Unhealthy air days in 30 yrs
- 3 days/yr
Risk factors via First Street. Map © Google.
Why this score? — see what drove the D+ grade
The composite is a weighted blend of 9 inputs, each scored 0–100. Each bar is that input's sub-score; the figure is the points it added to the 100-point composite (weight × sub-score).
- Cash flow +25.9/30.0
- DSCR +8.7/10.0
- 1% rule +5.8/10.0
- Livability +2.5/5.0
- Condition / age +2.5/5.0
- Rent growth +2.4/5.0
- Schools +1.3/10.0
- ARV discount +0.0/15.0
- Appreciation +0.0/10.0
$119,900
🖨 Deal sheet 📄 Offer letter ✓ Due diligence
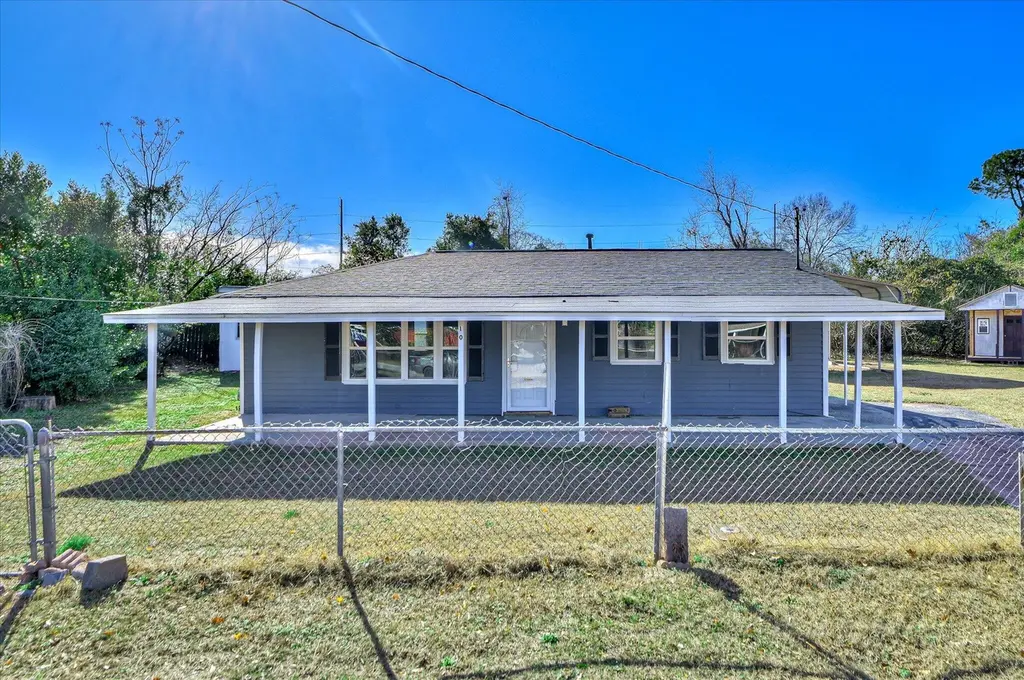
Listing remarks
Discover the perfect blend of comfort and convenience in this delightful 3-bedroom home, nestled on a quiet, traffic-free cul-de-sac. This low maintenance home is situated in a fully fenced yard that features multiple outbuildings and a 22'x25' RV carport with 30 amp service. There is also a 400 square foot covered front porch perfect for entertaining and relaxing.
Key facts
- 0.31 acre lot
- Built 1953
Neighborhood map
What this means for you Summary
Snapshot
- This is a 3-bed/1.0-bath single-family listed at $120k.
Deal economics
- At list price, monthly cash flow is $296 ($4k/yr) — positive.
- The deal already cash-flows at list — no discount required.
- Meets the 1% rule at list price ($1k rent vs $120k).
- Cap rate 9.3% vs local median 5.3% in Augusta-Richmond County consolidated government (balance) — top-decile yield for the area; either an underpriced asset or a hidden risk that comps aren't pricing in. Stress-test before assuming the spread holds.
Location & tenants
- Location reads: area grade D — affects rentability + tenant quality, not the cash-flow math above.
- Richmond County (urban): math 12% / reading 20% proficiency, ranked #154 of 174 in GA (top 88%) — low school quality limits family demand, transient renter base, plan for 1-2y turnover; 72% free/reduced lunch — lower-income household profile, screen leases tightly.
- Market conditions: Rents soft (-0.2%/yr); 364 active listings in the ZIP; 12 comparable units currently listed for rent nearby; rentals lingering (median 44d on market — plan ~5-8 weeks vacancy on turnover, expect pricing pressure); 75% of comp listings sitting > 30 days — soft ceiling on asking rent; 561 units permitted in Richmond County in 2024 (0 in 5+ unit buildings).
- This rent runs 34% of the median local income ($46k/yr) — at the standard rent-burdened threshold; future hikes will face affordability resistance.
Forward outlook
- Local home prices are declining (-3.0%/yr); year-one equity from $829 of loan paydown is wiped out by about $4k of value loss. Plan a longer hold.
- Richmond County population projected to shrink 5% by 2050 — rents likely to lag national; underwrite the cash flow, not the appreciation.
Negotiation context
- Only 0 days on market — expect competitive offers; lowballing is unlikely to land.
- 2 sale attempts with the ask held roughly flat each time — persistent listings suggest the price (not the market) is what's stuck; bring a comps-based counter.
- Current owner paid $66k; list at $120k implies a 82% gain — meaningful room to come down on a strong offer.
Risks & watch-outs
- Watch-outs: built in 1953 — expect roof / HVAC / electrical / plumbing capex.
- Climate carrying-cost: major wind risk, 67% chance of damaging wind over 30y; extreme-heat days projected 7→17/yr by 2055 (HVAC capex compounding) — expect insurance premiums to compound above CPI over the hold.
Questions for the listing agent
- Built in 1953 — when were the roof, HVAC, electrical panel, plumbing, and water heater last replaced?
- Is there a deadline driving the sale (1031 exchange, divorce, estate, relocation)? That informs how much negotiation room exists.
- The area grade is low — what's the realistic commute time and amenity access for the typical tenant pool here? Any planned neighborhood developments (good or bad) we should know about?
- What's the average days-on-market for RENTAL listings here right now (not sales)? A rising rental-DOM trend means longer vacancies and softer asking-rent achievability than the comps imply.
- What's the recent tenant-quality profile in this submarket — average credit score on applications, eviction rate, late-payment / NSF rate, and stable-employment percentage? A property-management company in the area should have these aggregated.
- How much new for-sale + rental construction is in the pipeline within 1–3 miles? Heavy new supply typically softens prices + rents 12–24 months out; constrained supply supports both.
Investment metrics
- 1% rule
- 1.08% ✓
- Cap rate
- 9.26%
- Cash-on-cash
- 10.60%
- DSCR
- 1.47
- GRM
- 7.7
CMA / ARV
- ARV (on-the-fly)
- $93,120
- Comps found
- 12
Show comp detail 12 sales within ~0.75 mi
| Address | Dist | Beds/Ba | Sqft | Sold | Price | $/sf | Match |
|---|---|---|---|---|---|---|---|
| 3326 Sylvester Dr | 0.42mi | 3/1.0 | 960 (0%) | 5mo | $149,900 | $156 | 76 |
| 1911 Dianne Dr | 0.34mi | 3/1.0 | 1,004 (+5%) | 3mo | $105,000 | $105 | 74 |
| 1914 Gay Dr | 0.14mi | 3/1.0 | 894 (-7%) | 10mo | $76,150 | $85 | 74 |
| 1825 Medlar St | 0.57mi | 3/1.5 | 1,000 (+4%) | 2mo | $97,000 | $97 | 63 |
| 2517 Argonne Dr | 0.48mi | 3/1.0 | 888 (-8%) | 2mo | $46,000 | $52 | 63 |
| 1919 Moore Rd | 0.27mi | 3/2.0 | 1,082 (+13%) | 0mo | $170,000 | $157 | 62 |
| 1944 Williams Dr | 0.41mi | 2/1.0 (-1) | 935 (-3%) | 12mo | $47,000 | $50 | 61 |
| 2904 Old Louisville Rd | 0.34mi | 2/1.0 (-1) | 864 (-10%) | 3mo | $76,000 | $88 | 60 |
| 3110 Ashmore Dr | 0.10mi | 2/1.0 (-1) | 826 (-14%) | 9mo | $72,000 | $87 | 60 |
| 1912 Roberson Rd | 0.22mi | 3/1.0 | 1,080 (+12%) | 11mo | $125,000 | $116 | 59 |
| 1811 Alder Dr | 0.54mi | 3/1.0 | 888 (-8%) | 7mo | $62,000 | $70 | 57 |
| 2413 Yates Dr | 0.73mi | 3/1.0 | 888 (-8%) | 6mo | $112,300 | $126 | 48 |
Match score weights: distance 35% · size 25% · config 20% · recency 20%. Top-matched comps best support the ARV.
Projected returns pro-forma
-3.0% appreciation · 0.0% rent growth · sell at horizon
- IRR
- -3.6%
- Equity multiple
- 0.87×
- Total profit
- $-4,395
- Equity at exit
- $17,877
- IRR
- 2.7%
- Equity multiple
- 1.17×
- Total profit
- $5,607
- Equity at exit
- $10,367
Cash invested: $33,572 (down + closing). Projections, not guarantees.
Landlord ↔ Tenant lean methodology
- Overall (STATE)
- 90 Strongly Landlord-Friendly
- State Georgia
- 90 Strongly Landlord-Friendly · R+3
- County
- — inherits STATE
- City
- — inherits STATE
ZIP-level market 30906
- Home prices YoY
- -21.6%
- Rents YoY
- -0.2%
- Active inventory
- 364
- Price-to-rent
- 7.7×
Monthly cashflow live
- Estimated rent
- $1,299 high interval (Pro) →
- Mortgage (P&I)
- −$629
- Tax from tax record
- −$51 /mo · $612/yr
- Insurance
- −$50
- HOA
- −$0
- Vacancy / Maint / Mgmt
- −$273
- Net cashflow
- $296
Break-even live
UW: 25.0% down · 7.5% · 30yr · 1.5% tax · 5.0% vac · 8.0% maint · 8.0% mgmt
Financing live
Cash to close
- Down payment
- $29,975
- Closing costs
- $3,597
- Reserves months
- —
- Total cash needed
- —
Loan-product check · same deal, 3 products live
Conventional
25% down · 7.5% · 30yr
- Down + closing
- —
- Monthly P&I
- —
- Monthly cashflow
- —
- DSCR
- —
- Eligible?
- —
Personal DTI + credit; lowest rate.
DSCR
20% down · 8.5% · 30yr
- Down + closing
- —
- Monthly P&I
- —
- Monthly cashflow
- —
- DSCR
- —
- Eligible?
- —
No personal income docs; deal must DSCR.
Hard money
10% down · 12.0% · 12mo
- Down + closing
- —
- Monthly P&I
- —
- Monthly cashflow
- —
- DSCR
- —
- Eligible?
- —
Short-term bridge; refi at stabilization.
Rent comps 12 comps
| Address | Beds | Baths | Sqft | Rent | $/sqft | DOM | Units | Dist |
|---|---|---|---|---|---|---|---|---|
| 2932 Abelia Dr Augusta, GA | 3.0 | 1.0 | 888 | $1,100 | $1.24 | 43d | 1 | 0.35mi |
| 3211 Kevin Dr Augusta, GA | 3.0 | 1.5 | 1005 | $1,275 | $1.27 | 23d | 1 | 0.38mi |
| 3211 Kevin Dr Augusta, GA | 3.0 | 1.5 | 1005 | $1,275 | $1.27 | 43d | 1 | 0.38mi |
| 1822 Catalina Dr Augusta, GA | 3.0 | 1.0 | 888 | $1,350 | $1.52 | 23d | 1 | 0.45mi |
| 1822 Catalina Dr Augusta, GA | 3.0 | 1.0 | 888 | $1,350 | $1.52 | 43d | 1 | 0.45mi |
| 2006 Denmark Dr Augusta, GA | 3.0 | 1.0 | 1033 | $1,100 | $1.06 | 44d | 1 | 0.94mi |
| 2006 Denmark Dr Augusta, GA | 3.0 | 1.0 | 1033 | $1,100 | $1.06 | 43d | 1 | 0.94mi |
| 2111 Cadden Rd Augusta, GA | 3.0 | 1.0 | 1100 | $1,150 | $1.05 | 43d | 1 | 1.13mi |
| 2119 Lumpkin Rd Augusta, GA | 2.0 | 1.0–1.5 | 974 | $912 | $0.94 | 21d | 6 | 1.20mi |
| 2235 Woodward Ave Augusta, GA | 2.0 | 1.0 | 773 | $895 | $1.16 | 44d | 1 | 1.45mi |
| 2401 Norfolk St Augusta, GA | 2.0 | 1.0 | 991 | $949 | $0.96 | 43d | 1 | 1.46mi |
| 2910 Richmond Hill Rd Augusta, GA | 2.0 | 1.0 | 1000 | $900 | $0.90 | 43d | 3 | 1.48mi |
Listing history 8 events
-
2026-01-23status Pending
-
2026-01-23historical
-
2026-01-22historical
-
2026-01-16price $119,900
-
2026-01-01$125,000 Active
-
2026-01-01$119,900
-
2025-09-15soldstatus $66,000
-
2025-09-11soldstatus $58,000
ⓘ Source: listings_history table (triggers on properties + properties_extension) + one-shot
backfill from property_details.listing_events for pre-trigger history.
Tax reassessment forecast GA · Resets to sale price
- Current annual tax
- $612 · $51/mo
- Projected year-2 tax
- $1,103 · $92/mo
- Expected delta
- +$491/yr (+$41/mo · 80.1%)
ⓘ Screening estimate from a state-policy table — verify with the county assessor before closing.
Climate risk First Street
- Flood 1/10 Low FEMA zone X (unshaded) · 0% chance over 30 yrs
- Wildfire 3/10 Moderate
- Heat 8/10 Severe 7 d/yr ≥109°F today · 17 d/yr by 30 yrs out
- Wind 6/10 Major 67% chance of damaging wind over 30 yrs
- Air quality 3/10 Moderate 3 unhealthy d/yr today · 3 by 30 yrs out
Nearby sold comps map
Loading sold comps map…
Walkable amenities ~0.75 mi
Loading nearby amenities…
Taxation est. · year 1
- Rental income
- $15,588
- − Mortgage interest
- −$6,716
- − Property taxes
- −$612
- − Insurance
- −$600
- − Repairs & maintenance
- −$1,247
- − Management
- −$1,247
- − Depreciation
- −$3,488
- Taxable income
- $1,678
- Est. tax owed @ 24.0%
- −$403
- After-tax cash flow
- $3,155/yr
For passive investors: Depreciation is non-cash, so a rental often shows a tax loss while cash-flowing — sheltering income. Rental losses are passive: they offset passive income freely, and up to $25,000/yr can offset ordinary (W-2) income if you actively participate and your MAGI is under $100k (phasing out to $0 by $150k); unused losses carry forward. On sale, claimed depreciation is recaptured at up to 25%, and gains may owe capital-gains tax (a 1031 exchange can defer both). Figures are a year-1 estimate at your 24.0% rate — not tax advice; consult a CPA.
Schools (NCES district)
- District
- Richmond County
- NCES district ID
- 1304380
- Math proficiency
- 12% ▼ -9.00%
- Reading proficiency
- 20% ▼ -6.00%
- Median HH income
- $38,069
- Composite
- 13.43/100
- National rank
- #9524
- State rank
- #154 of 174 in GA
Livability — Augusta-Richmond County consolidated government (balance)
No livability data for this city. (Only ~50 U.S. cities are tracked.)
Census & demographics
- Census place
- Augusta-Richmond County consolidated government (balance), GA
- County
- Richmond County · 190,917 people
- City population
- 154,035
- Metro
- Augusta-Richmond County, GA-SC
- Population (ZIP)
- 60,423
- Household income
- $45,999
- Rent vs Own
- Severe rent burden
- 3363.0
Population outlook (Richmond County) Hauer SSP2
- Today (2025)
- 200,753 people
- By 2030
- 200,232 · -0.3%
- By 2040
- 196,813 · -2.0%
- By 2050
- 190,347 · -5.2%
- By 2075
- 172,496 · -14.1%
- By 2100
- 146,284 · -27.1%
Race, ethnicity, and origin ACS 2023
- Neighborhood character
- Majority Black (64%)
- Race & ethnicity
- Black 64% White 27% Two or more races 5% Hispanic / Latino 5%
- Common ancestry
- Lithuanian 1%
- Foreign-born
- 2% · Canada
- Languages at home
- 95% English-only · Spanish 3% German/W. Germanic 1%
Political lean MEDSL · Richmond
- 2024 margin
- Solid D (+36.1) · D 67.8% · R 31.7%
- 2008→2024 swing
- +4.3pp toward D · 2008: 31.8pp · 2024: 36.1pp
- All cycles
- 2024: D+36.1 2020: D+37.2 2016: D+32.4 2012: D+33.8 2008: D+31.8
Not yet ingested
- Civics
- —
Market trends
- HPI YoY
- ▼ -58.99%
- Current HPI
- 213.5733
- Rent YoY
- ▼ -0.25%
- Metro
- Augusta-Richmond County, GA-SC
- State GDP YoY
- ▲ 2.66%
- F500 in state
- 28
Industry mix (Fortune 500 HQ in GA)
| Industry | F500 HQs | Revenue |
|---|---|---|
| Paper / Packaging | 2 | $29B |
|
||
| Retail | 1 | $160B |
|
||
| Transportation / Logistics | 1 | $91B |
|
||
| Airlines | 1 | $62B |
|
||
| Consumer Goods | 1 | $47B |
|
||
| Utilities | 1 | $25B |
|
||
Price history
+106.7% since first listed8 events — show timeline
- 2026-01-23 Pending — Hive MLS
- 2026-01-23 Listing Removed — Hive MLS
- 2026-01-22 Listing Removed — Hive MLS
- 2026-01-16 Price Changed $119,900 Hive MLS
- 2026-01-01 Listed $119,900 Hive MLS
- 2026-01-01 Listed $125,000 Hive MLS
- 2025-09-15 Sold (Public Records) $66,000 Public Records
- 2025-09-11 Sold (Public Records) $58,000 Public Records
Property tax history
+0.2%/yrLatest (2025): $612 · +9.8% YoY. Source: county tax records.
Cash-flow waterfall
monthlySold comps — $/sqft
last 12 mo · ≤1 miLoading sold comps…