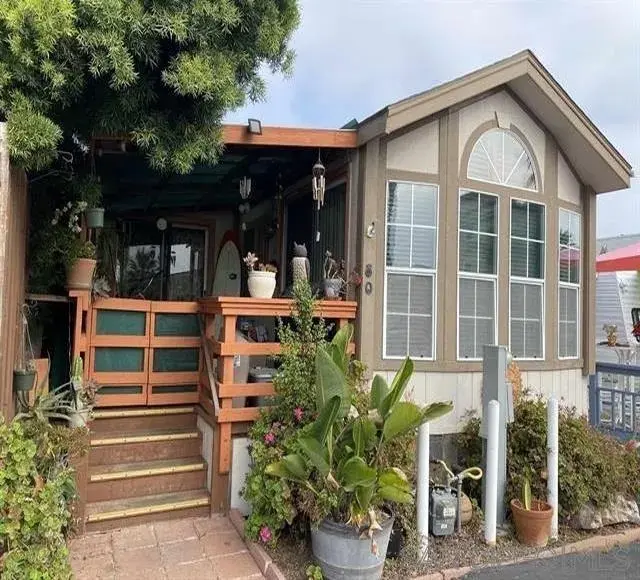
900 N Cleveland St #80 · Oceanside, CA
Flood risk 1/10 · Minimal
- FEMA flood zone
- X (unshaded)
- Chance of flooding over 30 yrs
- 0.0%
- Est. flood insurance / yr
- $507 – $1,088
Fire risk 1/10 · Minimal
- Est. fire insurance / yr
- $659 – $1,223
Heat risk 5/10 · Moderate
- Hot days now (above 83°F)
- 7 days/yr
- Hot days in 30 yrs
- 20 days/yr
Wind risk 1/10 · Minimal
- Chance of severe wind over 30 yrs
- —
Air-quality risk 4/10 · Minor
- Unhealthy air days now
- 4 days/yr
- Unhealthy air days in 30 yrs
- 5 days/yr
Risk factors via First Street. Map © Google.
Why this score? — see what drove the B- grade
The composite is a weighted blend of 9 inputs, each scored 0–100. Each bar is that input's sub-score; the figure is the points it added to the 100-point composite (weight × sub-score).
- Cash flow +27.3/30.0
- ARV discount +13.1/15.0
- DSCR +9.5/10.0
- 1% rule +7.4/10.0
- Schools +3.6/10.0
- Rent growth +3.2/5.0
- Livability +3.2/5.0
- Condition / age +2.5/5.0
- Appreciation +0.0/10.0
$199,000
🖨 Deal sheet 📄 Offer letter ✓ Due diligence
Listing remarks
Come live at the beach in this 1BD, 1BA 600 SF 1997 manufactured home today! Remodeled and move in ready. Whole house stereo system. Huge covered front porch with one of the few shade trees in the park. Large private back yard and storage shed for all your beach toys. Enjoy life in this gated community with pool, community room and community garden. Walk to the beach, harbor or downtown to enjoy all of the local ammenities and dining. All of this and NO Property Taxes!
Key facts
- Gated community
- Storage shed
- Parking
Tags
Property features AI
Finance
- Other: Located on common-interest lot (common area ownership)
- HOA & community: Community pool and clubhouse; Senior community; Breed restrictions for pets
Exterior
- Parking: Assigned parking; 1 parking space
- Security: Gated community
- Utilities: Public water; Public sewer
- Home design: Manufactured home; Single-story; Located in a senior community; Subdivision: OCEANSIDE; Building name: Mira Mar
- Construction: HardiPlank-type exterior; Composition roof; 1 story
- Exterior features: Porch; Partial fencing; Community pool; Clubhouse; Shed(s); Private maintained road
Interior
- Kitchen: Refrigerator; Built-in range; Range; Oven
- Bedrooms: 1 bedroom (possible)
- Flooring: Laminate; Linoleum; Vinyl
- Bathrooms: 1 full bathroom
- Heating & cooling: Central air conditioning; Forced air heating; Natural gas heating
- Interior features: Refrigerator; Built-in range / Oven; Range
- Laundry & utility: Laundry in common area
Neighborhood map
What this means for you Summary
Snapshot
- This is a 1-bed/1.0-bath manufactured listed at $199k.
Deal economics
- At list price, monthly cash flow is $574 ($7k/yr) — positive.
- The deal already cash-flows at list — no discount required.
- Meets the 1% rule at list price ($2k rent vs $199k).
- Cap rate 9.8% vs local median 2.5% in Oceanside — top-decile yield for the area; either an underpriced asset or a hidden risk that comps aren't pricing in. Stress-test before assuming the spread holds.
Location & tenants
- Location reads 64/100 on livability (#413 in CA) — a middle-class / working-renter tenant base. Strengths: amenities A+, commute A+, employment A; Watch: schools D+, crime D, cost of living F.
- Oceanside Unified (suburban): math 31% / reading 51% proficiency, ranked #221 of 517 in CA (top 43%) — families likely to look elsewhere, expect single-tenant / working-renter base with shorter leases.
- Market conditions: Rents rising (+3.0%/yr); 165 active listings in the ZIP; 30 comparable units currently listed for rent nearby; rentals at typical pace (median 17d on market — plan ~3-4 weeks tenant-placement turnaround); solid renter incomes; 11,759 units permitted in San Diego County in 2024 (7,244 in 5+ unit buildings).
- This rent runs 36% of the median local income ($82k/yr) — at the standard rent-burdened threshold; future hikes will face affordability resistance.
Forward outlook
- Local home prices are declining (-3.0%/yr); year-one equity from $1k of loan paydown is wiped out by about $6k of value loss. Plan a longer hold.
- San Diego County population projected at +20% by 2050 — long-run rental-demand tailwind backs the buy-and-hold thesis.
- At projected returns (-3.0% appreciation + 3.0% rent growth), your $56k cash investment doubles in ~10 years — after that, you're playing with house money.
Negotiation context
- Only 3 days on market — expect competitive offers; lowballing is unlikely to land.
- 10 sale attempts since 17y ago with the ask held roughly flat each time — persistent listings suggest the price (not the market) is what's stuck; bring a comps-based counter.
- Current owner paid $120k; list at $199k implies a 66% gain — meaningful room to come down on a strong offer.
Risks & watch-outs
- Climate carrying-cost: extreme-heat days projected 7→20/yr by 2055 (HVAC capex compounding) — expect insurance premiums to compound above CPI over the hold.
Questions for the listing agent
- Is there a deadline driving the sale (1031 exchange, divorce, estate, relocation)? That informs how much negotiation room exists.
- Schools are D-rated, which usually means shorter tenancies and higher turnover. Who's the typical renter profile here, and what's been the actual vacancy rate?
- Crime grade is D in this area — have there been break-ins, vandalism, or insurance claims at this property in the last 3 years? What carrier currently insures it and at what premium?
- What's the average days-on-market for RENTAL listings here right now (not sales)? A rising rental-DOM trend means longer vacancies and softer asking-rent achievability than the comps imply.
- What's the recent tenant-quality profile in this submarket — average credit score on applications, eviction rate, late-payment / NSF rate, and stable-employment percentage? A property-management company in the area should have these aggregated.
- How much new for-sale + rental construction is in the pipeline within 1–3 miles? Heavy new supply typically softens prices + rents 12–24 months out; constrained supply supports both.
Investment metrics
- 1% rule
- 1.24% ✓
- Cap rate
- 9.76%
- Cash-on-cash
- 12.37%
- DSCR
- 1.55
- GRM
- 6.7
CMA / ARV
- ARV (on-the-fly)
- $227,400
- Comps found
- 9
Show comp detail 9 sales within ~0.75 mi
| Address | Dist | Beds/Ba | Sqft | Sold | Price | $/sf | Match |
|---|---|---|---|---|---|---|---|
| 900 N Cleveland St #94 | 0.05mi | 1/1.0 | 600 (0%) | 9mo | $290,000 | $483 | 90 |
| 900 N Cleveland St #89 | 0.07mi | 1/1.0 | 632 (+5%) | 10mo | $119,000 | $188 | 80 |
| 900 N Cleveland St #33 | 0.05mi | 2/1.0 (+1) | 640 (+7%) | 3mo | $254,000 | $397 | 79 |
| 900 N Cleveland St #31 | 0.07mi | 2/1.0 (+1) | 620 (+3%) | 16mo | $220,000 | $355 | 73 |
| 900 N Cleveland St #100 | 0.05mi | 1/1.0 | 580 (-3%) | 23mo | $275,000 | $474 | 73 |
| 900 Cleveland #67 | 0.05mi | 2/1.0 (+1) | 560 (-7%) | 13mo | $150,000 | $268 | 71 |
| 900 N Cleveland St #72 | 0.07mi | 1/1.0 | 528 (-12%) | 10mo | $200,000 | $379 | 68 |
| 900 N Cleveland St #11 | 0.00mi | 2/1.0 (+1) | 680 (+13%) | 12mo | $168,000 | $247 | 63 |
| 900 N Cleveland St #50 | 0.05mi | 2/2.0 (+1) | 656 (+9%) | 23mo | $299,900 | $457 | 54 |
Match score weights: distance 35% · size 25% · config 20% · recency 20%. Top-matched comps best support the ARV.
Projected returns pro-forma
-3.0% appreciation · 2.99% rent growth · sell at horizon
- IRR
- 2.0%
- Equity multiple
- 1.08×
- Total profit
- $4,356
- Equity at exit
- $29,672
- IRR
- 11.6%
- Equity multiple
- 1.91×
- Total profit
- $50,957
- Equity at exit
- $17,206
Cash invested: $55,720 (down + closing). Projections, not guarantees.
Landlord ↔ Tenant lean methodology
- Overall (STATE)
- 18 Strongly Tenant-Friendly
- State California
- 18 Strongly Tenant-Friendly · D+13
- County
- — inherits STATE
- City
- — inherits STATE
ZIP-level market 92054
- Rents YoY
- 3.0%
- Active inventory
- 165
- Price-to-rent
- 6.7×
Monthly cashflow live
- Estimated rent
- $2,468 high interval (Pro) →
- Mortgage (P&I)
- −$1,044
- Tax est. 1.5%
- −$249 /mo · $2,985/yr
- Insurance
- −$83
- HOA
- −$0
- Vacancy / Maint / Mgmt
- −$518
- Net cashflow
- $574
Break-even live
UW: 25.0% down · 7.5% · 30yr · 1.5% tax · 5.0% vac · 8.0% maint · 8.0% mgmt
Financing live
Cash to close
- Down payment
- $49,750
- Closing costs
- $5,970
- Reserves months
- —
- Total cash needed
- —
Loan-product check · same deal, 3 products live
Conventional
25% down · 7.5% · 30yr
- Down + closing
- —
- Monthly P&I
- —
- Monthly cashflow
- —
- DSCR
- —
- Eligible?
- —
Personal DTI + credit; lowest rate.
DSCR
20% down · 8.5% · 30yr
- Down + closing
- —
- Monthly P&I
- —
- Monthly cashflow
- —
- DSCR
- —
- Eligible?
- —
No personal income docs; deal must DSCR.
Hard money
10% down · 12.0% · 12mo
- Down + closing
- —
- Monthly P&I
- —
- Monthly cashflow
- —
- DSCR
- —
- Eligible?
- —
Short-term bridge; refi at stabilization.
Rent comps 30 comps
| Address | Beds | Baths | Sqft | Rent | $/sqft | DOM | Units | Dist |
|---|---|---|---|---|---|---|---|---|
| 1016 Costa Pacifica Way Unit 1545780P Oceanside, CA | 2.0 | 2.0 | 355 | $5,151 | $14.51 | 14d | 1 | 0.10mi |
| 1001 N Coast Hwy Oceanside, CA | 1.0–3.0 | 1.0–2.0 | 1035 | $2,969 | $2.87 | 1d | 24 | 0.16mi |
| 705 N Ditmar St Unit 2 Oceanside, CA | 1.0 | 1.0 | 600 | $2,200 | $3.67 | 43d | 1 | 0.29mi |
| 612 N Freeman St #2 Oceanside, CA | 1.0 | 1.0 | 500 | $2,500 | $5.00 | 43d | 1 | 0.33mi |
| 520 N Freeman St Unit 11 Oceanside, CA | 1.0 | 1.0 | 616 | $2,125 | $3.45 | 24d | 1 | 0.37mi |
| 501 N Ditmar St Oceanside, CA | 2.0 | 1.0 | 553 | $2,395 | $4.33 | 16d | 1 | 0.41mi |
| 501 N Ditmar St Unit O Oceanside, CA | 1.0 | 1.0 | 362 | $2,195 | $6.06 | 16d | 1 | 0.41mi |
| 501 N Ditmar St Unit P Oceanside, CA | 2.0 | 1.0 | 553 | $2,395 | $4.33 | 12d | 1 | 0.41mi |
| 400 Civic Center Dr Apt E Oceanside, CA | 1.0 | 1.0 | 500 | $1,895 | $3.79 | 24d | 1 | 0.44mi |
| 400 Civic Center Dr Unit 400 Oceanside, CA | — | 1.0 | 350 | $1,795 | $5.13 | 11d | 1 | 0.44mi |
| 500 N Clementine St Unit 3 Oceanside, CA | 1.0 | 1.0 | 532 | $2,500 | $4.70 | 4d | 1 | 0.49mi |
| 115 N Cleveland St Oceanside, CA | 2.0 | 1.0–2.0 | 844 | $3,604 | $4.27 | 1d | 4 | 0.63mi |
| 118 S Pacific St Oceanside, CA | 1.0 | 1.0 | 396 | $2,495 | $6.29 | 16d | 3 | 0.72mi |
| 225 S Ditmar St Apt J Oceanside, CA | 1.0 | 1.0 | 614 | $2,250 | $3.66 | 14d | 1 | 0.84mi |
| 216 S Clementine St Unit 3 Oceanside, CA | 1.0 | 1.0 | 550 | $3,800 | $6.91 | 24d | 1 | 0.85mi |
| 237 S Ditmar St Oceanside, CA | 2.0 | 1.5 | 500 | $2,100 | $4.20 | 43d | 1 | 0.85mi |
| 1430 Dubuque St Oceanside, CA | 1.0 | 1.0 | 550 | $1,995 | $3.63 | 24d | 1 | 0.87mi |
| 302 S The Strand Unit 4 Oceanside, CA | 1.0 | 1.0 | 650 | $2,995 | $4.61 | 43d | 1 | 0.91mi |
| 409 S Tremont St Unit A Oceanside, CA | 1.0 | 1.0 | 525 | $2,445 | $4.66 | 24d | 1 | 0.97mi |
| 1515 E Higgins St Unit 1 Oceanside, CA | — | 1.0 | 475 | $1,895 | $3.99 | 1d | 1 | 0.98mi |
| 330 S Horne St Oceanside, CA | 2.0 | 1.0 | 672 | $2,795 | $4.16 | 24d | 1 | 0.99mi |
| 413 S Myers St Unit 1-6 Oceanside, CA | 1.0 | 1.0 | 500 | $2,850 | $5.70 | 43d | 1 | 1.00mi |
| 415 Grant St Oceanside, CA | 1.0–2.0 | 1.0–2.0 | 737 | $2,350 | $3.19 | 4d | 5 | 1.04mi |
| 1202 Missouri Ave Oceanside, CA | 2.0–3.0 | 1.0–2.0 | 865 | $2,600 | $3.01 | 2d | 4 | 1.06mi |
| 515 Rockledge St #513 Oceanside, CA | 1.0 | 1.0 | 550 | $2,395 | $4.35 | 4d | 1 | 1.27mi |
| 920 Tait St Unit 1/2 Oceanside, CA | 1.0 | 1.0 | 450 | $2,450 | $5.44 | 4d | 1 | 1.39mi |
| 615 Vine St #30 Oceanside, CA | 1.0 | 1.0 | 525 | $1,895 | $3.61 | 24d | 1 | 1.39mi |
| 1037 S Cleveland St Unit 11 Oceanside, CA | 1.0 | 1.0 | 390 | $2,495 | $6.40 | 4d | 1 | 1.45mi |
| 960 Vine St Oceanside, CA | 1.0 | 1.0 | 515 | $2,175 | $4.22 | 43d | 1 | 1.49mi |
| 960 Vine St Apt 311 Oceanside, CA | 1.0 | 1.0 | 515 | $2,400 | $4.66 | 14d | 1 | 1.49mi |
Listing history 4 events
-
2026-06-07statusdays on market $199,000 Pending 3 DOM
-
2026-06-04days on market $199,000 Active 2 DOM
-
2026-06-02remarks 474-char remark
-
2026-06-02$199,000 Active 1 DOM
ⓘ Source: listings_history table (triggers on properties + properties_extension) + one-shot
backfill from property_details.listing_events for pre-trigger history.
Climate risk First Street
- Flood 1/10 Low FEMA zone X (unshaded) · 0% chance over 30 yrs
- Wildfire 1/10 Low
- Heat 5/10 Major 7 d/yr ≥83°F today · 20 d/yr by 30 yrs out
- Wind 1/10 Low
- Air quality 4/10 Moderate 4 unhealthy d/yr today · 5 by 30 yrs out
Nearby sold comps map
Loading sold comps map…
Walkable amenities ~0.75 mi
Loading nearby amenities…
Taxation est. · year 1
- Rental income
- $29,616
- − Mortgage interest
- −$11,147
- − Property taxes
- −$2,985
- − Insurance
- −$995
- − Repairs & maintenance
- −$2,369
- − Management
- −$2,369
- − Depreciation
- −$5,789
- Taxable income
- $3,961
- Est. tax owed @ 24.0%
- −$951
- After-tax cash flow
- $5,943/yr
For passive investors: Depreciation is non-cash, so a rental often shows a tax loss while cash-flowing — sheltering income. Rental losses are passive: they offset passive income freely, and up to $25,000/yr can offset ordinary (W-2) income if you actively participate and your MAGI is under $100k (phasing out to $0 by $150k); unused losses carry forward. On sale, claimed depreciation is recaptured at up to 25%, and gains may owe capital-gains tax (a 1031 exchange can defer both). Figures are a year-1 estimate at your 24.0% rate — not tax advice; consult a CPA.
Schools (NCES district)
- District
- Oceanside Unified
- NCES district ID
- 0628250
- Math proficiency
- 31% ▼ -5.00%
- Reading proficiency
- 51% ▲ 6.00%
- Median HH income
- $55,158
- Composite
- 35.74/100
- National rank
- #4853
- State rank
- #221 of 517 in CA
Livability — Oceanside
- Score
- 64/100
- State rank
- #413
- US rank
- #14081
Category grades
Schools grade is shown separately in the Schools card above.
Census & demographics
- Census place
- Oceanside, CA
- County
- San Diego County · 3,178,799 people
- City population
- 198,702
- Metro
- San Diego-Chula Vista-Carlsbad, CA
- Population (ZIP)
- 38,417
- Household income
- $82,408
- Rent vs Own
- Severe rent burden
- 2729.0
Population outlook (San Diego County) Hauer SSP2
- Today (2025)
- 3,678,185 people
- By 2030
- 3,856,546 · +4.8%
- By 2040
- 4,171,407 · +13.4%
- By 2050
- 4,421,607 · +20.2%
- By 2075
- 4,831,599 · +31.4%
- By 2100
- 4,832,502 · +31.4%
Race, ethnicity, and origin ACS 2023
- Neighborhood character
- Diverse neighborhood (Simpson 0.62)
- Race & ethnicity
- White 46% Hispanic / Latino 41% Two or more races 23% Asian 4% Native American 3% Black 3%
- Hispanic origin (detail)
- Mexican 36%
- Common ancestry
- Slovak 2% Italian 2% Lithuanian 2%
- Foreign-born
- 22% · Canada, China, Jamaica
- Languages at home
- 65% English-only · Spanish 29% Other Indo-European 1% Tagalog/Filipino 1%
Political lean MEDSL · San Diego
- 2024 margin
- D (+16.8) · D 56.9% · R 40.1% · Other 2.9%
- 2008→2024 swing
- +6.6pp toward D · 2008: 10.2pp · 2024: 16.8pp
- All cycles
- 2024: D+16.8 2020: D+22.8 2016: D+17.8 2012: D+5.1 2008: D+10.2
Not yet ingested
- Civics
- —
Market trends
- HPI YoY
- ▼ -985.21%
- Current HPI
- 461.2228
- Rent YoY
- ▲ 2.99%
- Metro
- San Diego-Chula Vista-Carlsbad, CA
- State GDP YoY
- ▲ 3.21%
- F500 in state
- 116
Industry mix (Fortune 500 HQ in CA)
| Industry | F500 HQs | Revenue |
|---|---|---|
| Technology | 27 | $1,492B |
|
||
| Financial Services | 3 | $174B |
|
||
| Retail | 3 | $44B |
|
||
| Insurance | 3 | $26B |
|
||
| Media / Entertainment | 2 | $115B |
|
||
| Pharmaceuticals / Biotech | 2 | $62B |
|
||
Price history
+66.5% since first listed29 events — show timeline
- 2026-06-02 Listed $199,000 SDMLS
- 2022-09-20 Listing Removed — SDMLS
- 2022-09-18 Price Changed $199,999 SDMLS
- 2022-08-31 Price Changed $229,000 SDMLS
- 2022-07-25 Price Changed $237,500 SDMLS
- 2022-07-09 Listed $249,000 SDMLS
- 2022-05-16 Listing Removed — SDMLS
- 2022-04-26 Listed $259,000 SDMLS
- 2021-12-12 Pending — SDMLS
- 2021-12-08 Listing Removed — SDMLS
- 2021-12-01 Relisted — SDMLS
- 2021-11-23 Pending — SDMLS
- 2021-11-19 Listed $199,000 SDMLS
- 2016-07-29 Sold (MLS) $120,000 SDMLS
- 2016-07-01 Pending — SDMLS
- 2016-05-05 Price Changed $121,750 SDMLS
- 2016-03-30 Price Changed $124,900 SDMLS
- 2016-03-29 Relisted — SDMLS
- 2016-03-09 Pending — SDMLS
- 2016-02-05 Price Changed $129,900 SDMLS
- 2016-01-02 Price Changed $134,500 SDMLS
- 2015-11-28 Listed $139,900 SDMLS
- 2014-10-28 Sold (MLS) $116,500 SDMLS
- 2014-10-09 Pending — SDMLS
- 2014-09-03 Listed $119,000 SDMLS
- 2009-04-28 Listing Removed — SDMLS
- 2009-04-28 Listing Removed — CRMLS
- 2009-01-28 Listed $119,500 SDMLS
- 2009-01-28 Listed $119,500 CRMLS
Cash-flow waterfall
monthlySold comps — $/sqft
last 12 mo · ≤1 miLoading sold comps…