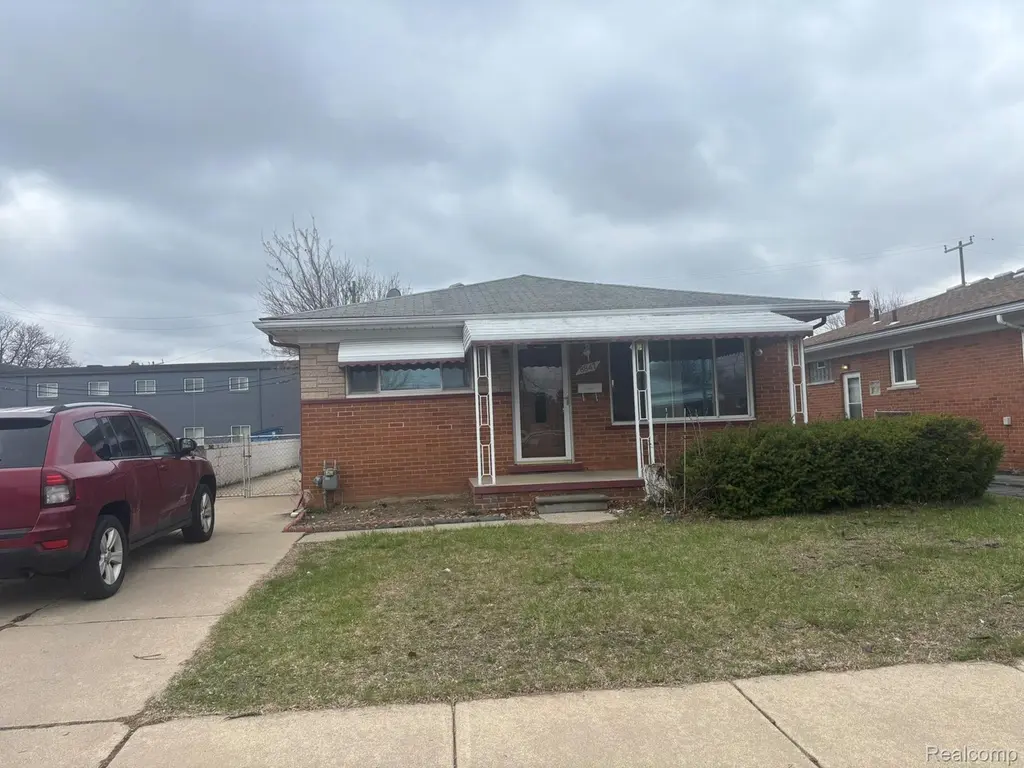
8847 Woodbine · Redford, MI
Flood risk 4/10 · Minor
- FEMA flood zone
- X (unshaded)
- Chance of flooding over 30 yrs
- 0.2%
- Est. flood insurance / yr
- $473 – $860
Fire risk 1/10 · Minimal
- Est. fire insurance / yr
- $784 – $1,456
Heat risk 3/10 · Minor
- Hot days now (above 98°F)
- 7 days/yr
- Hot days in 30 yrs
- 15 days/yr
Wind risk 2/10 · Minimal
- Chance of severe wind over 30 yrs
- —
Air-quality risk 3/10 · Minor
- Unhealthy air days now
- 2 days/yr
- Unhealthy air days in 30 yrs
- 3 days/yr
Risk factors via First Street. Map © Google.
Why this score? — see what drove the D- grade
The composite is a weighted blend of 9 inputs, each scored 0–100. Each bar is that input's sub-score; the figure is the points it added to the 100-point composite (weight × sub-score).
- Cash flow +9.9/30.0
- ARV discount +9.7/15.0
- 1% rule +3.5/10.0
- Rent growth +3.3/5.0
- DSCR +2.8/10.0
- Livability +2.5/5.0
- Condition / age +2.5/5.0
- Schools +1.8/10.0
- Appreciation +0.0/10.0
$199,900
🖨 Deal sheet 📄 Offer letter ✓ Due diligence
Listing remarks MLS
This cozy 3-bedroom brick ranch has 2 full bathrooms. newer furnace and central air conditioner. Finished basement with a kitchen and a full bathroom. Hardwood floors t/o on the main level. (2 stoves, 2 refrigerators, dryer, washer, 65 in TV, fireplace, dehumidifier, cameras to stay ). sold As Is
Key facts
- Newer furnace
- Finished basement
- Hardwood floors
Tags
Property features AI
Exterior
- Parking: Detached 2-car garage; Paved road access
- Utilities: Municipal water available; Municipal sewer available
- Home design: Single-family residence; One level; Ground-level entry with steps; Brick exterior
- Construction: Block foundation
- Exterior features: Covered porch
Interior
- Kitchen: Free-standing refrigerator
- Bedrooms: Total of 5 rooms (includes bedrooms and other living spaces)
- Bathrooms: 2 full bathrooms
- Heating & cooling: Forced air heating (natural gas); Central air conditioning
- Interior features: Finished basement; Gas water heater
- Laundry & utility: Washer; Dryer
Neighborhood map
What this means for you Summary
Snapshot
- This is a 3-bed/1.0-bath single-family listed at $200k.
Deal economics
- At list price, monthly cash flow is $-125 ($-1k/yr) — negative.
- To cash-flow at today's rent, offer at most $178k (11.0% below list).
- To meet the 1% rule (rent ≥ 1% of price), the offer needs to be $171k (14.6% below list).
- Recommended offer: $171k (14.6% below list) — sets the bar for 1% rule.
Location & tenants
- Location reads: area grade D — affects rentability + tenant quality, not the cash-flow math above.
- South Redford School District (suburban): math 11% / reading 29% proficiency, ranked #455 of 540 in MI (top 84%) — low school quality limits family demand, transient renter base, plan for 1-2y turnover.
- Market conditions: Rents rising (+3.2%/yr); 188 active listings in the ZIP; 11 comparable units currently listed for rent nearby; rentals at typical pace (median 18d on market — plan ~3-4 weeks tenant-placement turnaround); 2,639 units permitted in Wayne County in 2024 (1,216 in 5+ unit buildings).
Forward outlook
- Local home prices are declining (-3.0%/yr); year-one equity from $1k of loan paydown is wiped out by about $6k of value loss. Plan a longer hold.
- Wayne County population projected at -17% by 2050 — secular population decline; favor cash flow + early exit over multi-decade hold.
Negotiation context
- It's been on market 15 days — a 2% lower offer ($197k) is reasonable based on typical stale-listing flexibility.
- 10 sale attempts since 5y ago; this cycle's ask is 12394% above the opening price — seller raised mid-cycle; expect resistance to lowballs.
- Current owner paid $158k; 27% above their basis — modest negotiation headroom, anchor on the comps not their cost.
Risks & watch-outs
- Watch-outs: built in 1959 — expect roof / HVAC / electrical / plumbing capex.
Questions for the listing agent
- What do current leases actually rent for vs. the listed asking? Can we see a recent rent roll and the last 12 months of T-12 income?
- Built in 1959 — when were the roof, HVAC, electrical panel, plumbing, and water heater last replaced?
- Is there a deadline driving the sale (1031 exchange, divorce, estate, relocation)? That informs how much negotiation room exists.
- The area grade is low — what's the realistic commute time and amenity access for the typical tenant pool here? Any planned neighborhood developments (good or bad) we should know about?
- What's the average days-on-market for RENTAL listings here right now (not sales)? A rising rental-DOM trend means longer vacancies and softer asking-rent achievability than the comps imply.
- What's the recent tenant-quality profile in this submarket — average credit score on applications, eviction rate, late-payment / NSF rate, and stable-employment percentage? A property-management company in the area should have these aggregated.
- How much new for-sale + rental construction is in the pipeline within 1–3 miles? Heavy new supply typically softens prices + rents 12–24 months out; constrained supply supports both.
Investment metrics
- 1% rule
- 0.85% ✗
- Cap rate
- 5.54%
- Cash-on-cash
- -2.67%
- DSCR
- 0.88
- GRM
- 9.8
CMA / ARV
- ARV (median comp)
- $210,408
- List price
- $199,900
- Delta
- 2.18%
- Verdict
- FAIR
- Comps
- 20 within 1.0 mi
Show comp detail 12 sales within ~0.75 mi
| Address | Dist | Beds/Ba | Sqft | Sold | Price | $/sf | Match |
|---|---|---|---|---|---|---|---|
| 8915 Wormer Ave | 0.08mi | 3/1.0 | 981 (0%) | 0mo | $183,500 | $187 | 96 |
| 8841 Virgil | 0.31mi | 3/1.0 | 1,013 (+3%) | 3mo | $185,000 | $183 | 77 |
| 9022 Winston | 0.24mi | 3/1.0 | 1,020 (+4%) | 8mo | $215,000 | $211 | 76 |
| 8627 Robindale Ave | 0.50mi | 3/1.0 | 980 (-0%) | 5mo | $169,000 | $172 | 73 |
| 9025 Appleton | 0.27mi | 3/1.0 | 1,092 (+11%) | 6mo | $205,000 | $188 | 63 |
| 24428 W Chicago | 0.48mi | 2/1.0 (-1) | 912 (-7%) | 4mo | $95,000 | $104 | 58 |
| 8074 Nightingale St | 0.75mi | 3/1.0 | 1,020 (+4%) | 6mo | $200,000 | $196 | 54 |
| 8152 Virgil St | 0.61mi | 3/1.0 | 1,061 (+8%) | 5mo | $156,000 | $147 | 54 |
| 8656 Nightingale Ave. St | 0.53mi | 2/1.0 (-1) | 900 (-8%) | 6mo | $128,000 | $142 | 52 |
| 25115 Joy Rd | 0.49mi | 2/1.0 (-1) | 870 (-11%) | 2mo | $80,000 | $92 | 51 |
| 9375 Riverview | 0.44mi | 3/1.5 | 1,108 (+13%) | 6mo | $210,000 | $190 | 51 |
| 8356 Glengary St | 0.74mi | 3/1.0 | 1,100 (+12%) | 7mo | $253,000 | $230 | 39 |
Match score weights: distance 35% · size 25% · config 20% · recency 20%. Top-matched comps best support the ARV.
Projected returns pro-forma
-3.0% appreciation · 3.25% rent growth · sell at horizon
- IRR
- -20.4%
- Equity multiple
- 0.29×
- Total profit
- $-39,822
- Equity at exit
- $29,806
- IRR
- -12.8%
- Equity multiple
- 0.24×
- Total profit
- $-42,795
- Equity at exit
- $17,284
Cash invested: $55,972 (down + closing). Projections, not guarantees.
Landlord ↔ Tenant lean methodology
- Overall (STATE)
- 62 Landlord-Friendly
- State Michigan
- 62 Landlord-Friendly · EVEN
- County
- — inherits STATE
- City
- — inherits STATE
ZIP-level market 48239
- Rents YoY
- 3.2%
- Active inventory
- 188
- Price-to-rent
- 9.8×
Monthly cashflow live
- Estimated rent
- $1,707 high interval (Pro) →
- Mortgage (P&I)
- −$1,048
- Tax from tax record
- −$342 /mo · $4,101/yr
- Insurance
- −$83
- HOA
- −$0
- Vacancy / Maint / Mgmt
- −$358
- Net cashflow
- $-125
Break-even live
UW: 25.0% down · 7.5% · 30yr · 1.5% tax · 5.0% vac · 8.0% maint · 8.0% mgmt
Financing live
Cash to close
- Down payment
- $49,975
- Closing costs
- $5,997
- Reserves months
- —
- Total cash needed
- —
Loan-product check · same deal, 3 products live
Conventional
25% down · 7.5% · 30yr
- Down + closing
- —
- Monthly P&I
- —
- Monthly cashflow
- —
- DSCR
- —
- Eligible?
- —
Personal DTI + credit; lowest rate.
DSCR
20% down · 8.5% · 30yr
- Down + closing
- —
- Monthly P&I
- —
- Monthly cashflow
- —
- DSCR
- —
- Eligible?
- —
No personal income docs; deal must DSCR.
Hard money
10% down · 12.0% · 12mo
- Down + closing
- —
- Monthly P&I
- —
- Monthly cashflow
- —
- DSCR
- —
- Eligible?
- —
Short-term bridge; refi at stabilization.
Rent comps 11 comps
| Address | Beds | Baths | Sqft | Rent | $/sqft | DOM | Units | Dist |
|---|---|---|---|---|---|---|---|---|
| 8187 Lenore St Dearborn Heights, MI | 2.0 | 1.0 | 768 | $1,550 | $2.02 | 43d | 1 | 0.47mi |
| 8455 Robindale Ave Dearborn Heights, MI | 3.0 | 1.0 | 1100 | $1,750 | $1.59 | 4d | 1 | 0.58mi |
| 7462 N Vernon St Dearborn Heights, MI | 4.0 | 1.0 | 1113 | $1,900 | $1.71 | 1d | 1 | 0.94mi |
| 7420 Drexel St Dearborn Heights, MI | 2.0 | 1.0 | 1080 | $1,700 | $1.57 | 17d | 1 | 0.98mi |
| 7420 Drexel St Dearborn Heights, MI | 2.0 | 1.0 | 1080 | $1,600 | $1.48 | 4d | 1 | 0.98mi |
| 7420 Drexel St Dearborn Heights, MI | 2.0 | 1.0 | 1080 | $1,700 | $1.57 | 43d | 1 | 0.98mi |
| 7466 W Parkway St Redford, MI | 2.0 | 1.5 | 672 | $1,200 | $1.79 | 2d | 1 | 1.10mi |
| 7080 Highview St Dearborn Heights, MI | 3.0 | 2.5 | 1105 | $2,000 | $1.81 | 18d | 1 | 1.36mi |
| 7014 Kinmore St Dearborn Heights, MI | 3.0 | 1.0 | 960 | $1,900 | $1.98 | 21d | 1 | 1.44mi |
| 22330 W Warren Ave Redford Charter Twp, MI | 2.0 | 1.0 | 750 | $1,200 | $1.60 | 43d | 1 | 1.44mi |
| 23851 Fullerton Ave Detroit, MI | 1.0–2.0 | 1.0 | 700 | $999 | $1.43 | 43d | 1 | 1.45mi |
Listing history 30 events
-
2026-06-18days on market $199,900 Active 15 DOM
-
2026-06-17days on market $199,900 Active 14 DOM
-
2026-06-16days on market $199,900 Active 13 DOM
-
2026-06-15days on market $199,900 Active 12 DOM
-
2026-06-13days on market $199,900 Active 10 DOM
-
2026-06-09days on market $199,900 Active 6 DOM
-
2026-06-08days on market $199,900 Active 5 DOM
-
2026-06-07days on market $199,900 Active 4 DOM
-
2026-06-04remarks 297-char remark
-
2026-06-04pricedays on market $199,900 Active 1 DOM
-
2026-06-02days on market $215,000 Active 26 DOM
-
2026-06-01days on market $215,000 Active 25 DOM
-
2026-05-31days on market $215,000 Active 24 DOM
-
2026-05-07$215,000 Active 189-char remark
-
2026-05-07$215,000 Active 189-char remark
-
2026-05-07historical
-
2026-05-07historical
-
2026-04-13$225,000 Active
-
2026-04-13$225,000 Active
-
2021-06-02soldstatus $158,000
-
2021-05-18soldstatus $158,000 Sold
-
2021-05-18soldstatus $158,000 Closed
-
2021-03-17status Pending
-
2021-03-17status Pending
-
2021-03-15status Accepting Backup Offers
-
2021-03-15historical Accepting Backup Offers
-
2021-03-15historical Accepting Backup Offers
-
2021-03-15historical
-
2021-03-12$149,000 Active
-
2021-03-12$149,000 Active
ⓘ Source: listings_history table (triggers on properties + properties_extension) + one-shot
backfill from property_details.listing_events for pre-trigger history.
Tax reassessment forecast MI · Partial reset (capped growth)
- Current annual tax
- $4,101 · $342/mo
- Projected year-2 tax
- $4,101 · $342/mo
- Expected delta
- $0/yr ($0/mo · 0.0%)
ⓘ Screening estimate from a state-policy table — verify with the county assessor before closing.
Climate risk First Street
- Flood 4/10 Moderate FEMA zone X (unshaded) · 20% chance over 30 yrs
- Wildfire 1/10 Low
- Heat 3/10 Moderate 7 d/yr ≥98°F today · 15 d/yr by 30 yrs out
- Wind 2/10 Low
- Air quality 3/10 Moderate 2 unhealthy d/yr today · 3 by 30 yrs out
Nearby sold comps map
Loading sold comps map…
Walkable amenities ~0.75 mi
Loading nearby amenities…
Taxation est. · year 1
- Rental income
- $20,485
- − Mortgage interest
- −$11,198
- − Property taxes
- −$4,101
- − Insurance
- −$1,000
- − Repairs & maintenance
- −$1,639
- − Management
- −$1,639
- − Depreciation
- −$5,815
- Taxable loss
- −$4,905
- Est. tax savings @ 24.0%
- +$1,177
- After-tax cash flow
- $-319/yr
For passive investors: Depreciation is non-cash, so a rental often shows a tax loss while cash-flowing — sheltering income. Rental losses are passive: they offset passive income freely, and up to $25,000/yr can offset ordinary (W-2) income if you actively participate and your MAGI is under $100k (phasing out to $0 by $150k); unused losses carry forward. On sale, claimed depreciation is recaptured at up to 25%, and gains may owe capital-gains tax (a 1031 exchange can defer both). Figures are a year-1 estimate at your 24.0% rate — not tax advice; consult a CPA.
Schools (NCES district)
- District
- South Redford School District
- NCES district ID
- 2632280
- Math proficiency
- 11% ▼ -9.00%
- Reading proficiency
- 29% ▼ -7.00%
- Median HH income
- $52,775
- Composite
- 18.1/100
- National rank
- #8972
- State rank
- #455 of 540 in MI
Livability — Redford
No livability data for this city. (Only ~50 U.S. cities are tracked.)
Census & demographics
- County
- Wayne County · 1,562,939 people
- City population
- 36,976
- Metro
- Detroit-Warren-Dearborn, MI
- Population (ZIP)
- 36,976
- Household income
- $71,151
- Rent vs Own
- Severe rent burden
- 1052.0
Population outlook (Wayne County) Hauer SSP2
- Today (2025)
- 1,675,273 people
- By 2030
- 1,620,300 · -3.3%
- By 2040
- 1,502,341 · -10.3%
- By 2050
- 1,384,039 · -17.4%
- By 2075
- 1,124,592 · -32.9%
- By 2100
- 881,193 · -47.4%
Race, ethnicity, and origin ACS 2023
- Neighborhood character
- Majority Black (58%)
- Race & ethnicity
- Black 58% White 34% Hispanic / Latino 4% Two or more races 4%
- Common ancestry
- Romanian 7% Slovak 2% Lithuanian 2%
- Foreign-born
- 2% · Canada
- Languages at home
- 96% English-only · Spanish 1% Other Indo-European 1% Arabic 1%
Political lean MEDSL · Wayne
- 2024 margin
- Strong D (+29.0) · D 62.7% · R 33.7% · Other 3.6%
- 2008→2024 swing
- -20.5pp toward R · 2008: 49.5pp · 2024: 29.0pp
- All cycles
- 2024: D+29.0 2020: D+38.1 2016: D+37.3 2012: D+46.9 2008: D+49.5
Not yet ingested
- Civics
- —
Market trends
- HPI YoY
- ▼ -202.97%
- Current HPI
- 236.1136
- Rent YoY
- ▲ 3.25%
- Metro
- Detroit-Warren-Dearborn, MI
- State GDP YoY
- ▲ 1.37%
- F500 in state
- 28
Industry mix (Fortune 500 HQ in MI)
| Industry | F500 HQs | Revenue |
|---|---|---|
| Automotive Parts | 3 | $48B |
|
||
| Automotive | 2 | $372B |
|
||
| Chemicals | 1 | $45B |
|
||
| Automotive Retail | 1 | $29B |
|
||
| Healthcare / Medical Devices | 1 | $23B |
|
||
| Automotive Technology | 1 | $20B |
|
||
Price history
-98.9% since first listed22 events — show timeline
- 2026-06-16 Listed for Rent $1,600 REALSOURCE
- 2026-06-03 Listed $199,900 MiRealSource-MiMLS
- 2026-06-03 Listed $199,900 REALCOMP
- 2026-06-02 Listing Removed — REALCOMP
- 2026-06-02 Listing Removed — MiRealSource-MiMLS
- 2026-05-07 Listing Removed — REALCOMP
- 2026-05-07 Listing Removed — MiRealSource-MiMLS
- 2026-05-07 Listed $215,000 REALCOMP
- 2026-05-07 Listed $215,000 MiRealSource-MiMLS
- 2026-04-13 Listed $225,000 REALCOMP
- 2026-04-13 Listed $225,000 MiRealSource-MiMLS
- 2021-06-02 Sold (Public Records) $158,000 Public Records
- 2021-05-18 Sold (MLS) $158,000 MiRealSource-MiMLS
- 2021-05-18 Sold (MLS) $158,000 REALCOMP
- 2021-03-17 Pending — MiRealSource-MiMLS
- 2021-03-17 Pending — REALCOMP
- 2021-03-15 Relisted — MiRealSource-MiMLS
- 2021-03-15 Contingent — MiRealSource-MiMLS
- 2021-03-15 Contingent — REALCOMP
- 2021-03-15 Listing Removed — MiRealSource-MiMLS
- 2021-03-12 Listed $149,000 MiRealSource-MiMLS
- 2021-03-12 Listed $149,000 REALCOMP
Property tax history
+9.6%/yrLatest (2025): $4,101 · +2.6% YoY. Source: county tax records.
Cash-flow waterfall
monthlySold comps — $/sqft
last 12 mo · ≤1 miLoading sold comps…