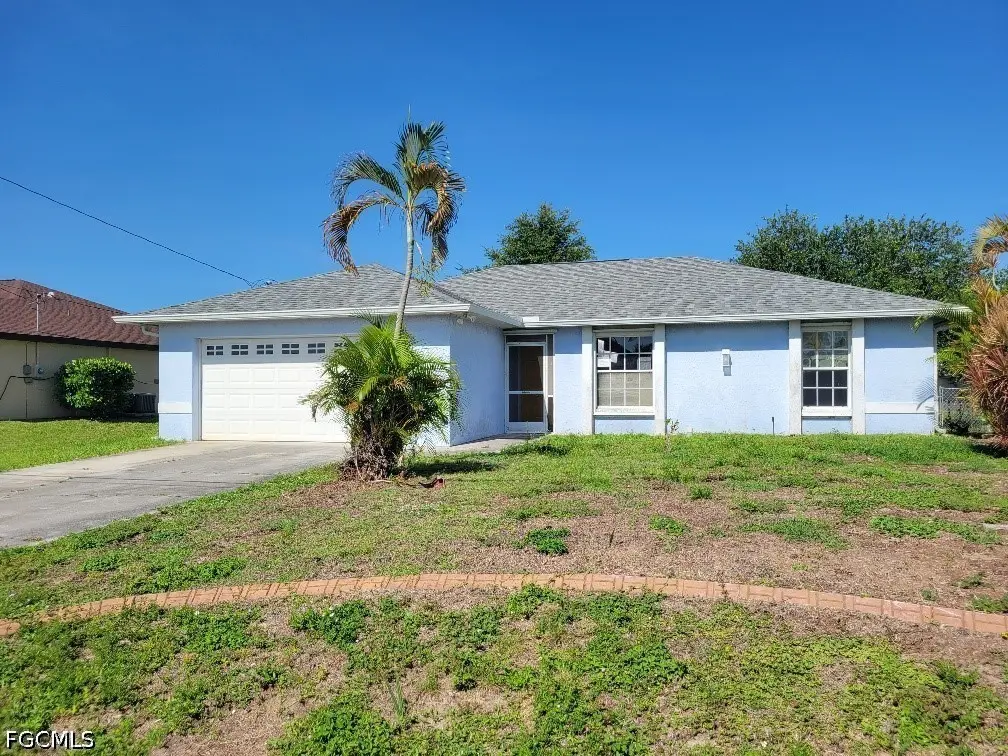
208 NW 4th Ave · Cape Coral, FL
Flood risk 4/10 · Minor
- FEMA flood zone
- X (unshaded)
- Chance of flooding over 30 yrs
- 0.22%
- Est. flood insurance / yr
- $507 – $1,088
Fire risk 1/10 · Minimal
- Est. fire insurance / yr
- $947 – $1,759
Heat risk 10/10 · Severe
- Hot days now (above 107°F)
- 7 days/yr
- Hot days in 30 yrs
- 29 days/yr
Wind risk 10/10 · Severe
- Chance of severe wind over 30 yrs
- 99.0%
Air-quality risk 2/10 · Minimal
- Unhealthy air days now
- 1 days/yr
- Unhealthy air days in 30 yrs
- 1 days/yr
Risk factors via First Street. Map © Google.
Why this score? — see what drove the C grade
The composite is a weighted blend of 9 inputs, each scored 0–100. Each bar is that input's sub-score; the figure is the points it added to the 100-point composite (weight × sub-score).
- Cash flow +18.1/30.0
- ARV discount +15.0/15.0
- DSCR +5.7/10.0
- 1% rule +5.0/10.0
- Schools +4.1/10.0
- Livability +3.9/5.0
- Condition / age +2.5/5.0
- Rent growth +1.1/5.0
- Appreciation +0.0/10.0
$205,000
🖨 Deal sheet (PDF) 📄 Offer letter ✓ Due diligence
Listing remarks
AMAZING DEAL on this 3BR/2BA home in NW Cape Coral with soaring cathedral ceilings and huge back yard with sprawling oak trees and plenty of shade! Home features tile floors throughout, soaring cathedral ceiling and split bedrooms! LOCATION. .LOCATION just walking distance from major shopping area and other private services! Transform the backyard into a Tropical Oasis and enjoy the true Florida lifestyle! Don't delay-SCHEDULE a SHOWING TODAY!
Key facts
- Tile floors
- Sprawling oak trees
- Huge back yard
Tags
Property features AI
Finance
- Financial info: Pets allowed
- HOA & community: No association fee
Exterior
- Parking: Attached 2-car garage
- Utilities: Public water; Public sewer; Cable available
- Home design: Single-story home; Entry level: 1
- Construction: Block, concrete and stucco construction; Shingle roof
- Exterior features: Fenced yard; Room for a pool; Rectangular lot; Public maintained road; Property faces east; Lot exposure to the west; Known damage noted
Interior
- Kitchen: Dishwasher; Range
- Flooring: Tile
- Bathrooms: 2 full bathrooms
- Heating & cooling: Central electric heating; Central electric cooling (central air)
- Interior features: Cathedral ceilings; Living/dining room; Pantry; Tub with shower; Split bedroom floor plan; Single-hung windows; Interior shutters; Unfurnished
- Laundry & utility: Laundry area in garage
Neighborhood map
What this means for you Summary
Snapshot
- This is a 3-bed/2.0-bath single-family listed at $205k.
Deal economics
- At list price, monthly cash flow is $179 ($2k/yr) — positive.
- The deal already cash-flows at list — no discount required.
- Meets the 1% rule at list price ($2k rent vs $205k).
- Cap rate 7.3% vs local median 3.1% in Cape Coral — top-decile yield for the area; either an underpriced asset or a hidden risk that comps aren't pricing in. Stress-test before assuming the spread holds.
Location & tenants
- Location reads 77/100 on livability (#208 in FL, #3,098 nationally) — a middle-class / working-renter tenant base. Strengths: housing A+, health & safety A+, amenities B+; Watch: commute F.
- Lee (suburban): math 47% / reading 50% proficiency, ranked #42 of 73 in FL (top 58%) — families likely to look elsewhere, expect single-tenant / working-renter base with shorter leases.
- Zoned schools: Gulf Elementary School (math 70% / reading 65%, grade B+, #435 of 2,144 statewide, top 21%, 1,231 students, 38% FRL); Challenger Middle School (math 59% / reading 56%, grade B, #157 of 571 statewide, top 28%, 1,124 students, 50% FRL); Ida S. Baker High School (math 44% / reading 47%, grade D-, #223 of 667 statewide, top 34%, 1,933 students, 39% FRL) — zoned schools average 42% FRL vs 57% district-wide (15 pts lower); this property's tenant base skews higher-income than the district average.
- Market conditions: Rents falling (-5.5%/yr); 2671 active listings in the ZIP; 39 comparable units currently listed for rent nearby; rentals at typical pace (median 16d on market — plan ~3-4 weeks tenant-placement turnaround); solid renter incomes; 15,411 units permitted in Lee County in 2024 (4,686 in 5+ unit buildings).
Forward outlook
- Local home prices are declining (-3.0%/yr); year-one equity from $1k of loan paydown is wiped out by about $6k of value loss. Plan a longer hold.
- Lee County population projected at +44% by 2050 — long-run rental-demand tailwind backs the buy-and-hold thesis.
Negotiation context
- Only 13 days on market — expect competitive offers; lowballing is unlikely to land.
- Current owner paid $162k; 27% above their basis — modest negotiation headroom, anchor on the comps not their cost.
Risks & watch-outs
- Climate carrying-cost: severe wind risk, 99% chance of damaging wind over 30y; extreme-heat days projected 7→29/yr by 2055 (HVAC capex compounding) — expect insurance premiums to compound above CPI over the hold.
Questions for the listing agent
- Is there a deadline driving the sale (1031 exchange, divorce, estate, relocation)? That informs how much negotiation room exists.
- Schools are B-rated — typically a magnet for longer-tenancy family renters. What's the average tenant stay here, and is there a school-zone premium baked into asking?
- What's the average days-on-market for RENTAL listings here right now (not sales)? A rising rental-DOM trend means longer vacancies and softer asking-rent achievability than the comps imply.
- What's the recent tenant-quality profile in this submarket — average credit score on applications, eviction rate, late-payment / NSF rate, and stable-employment percentage? A property-management company in the area should have these aggregated.
- How much new for-sale + rental construction is in the pipeline within 1–3 miles? Heavy new supply typically softens prices + rents 12–24 months out; constrained supply supports both.
Investment metrics
- 1% rule
- 1.00% ✓
- Cap rate
- 7.34%
- Cash-on-cash
- 3.75%
- DSCR
- 1.17
- GRM
- 8.3
CMA / ARV
- ARV (on-the-fly)
- $282,498
- Comps found
- 5
Show comp detail 5 sales within ~0.75 mi
| Address | Dist | Beds/Ba | Sqft | Sold | Price | $/sf | Match |
|---|---|---|---|---|---|---|---|
| 504 NW 3rd Ln | 0.27mi | 3/2.0 | 1,144 (-3%) | 1mo | $295,000 | $258 | 81 |
| 319 NW 4th St | 0.30mi | 3/2.0 | 1,204 (+2%) | 15mo | $350,000 | $291 | 70 |
| 204 NW 5th St | 0.44mi | 3/2.0 | 1,241 (+5%) | 22mo | $270,000 | $218 | 53 |
| 401 NW Juanita Ct | 0.51mi | 3/2.0 | 1,096 (-7%) | 14mo | $262,000 | $239 | 53 |
| 114 NW 7th St | 0.71mi | 3/2.0 | 1,264 (+7%) | 12mo | $270,000 | $214 | 46 |
Match score weights: distance 35% · size 25% · config 20% · recency 20%. Top-matched comps best support the ARV.
Projected returns pro-forma
-3.0% appreciation · 0.0% rent growth · sell at horizon
- IRR
- -13.9%
- Equity multiple
- 0.52×
- Total profit
- $-27,764
- Equity at exit
- $30,566
- IRR
- -10.9%
- Equity multiple
- 0.43×
- Total profit
- $-32,527
- Equity at exit
- $17,725
Cash invested: $57,400 (down + closing). Projections, not guarantees.
Landlord ↔ Tenant lean methodology
- Overall (STATE)
- 87 Strongly Landlord-Friendly
- State Florida
- 87 Strongly Landlord-Friendly · R+3
- County
- — inherits STATE
- City
- — inherits STATE
ZIP-level market 33993
- Home prices YoY
- -14.1%
- Rents YoY
- -5.5%
- Active inventory
- 2671
- Price-to-rent
- 8.3×
Monthly cashflow live
- Estimated rent
- $2,053 high interval (Pro) →
- Mortgage (P&I)
- −$1,075
- Tax from tax record
- −$282 /mo · $3,384/yr
- Insurance
- −$85
- HOA
- −$0
- Vacancy / Maint / Mgmt
- −$431
- Net cashflow
- $179
Break-even live
Sensitivity live
| Price | -10% $295 | -5% $237 | +0% $179 | +5% $121 | +10% $63 |
|---|---|---|---|---|---|
| Rent | -10% $17 | -5% $98 | +0% $179 | +5% $260 | +10% $342 |
| Rate | -1.0pp $283 | -0.5pp $232 | base $179 | +0.5pp $126 | +1.0pp $72 |
UW: 25.0% down · 7.5% · 30yr · 1.5% tax · 5.0% vac · 8.0% maint · 8.0% mgmt
Financing live
Cash to close
- Down payment
- $51,250
- Closing costs
- $6,150
- Reserves months
- —
- Total cash needed
- —
Loan-product check · same deal, 3 products live
Conventional
25% down · 7.5% · 30yr
- Down + closing
- —
- Monthly P&I
- —
- Monthly cashflow
- —
- DSCR
- —
- Eligible?
- —
Personal DTI + credit; lowest rate.
DSCR
20% down · 8.5% · 30yr
- Down + closing
- —
- Monthly P&I
- —
- Monthly cashflow
- —
- DSCR
- —
- Eligible?
- —
No personal income docs; deal must DSCR.
Hard money
10% down · 12.0% · 12mo
- Down + closing
- —
- Monthly P&I
- —
- Monthly cashflow
- —
- DSCR
- —
- Eligible?
- —
Short-term bridge; refi at stabilization.
Rent comps 39 comps
| Address | Beds | Baths | Sqft | Rent | $/sqft | DOM | Units | Dist |
|---|---|---|---|---|---|---|---|---|
| 186 Tierra De Paz Loop Cape Coral, FL | 1.0–3.0 | 1.0–2.0 | 935 | $2,496 | $2.67 | 3d | 153 | 0.18mi |
| 212 NW 1st St Cape Coral, FL | 3.0 | 2.0 | 1246 | $1,775 | $1.42 | 5d | 1 | 0.24mi |
| 315 SW Pine Island Rd Cape Coral, FL | 1.0–2.0 | 1.0–2.0 | 974 | $1,699 | $1.74 | 5d | 10 | 0.36mi |
| 626 NW 2nd Ln Cape Coral, FL | 3.0 | 2.0 | 1272 | $2,200 | $1.73 | 25d | 1 | 0.38mi |
| 626 NW 2nd Ln Cape Coral, FL | 3.0 | 2.0 | 1272 | $2,200 | $1.73 | 17d | 1 | 0.38mi |
| 149 Santa Barbara Blvd S Cape Coral, FL | 3.0 | 2.0 | 1250 | $1,520 | $1.22 | 25d | 1 | 0.69mi |
| 419 NW 7th Ter Cape Coral, FL | 3.0 | 2.0 | 1161 | $4,500 | $3.88 | 5d | 1 | 0.72mi |
| 159 SE Santa Barbara Pl Cape Coral, FL | 3.0 | 2.0 | 1412 | $2,250 | $1.59 | 25d | 1 | 0.74mi |
| 701 SW Pine Island Rd Cape Coral, FL | 1.0–3.0 | 1.0–2.0 | 1138 | $1,794 | $1.58 | 3d | 11 | 0.80mi |
| 318 NW 8th Ter Cape Coral, FL | 3.0 | 2.0 | 1500 | $1,900 | $1.27 | 4d | 1 | 0.80mi |
| 639 NE Juanita Pl Cape Coral, FL | 3.0 | 2.0 | 1116 | $1,700 | $1.52 | 21d | 1 | 0.82mi |
| 320 SW 3rd Pl Cape Coral, FL | 2.0 | 2.0 | 1008 | $1,495 | $1.48 | 25d | 1 | 0.87mi |
| 229 Hancock Bridge Pkwy Cape Coral, FL | 2.0 | 2.0 | 1100 | $1,400 | $1.27 | 25d | 1 | 0.88mi |
| 621 SW 3rd St Cape Coral, FL | 2.0 | 2.0 | 910 | $1,200 | $1.32 | 25d | 1 | 0.89mi |
| 275 SW 4th St #220 Cape Coral, FL | 2.0 | 2.0 | 1156 | $1,475 | $1.28 | 5d | 1 | 0.89mi |
| 419 SW 4th St Cape Coral, FL | 2.0 | 2.0 | 1168 | $1,695 | $1.45 | 17d | 1 | 0.90mi |
| 271 SW 4th St Unit 271 Cape Coral, FL | 3.0 | 2.0 | 1259 | $2,000 | $1.59 | 25d | 1 | 0.90mi |
| 302 SE 3rd St Cape Coral, FL | 3.0 | 2.0 | 1404 | $2,055 | $1.46 | 3d | 1 | 1.11mi |
| 302 SE 3rd St Cape Coral, FL | 3.0 | 2.0 | 1404 | $2,240 | $1.60 | 23d | 1 | 1.11mi |
| 114 NW 13th Ave Cape Coral, FL | 3.0 | 2.0 | 1422 | $2,000 | $1.41 | 16d | 1 | 1.16mi |
| 749 SW 5th Ter Cape Coral, FL | 3.0 | 2.0 | 1404 | $2,065 | $1.47 | 5d | 1 | 1.17mi |
| 527 Hancock Bridge Pkwy Cape Coral, FL | 2.0 | 2.0 | 1080 | $1,375 | $1.27 | 5d | 1 | 1.22mi |
| 525 SE Van Loon Ter Cape Coral, FL | 2.0 | 1.0 | 885 | $1,500 | $1.69 | 25d | 1 | 1.23mi |
| 1113 NW 1st Ave Cape Coral, FL | 3.0 | 2.0 | 1286 | $1,626 | $1.26 | 5d | 1 | 1.25mi |
| 1143 NW 4th Pl Cape Coral, FL | 3.0 | 2.0 | 1399 | $1,750 | $1.25 | 5d | 1 | 1.30mi |
| 617 Hancock Bridge Pkwy Cape Coral, FL | 2.0 | 2.0 | 1206 | $1,750 | $1.45 | 25d | 1 | 1.34mi |
| 604 Skyline Blvd Cape Coral, FL | 2.0 | 2.0 | 1121 | $1,550 | $1.38 | 5d | 1 | 1.34mi |
| 1140 NW 1st Ave Cape Coral, FL | 3.0 | 2.0 | 1452 | $1,850 | $1.27 | 25d | 1 | 1.34mi |
| 1140 NW 1st Ave Cape Coral, FL | 3.0 | 2.0 | 1452 | $1,850 | $1.27 | 16d | 1 | 1.34mi |
| 624 Hancock Bridge Pkwy Unit 1 Cape Coral, FL | 2.0 | 2.0 | 1110 | $1,425 | $1.28 | 5d | 1 | 1.37mi |
| 1156 NW 5th Pl Cape Coral, FL | 3.0 | 2.0 | 1458 | $1,695 | $1.16 | 21d | 1 | 1.41mi |
| 910 SW 3rd Ave Cape Coral, FL | 3.0 | 2.0 | 1380 | $1,900 | $1.38 | 13d | 1 | 1.43mi |
| 1109 NE 2nd Pl Cape Coral, FL | 3.0 | 2.0 | 1272 | $1,900 | $1.49 | 25d | 1 | 1.44mi |
| 746 SW 8th Ter Unit 203 Cape Coral, FL | 2.0 | 2.0 | 1120 | $1,750 | $1.56 | 25d | 1 | 1.44mi |
| 411 NW 13th St Cape Coral, FL | 3.0 | 2.0 | 1408 | $2,035 | $1.45 | 5d | 1 | 1.45mi |
| 503 SE 5th St Cape Coral, FL | 3.0 | 2.0 | 1200 | $1,650 | $1.38 | 5d | 1 | 1.45mi |
| 102 Cultural Park Blvd N Cape Coral, FL | 2.0 | 2.0 | 1142 | $1,450 | $1.27 | 25d | 1 | 1.45mi |
| 507 SE 5th St Cape Coral, FL | 3.0 | 2.0 | 1200 | $1,650 | $1.38 | 5d | 1 | 1.46mi |
| 528 SE 4th Ter Cape Coral, FL | 3.0 | 2.0 | 1250 | $1,800 | $1.44 | 25d | 1 | 1.47mi |
Listing history 9 events
-
2026-06-22days on market $205,000 Active 13 DOM
-
2026-06-18days on market $205,000 Active 10 DOM
-
2026-06-17days on market $205,000 Active 9 DOM
-
2026-06-16days on market $205,000 Active 8 DOM
-
2026-06-15days on market $205,000 Active 7 DOM
-
2026-06-13days on market $205,000 Active 5 DOM
-
2026-06-10days on market $205,000 Active 2 DOM
-
2026-06-08remarks 447-char remark
-
2026-06-08$205,000 Active 1 DOM
ⓘ Source: listings_history table (triggers on properties + properties_extension) + one-shot
backfill from property_details.listing_events for pre-trigger history.
Tax reassessment forecast FL · Resets to sale price
- Current annual tax
- $3,384 · $282/mo
- Projected year-2 tax
- $3,384 · $282/mo
- Expected delta
- $0/yr ($0/mo · 0.0%)
ⓘ Screening estimate from a state-policy table — verify with the county assessor before closing.
Climate risk First Street
- Flood 4/10 Moderate FEMA zone X (unshaded) · 22% chance over 30 yrs
- Wildfire 1/10 Low
- Heat 10/10 Extreme 7 d/yr ≥107°F today · 29 d/yr by 30 yrs out
- Wind 10/10 Extreme 99% chance of damaging wind over 30 yrs
- Air quality 2/10 Low 1 unhealthy d/yr today · 1 by 30 yrs out
Nearby sold comps map
Loading sold comps map…
Walkable amenities ~0.75 mi
Loading nearby amenities…
Taxation est. · year 1
- Rental income
- $24,636
- − Mortgage interest
- −$11,483
- − Property taxes
- −$3,384
- − Insurance
- −$1,025
- − Repairs & maintenance
- −$1,971
- − Management
- −$1,971
- − Depreciation
- −$5,964
- Taxable loss
- −$1,162
- Est. tax savings @ 24.0%
- +$279
- After-tax cash flow
- $2,431/yr
For passive investors: Depreciation is non-cash, so a rental often shows a tax loss while cash-flowing — sheltering income. Rental losses are passive: they offset passive income freely, and up to $25,000/yr can offset ordinary (W-2) income if you actively participate and your MAGI is under $100k (phasing out to $0 by $150k); unused losses carry forward. On sale, claimed depreciation is recaptured at up to 25%, and gains may owe capital-gains tax (a 1031 exchange can defer both). Figures are a year-1 estimate at your 24.0% rate — not tax advice; consult a CPA.
Schools (NCES district)
- District
- Lee
- NCES district ID
- 1201080
- Math proficiency
- 47% ▼ -11.00%
- Reading proficiency
- 50% ▼ -4.00%
- Median HH income
- $49,518
- Composite
- 41.49/100
- National rank
- #3458
- State rank
- #42 of 73 in FL
Livability — Cape Coral
- Score
- 77/100
- State rank
- #208
- US rank
- #3098
Category grades
Schools grade is shown separately in the Schools card above.
Census & demographics
- Census place
- Cape Coral, FL
- County
- Lee County · 788,662 people
- City population
- 217,388
- Metro
- Cape Coral-Fort Myers, FL
- Population (ZIP)
- 35,580
- Household income
- $90,577
- Rent vs Own
- Severe rent burden
- 286.0
Population outlook (Lee County) Hauer SSP2
- Today (2025)
- 871,946 people
- By 2030
- 955,468 · +9.6%
- By 2040
- 1,113,587 · +27.7%
- By 2050
- 1,256,891 · +44.1%
- By 2075
- 1,560,270 · +78.9%
- By 2100
- 1,726,848 · +98.0%
Race, ethnicity, and origin ACS 2023
- Neighborhood character
- Diverse neighborhood (Simpson 0.58)
- Race & ethnicity
- White 57% Hispanic / Latino 30% Two or more races 21% Black 7% Asian 2%
- Hispanic origin (detail)
- Mexican 2% Puerto Rican 6% Cuban 17% Dominican 1%
- Common ancestry
- Romanian 2% Hispanic 2% Lithuanian 2%
- Foreign-born
- 21% · Canada, Jamaica, China
- Languages at home
- 73% English-only · Spanish 24% French/Haitian/Cajun 1% Russian/Polish/Slavic 1%
Political lean MEDSL · Lee
- 2024 margin
- Strong R (+28.4) · D 35.5% · R 63.9%
- 2008→2024 swing
- -18.0pp toward R · 2008: -10.4pp · 2024: -28.4pp
- All cycles
- 2024: R+28.4 2020: R+19.2 2016: R+20.4 2012: R+16.6 2008: R+10.4
Not yet ingested
- Civics
- —
Market trends
- HPI YoY
- ▼ -55.34%
- Current HPI
- 337.0575
- Rent YoY
- ▼ -5.51%
- Metro
- Cape Coral-Fort Myers, FL
- State GDP YoY
- ▲ 3.28%
- F500 in state
- 36
Industry mix (Fortune 500 HQ in FL)
| Industry | F500 HQs | Revenue |
|---|---|---|
| Industrial Technology | 2 | $29B |
|
||
| Insurance | 2 | $17B |
|
||
| Retail | 1 | $60B |
|
||
| Technology Distribution | 1 | $58B |
|
||
| Homebuilding | 1 | $35B |
|
||
| Technology Manufacturing | 1 | $35B |
|
||
Price history
+24.2% since first listed5 events — show timeline
- 2026-06-07 Listed $205,000 FORTMLS
- 2016-12-20 Sold (Public Records) $162,000 Public Records
- 2016-12-19 Price Changed $162,000 BEARMLS
- 2016-12-15 Price Changed $165,000 BEARMLS
- 2016-09-29 Price Changed $165,000 BEARMLS
Property tax history
+12.6%/yrLatest (2025): $3,384 · +5.7% YoY. Source: county tax records.
Cash-flow waterfall
monthlySold comps — $/sqft
last 12 mo · ≤1 miLoading sold comps…