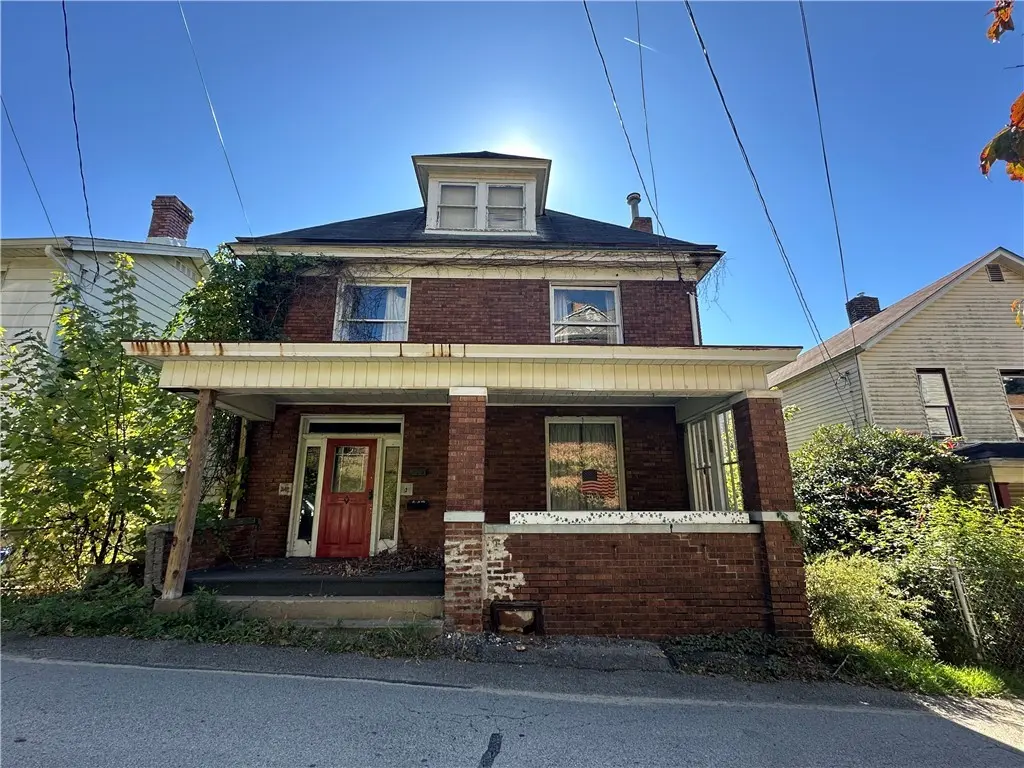
542 Franklin St · Freeport, PA
Flood risk 1/10 · Minimal
- FEMA flood zone
- X (unshaded)
- Chance of flooding over 30 yrs
- 0.0%
- Est. flood insurance / yr
- $507 – $1,088
Fire risk 1/10 · Minimal
- Est. fire insurance / yr
- $511 – $949
Heat risk 4/10 · Minor
- Hot days now (above 97°F)
- 8 days/yr
- Hot days in 30 yrs
- 19 days/yr
Wind risk 2/10 · Minimal
- Chance of severe wind over 30 yrs
- —
Air-quality risk 3/10 · Minor
- Unhealthy air days now
- 3 days/yr
- Unhealthy air days in 30 yrs
- 4 days/yr
Risk factors via First Street. Map © Google.
Why this score? — see what drove the A- grade
The composite is a weighted blend of 9 inputs, each scored 0–100. Each bar is that input's sub-score; the figure is the points it added to the 100-point composite (weight × sub-score).
- Cash flow +30.0/30.0
- 1% rule +10.0/10.0
- DSCR +10.0/10.0
- Appreciation +9.7/10.0
- ARV discount +7.5/15.0
- Schools +5.2/10.0
- Livability +3.2/5.0
- Rent growth +2.5/5.0
- Condition / age +2.5/5.0
$40,000
🖨 Deal sheet (PDF) 📄 Offer letter ✓ Due diligence
Listing remarks MLS
Large 6-bedroom home with more than 2,000 sq. ft of space. Offering an era of woodworking throughout including pocket doors and lovely built-ins. Full of history and heart, this home is waiting for its next chapter to begin.
Key facts
- Pocket doors
- Lovely built-ins
- 4,486 sq ft lot
Tags
Neighborhood map
What this means for you Summary
Snapshot
- This is a 4-bed/1.0-bath single-family listed at $40k.
Deal economics
- At list price, monthly cash flow is $769 ($9k/yr) — positive.
- The deal already cash-flows at list — no discount required.
- Meets the 1% rule at list price ($1k rent vs $40k).
- Recommended offer: $35k (12.0% below list) — sets the bar for market timing.
Location & tenants
- Location reads 65/100 on livability (#1,133 in PA) — a middle-class / working-renter tenant base. Strengths: crime A+, cost of living A+, housing A+; Watch: amenities F, commute F, employment F.
- Freeport Area SD (rural): math 48% / reading 70% proficiency, ranked #74 of 539 in PA (top 14%) — acceptable for families but not a draw, mixed tenant base, ~2y average lease; only 20% free/reduced lunch — higher-income household profile.
- Market conditions: 11 active listings in the ZIP; 58 units permitted in Armstrong County in 2024 (20 in 5+ unit buildings).
Forward outlook
- In year one you build about $4k of equity ($277 loan paydown + $4k appreciation (9.4% local appreciation)).
- Armstrong County population projected at -27% by 2050 — secular population decline; favor cash flow + early exit over multi-decade hold.
- At projected returns (9.4% appreciation + 3.0% rent growth), your $11k cash investment doubles in ~1 year — after that, you're playing with house money.
- By year 8, paydown + projected appreciation supports a ~$35k cash-out refi (75% LTV) — recoverable capital for the next deal without selling this one.
Negotiation context
- It's been on market 243 days — a 12% lower offer ($35k) is reasonable based on typical stale-listing flexibility.
- 7 sale attempts since 28y ago; this cycle's ask is 11% above the opening price — seller raised mid-cycle; expect resistance to lowballs.
- Current owner paid $8k; list at $40k implies a 371% gain — meaningful room to come down on a strong offer.
Risks & watch-outs
- Watch-outs: built in 1900 — expect roof / HVAC / electrical / plumbing capex.
Questions for the listing agent
- It's been on market 243 days. Have you received any prior offers? Is the seller open to a 12% concession, seller financing, or rate buy-down credit?
- Built in 1900 — when were the roof, HVAC, electrical panel, plumbing, and water heater last replaced?
- Why hasn't it sold? Are there any deal-killer items the seller is aware of (foundation, flood, title, zoning, code violations)?
- Is there a deadline driving the sale (1031 exchange, divorce, estate, relocation)? That informs how much negotiation room exists.
- Schools are B-rated — typically a magnet for longer-tenancy family renters. What's the average tenant stay here, and is there a school-zone premium baked into asking?
- What's the average days-on-market for RENTAL listings here right now (not sales)? A rising rental-DOM trend means longer vacancies and softer asking-rent achievability than the comps imply.
- What's the recent tenant-quality profile in this submarket — average credit score on applications, eviction rate, late-payment / NSF rate, and stable-employment percentage? A property-management company in the area should have these aggregated.
- How much new for-sale + rental construction is in the pipeline within 1–3 miles? Heavy new supply typically softens prices + rents 12–24 months out; constrained supply supports both.
Investment metrics
- 1% rule
- 3.31% ✓
- Cap rate
- 29.37%
- Cash-on-cash
- 82.41%
- DSCR
- 4.67
- GRM
- 2.5
CMA / ARV
- ARV (median comp)
- $147,189
- List price
- $40,000
- Delta
- -72.82%
- Verdict
- UNDERPRICED
- Comps
- 4 within 1.0 mi
Show comp detail 4 sales within ~0.75 mi
| Address | Dist | Beds/Ba | Sqft | Sold | Price | $/sf | Match |
|---|---|---|---|---|---|---|---|
| 200 Buffalo St | 0.26mi | 4/2.5 | 2,006 (+0%) | 22mo | $170,000 | $85 | 62 |
| 114 Buffalo St | 0.21mi | 4/2.0 | 2,124 (+6%) | 20mo | $47,000 | $22 | 59 |
| 205 4th St | 0.26mi | 4/1.5 | 2,252 (+13%) | 9mo | $190,000 | $84 | 57 |
| 6 Skiles St | 0.50mi | 3/2.0 (-1) | 1,936 (-3%) | 13mo | $180,000 | $93 | 52 |
Match score weights: distance 35% · size 25% · config 20% · recency 20%. Top-matched comps best support the ARV.
Projected returns pro-forma
9.44% appreciation · 3.0% rent growth · sell at horizon
- IRR
- 91.7%
- Equity multiple
- 7.18×
- Total profit
- $69,266
- Equity at exit
- $34,409
- IRR
- 87.0%
- Equity multiple
- 15.74×
- Total profit
- $165,132
- Equity at exit
- $72,540
Cash invested: $11,200 (down + closing). Projections, not guarantees.
Landlord ↔ Tenant lean methodology
- Overall (STATE)
- 62 Landlord-Friendly
- State Pennsylvania
- 62 Landlord-Friendly · EVEN
- County
- — inherits STATE
- City
- — inherits STATE
ZIP-level market 16229
- Home prices YoY
- 3.6%
- Active inventory
- 11
- Price-to-rent
- 2.5×
Monthly cashflow live
- Estimated rent
- $1,324 medium interval (Pro) →
- Mortgage (P&I)
- −$210
- Tax est. 1.5%
- −$50 /mo · $600/yr
- Insurance
- −$17
- HOA
- −$0
- Vacancy / Maint / Mgmt
- −$278
- Net cashflow
- $769
Break-even live
Sensitivity live
| Price | -10% $797 | -5% $783 | +0% $769 | +5% $755 | +10% $742 |
|---|---|---|---|---|---|
| Rent | -10% $665 | -5% $717 | +0% $769 | +5% $821 | +10% $874 |
| Rate | -1.0pp $789 | -0.5pp $779 | base $769 | +0.5pp $759 | +1.0pp $748 |
UW: 25.0% down · 7.5% · 30yr · 1.5% tax · 5.0% vac · 8.0% maint · 8.0% mgmt
Financing live
Cash to close
- Down payment
- $10,000
- Closing costs
- $1,200
- Reserves months
- —
- Total cash needed
- —
Loan-product check · same deal, 3 products live
Conventional
25% down · 7.5% · 30yr
- Down + closing
- —
- Monthly P&I
- —
- Monthly cashflow
- —
- DSCR
- —
- Eligible?
- —
Personal DTI + credit; lowest rate.
DSCR
20% down · 8.5% · 30yr
- Down + closing
- —
- Monthly P&I
- —
- Monthly cashflow
- —
- DSCR
- —
- Eligible?
- —
No personal income docs; deal must DSCR.
Hard money
10% down · 12.0% · 12mo
- Down + closing
- —
- Monthly P&I
- —
- Monthly cashflow
- —
- DSCR
- —
- Eligible?
- —
Short-term bridge; refi at stabilization.
Listing history 35 events
-
2026-06-21days on market $40,000 Active 243 DOM
-
2026-06-18days on market $40,000 Active 241 DOM
-
2026-06-17days on market $40,000 Active 240 DOM
-
2026-06-16days on market $40,000 Active 239 DOM
-
2026-06-15days on market $40,000 Active 238 DOM
-
2026-06-13days on market $40,000 Active 236 DOM
-
2026-06-12days on market $40,000 Active 235 DOM
-
2026-06-09days on market $40,000 Active 232 DOM
-
2026-06-08days on market $40,000 Active 231 DOM
-
2026-06-08days on market $40,000 Active 230 DOM
-
2026-06-07days on market $40,000 Active 229 DOM
-
2026-06-04days on market $40,000 Active 226 DOM
-
2026-06-02days on market $40,000 Active 225 DOM
-
2026-06-01days on market $40,000 Active 224 DOM
-
2026-05-31days on market $40,000 Active 223 DOM
-
2026-02-15price $40,000 224-char remark
Show marketing remark (224 chars)
Large 6-bedroom home with more than 2,000 sq. ft of space. Offering an era of woodworking throughout including pocket doors and lovely built-ins. Full of history and heart, this home is waiting for its next chapter to begin.
-
2025-11-05price $43,000 224-char remark
Show marketing remark (224 chars)
Large 6-bedroom home with more than 2,000 sq. ft of space. Offering an era of woodworking throughout including pocket doors and lovely built-ins. Full of history and heart, this home is waiting for its next chapter to begin.
-
2025-10-20$36,000 Active 224-char remark
Show marketing remark (224 chars)
Large 6-bedroom home with more than 2,000 sq. ft of space. Offering an era of woodworking throughout including pocket doors and lovely built-ins. Full of history and heart, this home is waiting for its next chapter to begin.
-
2025-06-20$29,900 Active 419-char remark
Show marketing remark (419 chars)
A quality built home in its day! Beautiful shaker style woodwork, Leaded glass cabinets, pocket doors! This home has withstood the years well and is in need of revival! Large 6 bedroom, 2000 sqft, home with a full basement that is extra high and could add to more living space! Huge front porch and possible views from the back! This is definitely a diamond, just needs someone to polish it up in to a great home!!
-
2023-05-07status Active
-
2023-04-01status Pending
-
2023-03-19price $28,000
-
2023-02-07price $32,000
-
2023-01-22price $32,900
-
2023-01-03price $35,800
-
2022-12-18price $39,900
-
2022-10-24price $45,000
-
2022-08-29$48,000 Active
-
2021-11-09soldstatus $8,500 Closed
-
2021-10-22status Pending
-
2021-10-09$15,000 Active
-
2021-09-15$34,000 Active
-
1999-06-03soldstatus $69,000
-
1999-06-03soldstatus $69,000
-
1998-08-31$72,500
ⓘ Source: listings_history table (triggers on properties + properties_extension) + one-shot
backfill from property_details.listing_events for pre-trigger history.
Climate risk First Street
- Flood 1/10 Low FEMA zone X (unshaded) · 0% chance over 30 yrs
- Wildfire 1/10 Low
- Heat 4/10 Moderate 8 d/yr ≥97°F today · 19 d/yr by 30 yrs out
- Wind 2/10 Low
- Air quality 3/10 Moderate 3 unhealthy d/yr today · 4 by 30 yrs out
Nearby sold comps map
Loading sold comps map…
Walkable amenities ~0.75 mi
Loading nearby amenities…
Taxation est. · year 1
- Rental income
- $15,883
- − Mortgage interest
- −$2,241
- − Property taxes
- −$600
- − Insurance
- −$200
- − Repairs & maintenance
- −$1,271
- − Management
- −$1,271
- − Depreciation
- −$1,164
- Taxable income
- $9,137
- Est. tax owed @ 24.0%
- −$2,193
- After-tax cash flow
- $7,037/yr
For passive investors: Depreciation is non-cash, so a rental often shows a tax loss while cash-flowing — sheltering income. Rental losses are passive: they offset passive income freely, and up to $25,000/yr can offset ordinary (W-2) income if you actively participate and your MAGI is under $100k (phasing out to $0 by $150k); unused losses carry forward. On sale, claimed depreciation is recaptured at up to 25%, and gains may owe capital-gains tax (a 1031 exchange can defer both). Figures are a year-1 estimate at your 24.0% rate — not tax advice; consult a CPA.
Schools (NCES district)
- District
- Freeport Area SD
- NCES district ID
- 4210440
- Math proficiency
- 48% ▼ -15.00%
- Reading proficiency
- 70% ▼ -10.00%
- Median HH income
- $64,311
- Composite
- 51.53/100
- National rank
- #1716
- State rank
- #74 of 539 in PA
Livability — Freeport
- Score
- 65/100
- State rank
- #1133
- US rank
- #13004
Category grades
Schools grade is shown separately in the Schools card above.
Census & demographics
- Census place
- Freeport, PA
- Population (ZIP)
- 4,900
Population outlook (Armstrong County) Hauer SSP2
- Today (2025)
- 62,513 people
- By 2030
- 59,579 · -4.7%
- By 2040
- 52,890 · -15.4%
- By 2050
- 45,904 · -26.6%
- By 2075
- 32,023 · -48.8%
- By 2100
- 20,415 · -67.3%
Race, ethnicity, and origin ACS 2023
- Neighborhood character
- Predominantly White (95%)
- Race & ethnicity
- White 95% Two or more races 3% Asian 1%
- Common ancestry
- Romanian 11% Slovak 3% Italian 3%
- Foreign-born
- 1%
- Languages at home
- 98% English-only · Spanish 1% German/W. Germanic 1%
Political lean MEDSL · Armstrong
- 2024 margin
- Solid R (+53.2) · D 23.0% · R 76.2%
- 2008→2024 swing
- -28.6pp toward R · 2008: -24.6pp · 2024: -53.2pp
- All cycles
- 2024: R+53.2 2020: R+52.3 2016: R+52.0 2012: R+37.2 2008: R+24.6
Not yet ingested
- Civics
- —
Market trends
- HPI YoY
- ▲ 9.44%
- Current HPI
- 269.016
- Rent YoY
- —
- Metro
- —
- State GDP YoY
- ▲ 1.68%
- F500 in state
- 34
Industry mix (Fortune 500 HQ in PA)
| Industry | F500 HQs | Revenue |
|---|---|---|
| Healthcare | 2 | $309B |
|
||
| Insurance | 2 | $27B |
|
||
| Telecommunications / Media | 1 | $124B |
|
||
| Industrial Distribution | 1 | $22B |
|
||
| Financial Services | 1 | $20B |
|
||
| Chemicals / Materials | 1 | $18B |
|
||
Price history
-44.8% since first listed20 events — show timeline
- 2026-02-15 Price Changed $40,000 West Penn MLS
- 2025-11-05 Price Changed $43,000 West Penn MLS
- 2025-10-20 Listed $36,000 West Penn MLS
- 2025-06-20 Listed $29,900 West Penn MLS
- 2023-05-07 Relisted — West Penn MLS
- 2023-04-01 Pending — West Penn MLS
- 2023-03-19 Price Changed $28,000 West Penn MLS
- 2023-02-07 Price Changed $32,000 West Penn MLS
- 2023-01-22 Price Changed $32,900 West Penn MLS
- 2023-01-03 Price Changed $35,800 West Penn MLS
- 2022-12-18 Price Changed $39,900 West Penn MLS
- 2022-10-24 Price Changed $45,000 West Penn MLS
- 2022-08-29 Listed $48,000 West Penn MLS
- 2021-11-09 Sold (MLS) $8,500 West Penn MLS
- 2021-10-22 Pending — West Penn MLS
- 2021-10-09 Listed $15,000 West Penn MLS
- 2021-09-15 Listed $34,000 West Penn MLS
- 1999-06-03 Sold (Public Records) $69,000 Public Records
- 1999-06-03 Sold (MLS) $69,000 West Penn MLS
- 1998-08-31 Listed $72,500 West Penn MLS
Property tax history
+1.6%/yrLatest (2026): $2,808 · +3.2% YoY. Source: county tax records.
Cash-flow waterfall
monthlySold comps — $/sqft
last 12 mo · ≤1 miLoading sold comps…