 🌊 Lakefront
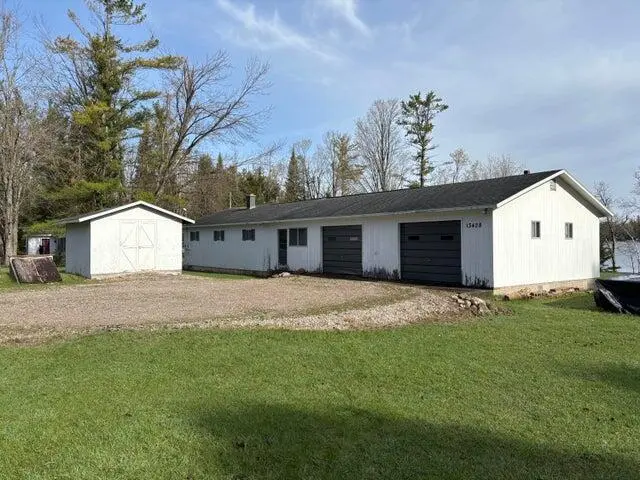
13428 W Shore Dr · Case, MI
Flood risk 1/10 · Minimal
- FEMA flood zone
- —
- Chance of flooding over 30 yrs
- 0.0%
- Est. flood insurance / yr
- —
Fire risk 3/10 · Minor
- Est. fire insurance / yr
- $784 – $1,456
Heat risk 1/10 · Minimal
- Hot days now (above 94°F)
- 7 days/yr
- Hot days in 30 yrs
- 13 days/yr
Wind risk 1/10 · Minimal
- Chance of severe wind over 30 yrs
- —
Air-quality risk 1/10 · Minimal
- Unhealthy air days now
- 0 days/yr
- Unhealthy air days in 30 yrs
- 0 days/yr
Risk factors via First Street. Map © Google.
Why this score? — see what drove the C- grade
The composite is a weighted blend of 9 inputs, each scored 0–100. Each bar is that input's sub-score; the figure is the points it added to the 100-point composite (weight × sub-score).
- Cash flow +17.2/30.0
- ARV discount +15.0/15.0
- DSCR +5.4/10.0
- 1% rule +3.9/10.0
- Schools +2.8/10.0
- Rent growth +2.5/5.0
- Livability +2.5/5.0
- Condition / age +2.5/5.0
- Appreciation +0.0/10.0
$112,500
🖨 Deal sheet (PDF) 📄 Offer letter ✓ Due diligence
Listing remarks
TO NO FAULT OF IT'S OWN, this place is back on the Market!! Lots of shoreline on all-sports Rainy Lake for this price, along with a vacant lot directly across the road! Spacious lawn area with wide open views of the lake. The cottage is laid out to be a 2 bedroom, 1 bathroom place, and also features an attached 2 car garage plus huge entryway/laundry room. Current heat source would be wood, but natural gas is at the road available for hookup, along with fiber optic internet. Use all your waterfront on the lake side and put up a garage or pole barn across the road, or use it to stay on in a camper.
Key facts
- Spacious lawn area
- 1.3 acre lot
- 2 garage spots
Tags
Property features AI
Finance
- HOA & community: Homeowners association with an annual fee of $231 (about $19.25/month)
Exterior
- Parking: Attached 2-car garage
- Utilities: Private well water; Septic tank
- Home design: Single-family residence; Residential waterfront property
- Exterior features: On waterfront (Rainy Lake); Gravel road access; Approximately 1.3-acre lot; Subdivision: West Rainy Lake Sub; Directions: From Millersburg, take County Rd. 638 to Wildcat Hwy. to Rainy Lake Rd. to Five Mile Rd. that turns into Rainy Lake Rd. again. Take West Shore Drive and look for signs.
Interior
- Bathrooms: 1 full bathroom
- Heating & cooling: Wood heating; Wood stove
- Interior features: Wood burning stove
- Laundry & utility: Laundry on main level; Crawl space basement
Neighborhood map
What this means for you Summary
Snapshot
- This is a 3-bed/2.0-bath single-family listed at $112k.
Deal economics
- At list price, monthly cash flow is $81 ($968/yr) — positive.
- The deal already cash-flows at list — no discount required.
- To meet the 1% rule (rent ≥ 1% of price), the offer needs to be $100k (11.0% below list).
- Recommended offer: $100k (11.0% below list) — sets the bar for 1% rule.
Location & tenants
- Location reads: area grade C — affects rentability + tenant quality, not the cash-flow math above.
- Onaway Area Community School District (rural): math 27% / reading 40% proficiency, ranked #328 of 540 in MI (top 61%) — families likely to look elsewhere, expect single-tenant / working-renter base with shorter leases.
- Zoned schools: Onaway Elementary School (math 32% / reading 32%, grade F, #814 of 1,397 statewide, top 61%, 257 students, 62% FRL); Onaway Middle School (math 27% / reading 47%, grade F, #248 of 493 statewide, top 53%, 124 students, 56% FRL); Onaway Senior High School (math 15% / reading 44%, grade F, #428 of 713 statewide, top 62%, 160 students, 48% FRL) — zoned schools at 55% FRL track the district average.
- Market conditions: 39 active listings in the ZIP; 46 units permitted in Presque Isle County in 2024 (0 in 5+ unit buildings).
Forward outlook
- Local home prices are declining (-3.0%/yr); year-one equity from $778 of loan paydown is wiped out by about $3k of value loss. Plan a longer hold.
- Presque Isle County population projected at -31% by 2050 — secular population decline; favor cash flow + early exit over multi-decade hold.
Negotiation context
- It's been on market 32 days — a 3% lower offer ($109k) is reasonable based on typical stale-listing flexibility.
- 2 sale attempts with the ask held roughly flat each time — persistent listings suggest the price (not the market) is what's stuck; bring a comps-based counter.
- Current owner paid $70k; list at $112k implies a 61% gain — meaningful room to come down on a strong offer.
Questions for the listing agent
- It's been on market 32 days. Have you received any prior offers? Is the seller open to a 11% concession, seller financing, or rate buy-down credit?
- Built in 1970 — when were the roof, HVAC, electrical panel, plumbing, and water heater last replaced?
- What does the HOA fee cover, when was the last increase, and are there any pending special assessments or reserve-fund shortfalls?
- Is there a deadline driving the sale (1031 exchange, divorce, estate, relocation)? That informs how much negotiation room exists.
- This sits on a lake — are riparian / water-frontage rights deeded with the parcel? Any dock permits, shoreline easements, or HOA water-use restrictions?
- What's the documented flood / surge / shoreline-erosion history here (FEMA AND non-FEMA — e.g., storm surge, creek backup, septic-field saturation)?
- Any water-quality or seasonal algae-bloom issues that affect tenant satisfaction or short-term-rental demand?
- What's the average days-on-market for RENTAL listings here right now (not sales)? A rising rental-DOM trend means longer vacancies and softer asking-rent achievability than the comps imply.
- What's the recent tenant-quality profile in this submarket — average credit score on applications, eviction rate, late-payment / NSF rate, and stable-employment percentage? A property-management company in the area should have these aggregated.
- How much new for-sale + rental construction is in the pipeline within 1–3 miles? Heavy new supply typically softens prices + rents 12–24 months out; constrained supply supports both.
Investment metrics
- 1% rule
- 0.89% ✗
- Cap rate
- 7.15%
- Cash-on-cash
- 3.07%
- DSCR
- 1.14
- GRM
- 9.4
CMA / ARV
- ARV (median comp)
- $217,114
- List price
- $112,500
- Delta
- -48.18%
- Verdict
- UNDERPRICED
- Comps
- 10 within 1.0 mi
Show comp detail 4 sales within ~0.75 mi
| Address | Dist | Beds/Ba | Sqft | Sold | Price | $/sf | Match |
|---|---|---|---|---|---|---|---|
| 13204 W Shore Dr | 0.25mi | 2/1.0 (-1) | 1,200 (+4%) | 13mo | $220,000 | $183 | 62 |
| 13634 N Shore Dr | 0.47mi | 2/1.0 (-1) | 1,120 (-3%) | 7mo | $235,000 | $210 | 58 |
| 13704 W Shore Dr | 0.30mi | 2/1.0 (-1) | 1,071 (-7%) | 22mo | $251,000 | $234 | 46 |
| 11549 E Shore Dr | 0.71mi | 3/2.0 | 1,248 (+8%) | 20mo | $120,000 | $96 | 36 |
Match score weights: distance 35% · size 25% · config 20% · recency 20%. Top-matched comps best support the ARV.
Projected returns pro-forma
-3.0% appreciation · 3.0% rent growth · sell at horizon
- IRR
- -11.5%
- Equity multiple
- 0.58×
- Total profit
- $-13,116
- Equity at exit
- $16,774
- IRR
- -2.3%
- Equity multiple
- 0.84×
- Total profit
- $-4,910
- Equity at exit
- $9,727
Cash invested: $31,500 (down + closing). Projections, not guarantees.
Landlord ↔ Tenant lean methodology
- Overall (STATE)
- 62 Landlord-Friendly
- State Michigan
- 62 Landlord-Friendly · EVEN
- County
- — inherits STATE
- City
- — inherits STATE
ZIP-level market 49759
- Home prices YoY
- -28.4%
- Active inventory
- 39
- Price-to-rent
- 9.4×
Monthly cashflow live
- Estimated rent
- $1,001 medium interval (Pro) →
- Mortgage (P&I)
- −$590
- Tax from tax record
- −$55 /mo · $655/yr
- Insurance
- −$47
- HOA
- −$19
- Vacancy / Maint / Mgmt
- −$210
- Net cashflow
- $81
Break-even live
Sensitivity live
| Price | -10% $144 | -5% $113 | +0% $81 | +5% $49 | +10% $17 |
|---|---|---|---|---|---|
| Rent | -10% $2 | -5% $41 | +0% $81 | +5% $120 | +10% $160 |
| Rate | -1.0pp $137 | -0.5pp $109 | base $81 | +0.5pp $52 | +1.0pp $22 |
UW: 25.0% down · 7.5% · 30yr · 1.5% tax · 5.0% vac · 8.0% maint · 8.0% mgmt
Financing live
Cash to close
- Down payment
- $28,125
- Closing costs
- $3,375
- Reserves months
- —
- Total cash needed
- —
Loan-product check · same deal, 3 products live
Conventional
25% down · 7.5% · 30yr
- Down + closing
- —
- Monthly P&I
- —
- Monthly cashflow
- —
- DSCR
- —
- Eligible?
- —
Personal DTI + credit; lowest rate.
DSCR
20% down · 8.5% · 30yr
- Down + closing
- —
- Monthly P&I
- —
- Monthly cashflow
- —
- DSCR
- —
- Eligible?
- —
No personal income docs; deal must DSCR.
Hard money
10% down · 12.0% · 12mo
- Down + closing
- —
- Monthly P&I
- —
- Monthly cashflow
- —
- DSCR
- —
- Eligible?
- —
Short-term bridge; refi at stabilization.
HOA detail
- Monthly dues
- $19 · $228/yr
- Likely covers
- watergasinternet
Listing history 19 events
-
2026-06-21days on market $112,500 Active 32 DOM
-
2026-06-21days on market $112,500 Active 31 DOM
-
2026-06-18days on market $112,500 Active 29 DOM
-
2026-06-17days on market $112,500 Active 28 DOM
-
2026-06-16days on market $112,500 Active 27 DOM
-
2026-06-15days on market $112,500 Active 26 DOM
-
2026-06-13days on market $112,500 Active 24 DOM
-
2026-06-12days on market $112,500 Active 23 DOM
-
2026-06-09days on market $112,500 Active 20 DOM
-
2026-06-08days on market $112,500 Active 19 DOM
-
2026-06-07days on market $112,500 Active 18 DOM
-
2026-06-07days on market $112,500 Active 17 DOM
-
2026-06-04days on market $112,500 Active 14 DOM
-
2026-06-02days on market $112,500 Active 13 DOM
-
2026-06-01days on market $112,500 Active 12 DOM
-
2026-05-31days on market $112,500 Active 11 DOM
-
2026-05-31days on market $112,500 Active 10 DOM
-
2026-05-13$112,500 Active 544-char remark
-
2018-07-23soldstatus $70,000
ⓘ Source: listings_history table (triggers on properties + properties_extension) + one-shot
backfill from property_details.listing_events for pre-trigger history.
Tax reassessment forecast MI · Partial reset (capped growth)
- Current annual tax
- $655 · $55/mo
- Projected year-2 tax
- $1,194 · $99/mo
- Expected delta
- +$539/yr (+$45/mo · 82.3%)
ⓘ Screening estimate from a state-policy table — verify with the county assessor before closing.
Climate risk First Street
- Flood 1/10 Low 0% chance over 30 yrs
- Wildfire 3/10 Moderate
- Heat 1/10 Low 7 d/yr ≥94°F today · 13 d/yr by 30 yrs out
- Wind 1/10 Low
- Air quality 1/10 Low 0 unhealthy d/yr today · 0 by 30 yrs out
Nearby sold comps map
Loading sold comps map…
Walkable amenities ~0.75 mi
Loading nearby amenities…
Taxation est. · year 1
- Rental income
- $12,017
- − Mortgage interest
- −$6,302
- − Property taxes
- −$655
- − Insurance
- −$562
- − Repairs & maintenance
- −$961
- − Management
- −$961
- − HOA
- −$228
- − Depreciation
- −$3,273
- Taxable loss
- −$926
- Est. tax savings @ 24.0%
- +$222
- After-tax cash flow
- $1,191/yr
For passive investors: Depreciation is non-cash, so a rental often shows a tax loss while cash-flowing — sheltering income. Rental losses are passive: they offset passive income freely, and up to $25,000/yr can offset ordinary (W-2) income if you actively participate and your MAGI is under $100k (phasing out to $0 by $150k); unused losses carry forward. On sale, claimed depreciation is recaptured at up to 25%, and gains may owe capital-gains tax (a 1031 exchange can defer both). Figures are a year-1 estimate at your 24.0% rate — not tax advice; consult a CPA.
Schools (NCES district)
- District
- Onaway Area Community School District
- NCES district ID
- 2626400
- Math proficiency
- 27% ▼ -22.00%
- Reading proficiency
- 40% ▼ -5.00%
- Median HH income
- $36,848
- Composite
- 27.8/100
- National rank
- #6889
- State rank
- #328 of 540 in MI
Livability — Case
No livability data for this city. (Only ~50 U.S. cities are tracked.)
Census & demographics
- Population (ZIP)
- 1,492
Population outlook (Presque Isle County) Hauer SSP2
- Today (2025)
- 11,675 people
- By 2030
- 10,939 · -6.3%
- By 2040
- 9,337 · -20.0%
- By 2050
- 8,046 · -31.1%
- By 2075
- 6,378 · -45.4%
- By 2100
- 5,045 · -56.8%
Race, ethnicity, and origin ACS 2023
- Neighborhood character
- Predominantly White (94%)
- Race & ethnicity
- White 94% Two or more races 3% Hispanic / Latino 2% Black 1%
- Common ancestry
- Romanian 12% Lithuanian 5% Slovak 3%
- Foreign-born
- 1% · Canada
- Languages at home
- 98% English-only · Spanish 1%
Political lean MEDSL · Presque Isle
- 2024 margin
- Strong R (+29.0) · D 34.7% · R 63.7% · Other 1.5%
- 2008→2024 swing
- -30.5pp toward R · 2008: 1.5pp · 2024: -29.0pp
- All cycles
- 2024: R+29.0 2020: R+29.1 2016: R+28.9 2012: R+8.5 2008: D+1.5
Not yet ingested
- Civics
- —
Market trends
- HPI YoY
- ▼ -61.37%
- Current HPI
- 155.061
- Rent YoY
- —
- Metro
- —
- State GDP YoY
- ▲ 1.37%
- F500 in state
- 28
Industry mix (Fortune 500 HQ in MI)
| Industry | F500 HQs | Revenue |
|---|---|---|
| Automotive Parts | 3 | $48B |
|
||
| Automotive | 2 | $372B |
|
||
| Chemicals | 1 | $45B |
|
||
| Automotive Retail | 1 | $29B |
|
||
| Healthcare / Medical Devices | 1 | $23B |
|
||
| Automotive Technology | 1 | $20B |
|
||
Price history
+60.7% since first listed4 events — show timeline
- 2026-05-28 Relisted — WWMLS
- 2026-05-21 Pending — WWMLS
- 2026-05-13 Listed $112,500 WWMLS
- 2018-07-23 Sold (Public Records) $70,000 Public Records
Property tax history
-1.1%/yrLatest (2025): $655 · -68.9% YoY. Source: county tax records.
Cash-flow waterfall
monthlySold comps — $/sqft
last 12 mo · ≤1 miLoading sold comps…