103 White City St · Longview, TX
Flood risk 1/10 · Minimal
- FEMA flood zone
- X (unshaded)
- Chance of flooding over 30 yrs
- 0.0%
- Est. flood insurance / yr
- $507 – $1,088
Fire risk 3/10 · Minor
- Est. fire insurance / yr
- $1,222 – $2,270
Heat risk 7/10 · Major
- Hot days now (above 111°F)
- 7 days/yr
- Hot days in 30 yrs
- 25 days/yr
Wind risk 6/10 · Moderate
- Chance of severe wind over 30 yrs
- 57.0%
Air-quality risk 2/10 · Minimal
- Unhealthy air days now
- 1 days/yr
- Unhealthy air days in 30 yrs
- 1 days/yr
Risk factors via First Street. Map © Google.
Why this score? — see what drove the B- grade
The composite is a weighted blend of 9 inputs, each scored 0–100. Each bar is that input's sub-score; the figure is the points it added to the 100-point composite (weight × sub-score).
- Cash flow +30.0/30.0
- 1% rule +10.0/10.0
- DSCR +10.0/10.0
- ARV discount +7.5/15.0
- Schools +4.0/10.0
- Livability +3.7/5.0
- Rent growth +3.3/5.0
- Condition / age +1.0/5.0
- Appreciation +0.0/10.0
$25,000
🖨 Deal sheet 📄 Offer letter ✓ Due diligence
Listing remarks MLS
101 White City in Longview, TX is a great opportunity for an investor or buyer looking for a renovation project. This property is being sold as-is and will require repairs and updates throughout, offering strong potential for the right buyer willing to put in the work. Please use caution when viewing, as some areas of the home have uneven surfaces and may require attention. Ideal for cash buyers or experienced renovators ready to bring it back to life. Property next-door available as well.
Key facts
- 0.26 acre lot
- Built 1940
- Listed 118 days
Neighborhood map
What this means for you Summary
Snapshot
- This is a 2-bed/1.0-bath single-family listed at $25k. Condition is rated poor.
Deal economics
- At list price, monthly cash flow is $541 ($6k/yr) — positive.
- The deal already cash-flows at list — no discount required.
- Meets the 1% rule at list price ($903 rent vs $25k).
- Recommended offer: $23k (9.0% below list) — sets the bar for market timing.
- Cap rate 32.2% vs local median 3.0% in Longview — top-decile yield for the area; either an underpriced asset or a hidden risk that comps aren't pricing in. Stress-test before assuming the spread holds.
Location & tenants
- Location reads 73/100 on livability (#213 in TX) — a middle-class / working-renter tenant base. Strengths: cost of living A+, housing A+, health & safety A+; Watch: employment C-, crime D+, schools D.
- Longview ISD (urban): math 49% / reading 46% proficiency, ranked #244 of 826 in TX (top 30%) — families likely to look elsewhere, expect single-tenant / working-renter base with shorter leases; 66% free/reduced lunch — lower-income household profile, screen leases tightly.
- Market conditions: Rents rising (+3.3%/yr); 153 active listings in the ZIP; 8 comparable units currently listed for rent nearby; rentals at typical pace (median 21d on market — plan ~3-4 weeks tenant-placement turnaround); 193 units permitted in Gregg County in 2024 (0 in 5+ unit buildings).
- This rent is only 16% of the median local income ($66k/yr) — well below the 30% rent-burden line; pricing power to push rent on renewal without tenant pushback.
Forward outlook
- Local home prices are declining (-3.0%/yr); year-one equity from $173 of loan paydown is wiped out by about $750 of value loss. Plan a longer hold.
- At projected returns (-3.0% appreciation + 3.3% rent growth), your $7k cash investment doubles in ~2 years — after that, you're playing with house money.
Negotiation context
- It's been on market 119 days — a 9% lower offer ($23k) is reasonable based on typical stale-listing flexibility.
Risks & watch-outs
- Watch-outs: built in 1940 — expect roof / HVAC / electrical / plumbing capex.
- Climate carrying-cost: major wind risk, 57% chance of damaging wind over 30y; extreme-heat days projected 7→25/yr by 2055 (HVAC capex compounding) — expect insurance premiums to compound above CPI over the hold.
Questions for the listing agent
- It's been on market 119 days. Have you received any prior offers? Is the seller open to a 9% concession, seller financing, or rate buy-down credit?
- Have any recent inspections been done? Can we get a copy of the seller's disclosures and any deferred-maintenance estimates?
- Built in 1940 — when were the roof, HVAC, electrical panel, plumbing, and water heater last replaced?
- Why hasn't it sold? Are there any deal-killer items the seller is aware of (foundation, flood, title, zoning, code violations)?
- Is there a deadline driving the sale (1031 exchange, divorce, estate, relocation)? That informs how much negotiation room exists.
- Schools are D-rated, which usually means shorter tenancies and higher turnover. Who's the typical renter profile here, and what's been the actual vacancy rate?
- Crime grade is D in this area — have there been break-ins, vandalism, or insurance claims at this property in the last 3 years? What carrier currently insures it and at what premium?
- What's the average days-on-market for RENTAL listings here right now (not sales)? A rising rental-DOM trend means longer vacancies and softer asking-rent achievability than the comps imply.
- What's the recent tenant-quality profile in this submarket — average credit score on applications, eviction rate, late-payment / NSF rate, and stable-employment percentage? A property-management company in the area should have these aggregated.
- How much new for-sale + rental construction is in the pipeline within 1–3 miles? Heavy new supply typically softens prices + rents 12–24 months out; constrained supply supports both.
Investment metrics
- 1% rule
- 3.61% ✓
- Cap rate
- 32.24%
- Cash-on-cash
- 92.66%
- DSCR
- 5.12
- GRM
- 2.3
CMA / ARV
- ARV (median comp)
- $56,279
- List price
- $25,000
- Delta
- -55.58%
- Verdict
- UNDERPRICED
- Comps
- 2 within 1.0 mi
Show comp detail 1 sale within ~0.75 mi
| Address | Dist | Beds/Ba | Sqft | Sold | Price | $/sf | Match |
|---|---|---|---|---|---|---|---|
| 214 W Eckman St | 0.35mi | 2/1.0 | 672 (+12%) | 15mo | $99,900 | $149 | 51 |
Match score weights: distance 35% · size 25% · config 20% · recency 20%. Top-matched comps best support the ARV.
Projected returns pro-forma
-3.0% appreciation · 3.29% rent growth · sell at horizon
- IRR
- 93.8%
- Equity multiple
- 5.38×
- Total profit
- $30,652
- Equity at exit
- $3,728
- IRR
- 96.6%
- Equity multiple
- 11.31×
- Total profit
- $72,166
- Equity at exit
- $2,162
Cash invested: $7,000 (down + closing). Projections, not guarantees.
Landlord ↔ Tenant lean methodology
- Overall (STATE)
- 87 Strongly Landlord-Friendly
- State Texas
- 87 Strongly Landlord-Friendly · R+5
- County
- — inherits STATE
- City
- — inherits STATE
ZIP-level market 75601
- Home prices YoY
- -29.9%
- Rents YoY
- 3.3%
- Active inventory
- 153
- Price-to-rent
- 2.3×
Monthly cashflow live
- Estimated rent
- $903 high interval (Pro) →
- Mortgage (P&I)
- −$131
- Tax est. 1.5%
- −$31 /mo · $375/yr
- Insurance
- −$10
- HOA
- −$0
- Vacancy / Maint / Mgmt
- −$190
- Net cashflow
- $541
Break-even live
UW: 25.0% down · 7.5% · 30yr · 1.5% tax · 5.0% vac · 8.0% maint · 8.0% mgmt
Financing live
Cash to close
- Down payment
- $6,250
- Closing costs
- $750
- Reserves months
- —
- Total cash needed
- —
Loan-product check · same deal, 3 products live
Conventional
25% down · 7.5% · 30yr
- Down + closing
- —
- Monthly P&I
- —
- Monthly cashflow
- —
- DSCR
- —
- Eligible?
- —
Personal DTI + credit; lowest rate.
DSCR
20% down · 8.5% · 30yr
- Down + closing
- —
- Monthly P&I
- —
- Monthly cashflow
- —
- DSCR
- —
- Eligible?
- —
No personal income docs; deal must DSCR.
Hard money
10% down · 12.0% · 12mo
- Down + closing
- —
- Monthly P&I
- —
- Monthly cashflow
- —
- DSCR
- —
- Eligible?
- —
Short-term bridge; refi at stabilization.
Rent comps 8 comps
| Address | Beds | Baths | Sqft | Rent | $/sqft | DOM | Units | Dist |
|---|---|---|---|---|---|---|---|---|
| 406 S Fredonia St Unit B Longview, TX | 1.0 | 1.0 | 550 | $750 | $1.36 | 43d | 1 | 0.13mi |
| 717 S Green St Longview, TX | 1.0 | 1.0 | 624 | $795 | $1.27 | 21d | 1 | 0.27mi |
| 717 S Green St Longview, TX | 1.0–2.0 | 1.0 | 752 | $895 | $1.19 | 13d | 2 | 0.27mi |
| 906 E Cotton St Unit C Longview, TX | 1.0 | 1.0 | 600 | $555 | $0.93 | 43d | 1 | 0.65mi |
| 437 N Fredonia St Apt 217 Longview, TX | 1.0 | 1.0 | 600 | $700 | $1.17 | 21d | 1 | 0.72mi |
| 437 N Fredonia St Apt 212 Longview, TX | 1.0 | 1.0 | 600 | $700 | $1.17 | 43d | 1 | 0.72mi |
| 301 E Arden Dr Longview, TX | 2.0 | 1.0 | 650 | $850 | $1.31 | 13d | 1 | 1.41mi |
| 1100 McCann Rd Longview, TX | 1.0–2.0 | 1.0–2.0 | 812 | $1,595 | $1.96 | 13d | 30 | 1.47mi |
Listing history 20 events
-
2026-06-19days on market $25,000 Active 119 DOM
-
2026-06-18days on market $25,000 Active 118 DOM
-
2026-06-17days on market $25,000 Active 117 DOM
-
2026-06-16days on market $25,000 Active 116 DOM
-
2026-06-15days on market $25,000 Active 115 DOM
-
2026-06-14days on market $25,000 Active 113 DOM
-
2026-06-13days on market $25,000 Active 112 DOM
-
2026-06-10days on market $25,000 Active 110 DOM
-
2026-06-09days on market $25,000 Active 109 DOM
-
2026-06-08days on market $25,000 Active 108 DOM
-
2026-06-07days on market $25,000 Active 107 DOM
-
2026-06-05days on market $25,000 Active 104 DOM
-
2026-06-03days on market $25,000 Active 103 DOM
-
2026-06-02days on market $25,000 Active 102 DOM
-
2026-06-01days on market $25,000 Active 101 DOM
-
2026-05-31days on market $25,000 Active 100 DOM
-
2026-05-30days on market $25,000 Active 99 DOM
-
2026-05-18price $25,000 494-char remark
Show marketing remark (494 chars)
101 White City in Longview, TX is a great opportunity for an investor or buyer looking for a renovation project. This property is being sold as-is and will require repairs and updates throughout, offering strong potential for the right buyer willing to put in the work. Please use caution when viewing, as some areas of the home have uneven surfaces and may require attention. Ideal for cash buyers or experienced renovators ready to bring it back to life. Property next-door available as well.
-
2026-04-08price $30,000 494-char remark
Show marketing remark (494 chars)
101 White City in Longview, TX is a great opportunity for an investor or buyer looking for a renovation project. This property is being sold as-is and will require repairs and updates throughout, offering strong potential for the right buyer willing to put in the work. Please use caution when viewing, as some areas of the home have uneven surfaces and may require attention. Ideal for cash buyers or experienced renovators ready to bring it back to life. Property next-door available as well.
-
2026-02-20$35,000 Active 494-char remark
Show marketing remark (494 chars)
101 White City in Longview, TX is a great opportunity for an investor or buyer looking for a renovation project. This property is being sold as-is and will require repairs and updates throughout, offering strong potential for the right buyer willing to put in the work. Please use caution when viewing, as some areas of the home have uneven surfaces and may require attention. Ideal for cash buyers or experienced renovators ready to bring it back to life. Property next-door available as well.
ⓘ Source: listings_history table (triggers on properties + properties_extension) + one-shot
backfill from property_details.listing_events for pre-trigger history.
Climate risk First Street
- Flood 1/10 Low FEMA zone X (unshaded) · 0% chance over 30 yrs
- Wildfire 3/10 Moderate
- Heat 7/10 Severe 7 d/yr ≥111°F today · 25 d/yr by 30 yrs out
- Wind 6/10 Major 57% chance of damaging wind over 30 yrs
- Air quality 2/10 Low 1 unhealthy d/yr today · 1 by 30 yrs out
Nearby sold comps map
Loading sold comps map…
Walkable amenities ~0.75 mi
Loading nearby amenities…
Taxation est. · year 1
- Rental income
- $10,835
- − Mortgage interest
- −$1,400
- − Property taxes
- −$375
- − Insurance
- −$125
- − Repairs & maintenance
- −$867
- − Management
- −$867
- − Depreciation
- −$727
- Taxable income
- $6,473
- Est. tax owed @ 24.0%
- −$1,554
- After-tax cash flow
- $4,933/yr
For passive investors: Depreciation is non-cash, so a rental often shows a tax loss while cash-flowing — sheltering income. Rental losses are passive: they offset passive income freely, and up to $25,000/yr can offset ordinary (W-2) income if you actively participate and your MAGI is under $100k (phasing out to $0 by $150k); unused losses carry forward. On sale, claimed depreciation is recaptured at up to 25%, and gains may owe capital-gains tax (a 1031 exchange can defer both). Figures are a year-1 estimate at your 24.0% rate — not tax advice; consult a CPA.
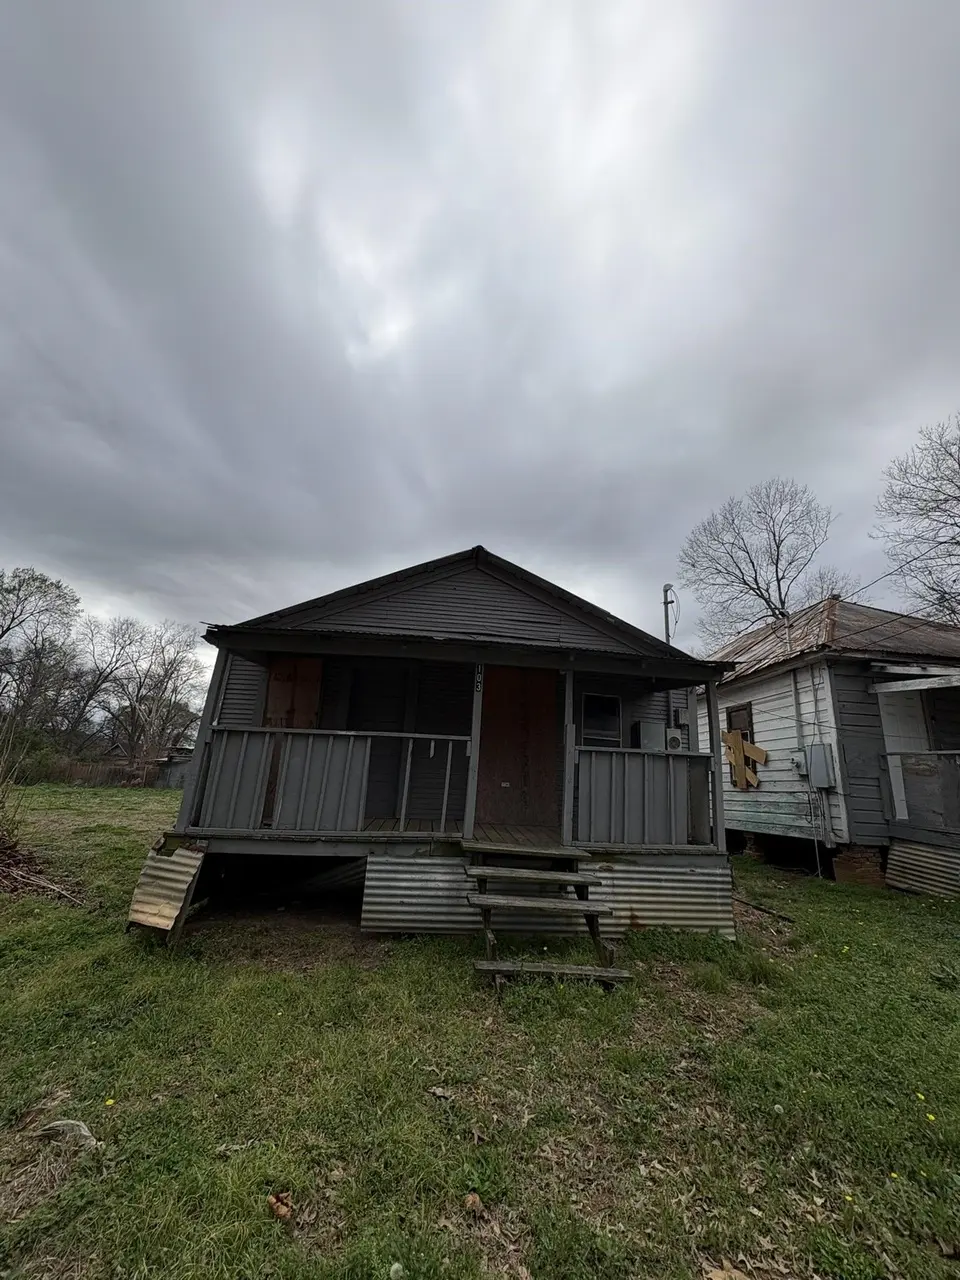
Condition & rehab AI · 1 photo
This property requires extensive repairs and updates, including structural repairs, exterior and interior renovations, and system upgrades, making it a significant project for an experienced renovator or investor.
Repairs flagged
- Major siding — Severe weathering and missing shingles
- Major roof — Exposed rafters and missing shingles
- Major flooring — Uneven surfaces and potential structural issues
- Major interior walls/paint — Paint peeling and potential structural issues
- Major systems — No visible systems, but likely in need of major updates
Value-add opportunities
- Both structural repairs — Stabilizing the foundation and addressing structural issues
- Both exterior siding and roof replacement — Improving curb appeal and structural integrity
- Both interior painting and repairs — Enhancing the home's appearance and value
- Both system upgrades — Improving energy efficiency and functionality
Renovation cost estimate screening
| Repair item | Severity | Est. cost |
|---|---|---|
| siding · Severe weathering and missing shingles | Major | $15,000–50,000 |
| roof · Exposed rafters and missing shingles | Major | $15,000–50,000 |
| flooring · Uneven surfaces and potential structural issues | Major | $15,000–50,000 |
| interior walls/paint · Paint peeling and potential structural issues | Major | $15,000–50,000 |
| systems · No visible systems, but likely in need of major updates | Major | $15,000–50,000 |
| Total estimated repair cost · 5 items | $75,000–250,000 |
Value-add ROI direction
- Both structural repairs — Stabilizing the foundation and addressing structural issues ↑
- Both exterior siding and roof replacement — Improving curb appeal and structural integrity ↑
- Both interior painting and repairs — Enhancing the home's appearance and value ↑
- Both system upgrades — Improving energy efficiency and functionality ↑
ⓘ Cost ranges are severity-bucket heuristics (US national rule-of-thumb). Get contractor quotes + a written scope before underwriting a rehab budget.
Schools (NCES district)
- District
- Longview ISD
- NCES district ID
- 4828110
- Math proficiency
- 49% ▼ -4.00%
- Reading proficiency
- 46% ▼ -1.00%
- Median HH income
- $39,837
- Composite
- 39.76/100
- National rank
- #3889
- State rank
- #244 of 826 in TX
Livability — Longview
- Score
- 73/100
- State rank
- #213
- US rank
- #5287
Category grades
Schools grade is shown separately in the Schools card above.
Census & demographics
- Census place
- Longview, TX
- County
- Gregg County · 128,826 people
- City population
- 103,792
- Metro
- Longview, TX
- Population (ZIP)
- 15,780
- Household income
- $65,700
- Rent vs Own
- Severe rent burden
- 761.0
Population outlook (Gregg County) Hauer SSP2
- Today (2025)
- 125,947 people
- By 2030
- 126,542 · +0.5%
- By 2040
- 127,311 · +1.1%
- By 2050
- 127,289 · +1.1%
- By 2075
- 124,954 · -0.8%
- By 2100
- 113,737 · -9.7%
Race, ethnicity, and origin ACS 2023
- Neighborhood character
- Diverse neighborhood (Simpson 0.63)
- Race & ethnicity
- White 53% Black 21% Hispanic / Latino 21% Two or more races 13% Asian 3%
- Hispanic origin (detail)
- Mexican 17%
- Common ancestry
- Lithuanian 3% Slovak 3% Romanian 1%
- Foreign-born
- 10% · Canada, Vietnam
- Languages at home
- 81% English-only · Spanish 16% Other Indo-European 1% Other Asian/Pacific 1%
Political lean MEDSL · Gregg
- 2024 margin
- Solid R (+42.2) · D 28.5% · R 70.7%
- 2008→2024 swing
- -4.6pp toward R · 2008: -37.6pp · 2024: -42.2pp
- All cycles
- 2024: R+42.2 2020: R+36.9 2016: R+41.3 2012: R+39.5 2008: R+37.6
Not yet ingested
- Civics
- —
Market trends
- HPI YoY
- ▼ -107.73%
- Current HPI
- 252.0752
- Rent YoY
- ▲ 3.29%
- Metro
- Longview, TX
- State GDP YoY
- ▲ 3.95%
- F500 in state
- 110
Industry mix (Fortune 500 HQ in TX)
| Industry | F500 HQs | Revenue |
|---|---|---|
| Energy | 16 | $1,198B |
|
||
| Technology | 5 | $198B |
|
||
| Engineering / Construction | 4 | $72B |
|
||
| Energy Services | 3 | $60B |
|
||
| Utilities | 3 | $41B |
|
||
| Healthcare | 2 | $330B |
|
||
Price history
-28.6% since first listed3 events — show timeline
- 2026-05-18 Price Changed $25,000 LAAR
- 2026-04-08 Price Changed $30,000 LAAR
- 2026-02-20 Listed $35,000 LAAR
Cash-flow waterfall
monthlySold comps — $/sqft
last 12 mo · ≤1 miLoading sold comps…