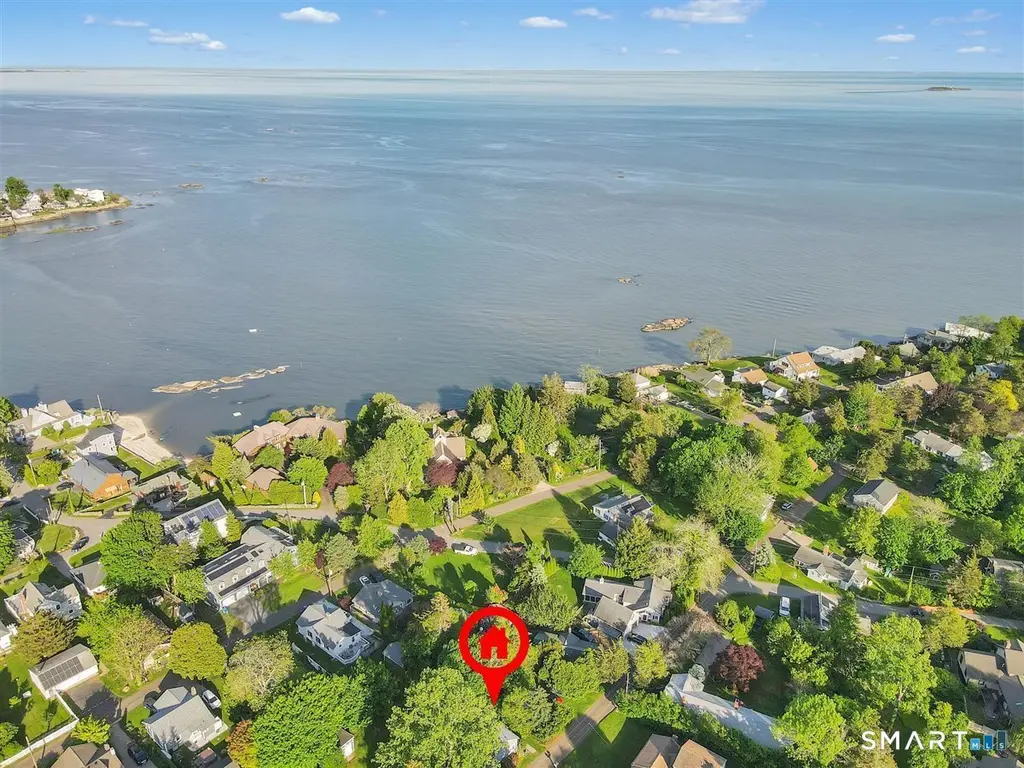
51 Highland Ave · Guilford Center, CT
Flood risk 1/10 · Minimal
- FEMA flood zone
- X (unshaded)
- Chance of flooding over 30 yrs
- 0.0%
- Est. flood insurance / yr
- $507 – $1,088
Fire risk 1/10 · Minimal
- Est. fire insurance / yr
- $829 – $1,539
Heat risk 6/10 · Moderate
- Hot days now (above 93°F)
- 7 days/yr
- Hot days in 30 yrs
- 17 days/yr
Wind risk 8/10 · Major
- Chance of severe wind over 30 yrs
- 80.0%
Air-quality risk 4/10 · Minor
- Unhealthy air days now
- 5 days/yr
- Unhealthy air days in 30 yrs
- 7 days/yr
Risk factors via First Street. Map © Google.
Why this score? — see what drove the C grade
The composite is a weighted blend of 9 inputs, each scored 0–100. Each bar is that input's sub-score; the figure is the points it added to the 100-point composite (weight × sub-score).
- Cash flow +18.0/30.0
- ARV discount +15.0/15.0
- Schools +6.3/10.0
- DSCR +5.6/10.0
- 1% rule +4.6/10.0
- Livability +4.1/5.0
- Rent growth +2.5/5.0
- Condition / age +2.5/5.0
- Appreciation +0.0/10.0
$600,000
🖨 Deal sheet 📄 Offer letter ✓ Due diligence
Listing remarks
This special neighborhood is cherished for its sense of community, tranquility, and generations of families who return year after year. Take evening strolls along the shoreline, watch breathtaking sunsets over Long Island Sound, and embrace the vacation lifestyle every day. This Cape Cod style home offers 4 bedrooms, 1 1/2 bath and sits on a generous . 23-acre double lot, offering potential expansion opportunities. The flexible floor plan features two bedrooms, a full bath, and laundry on the main level, with two additional bedrooms and a half bath on the second floor. A living room opens to a deck, creating the perfect setting for outdoor entertaining, summer BBQs, and relaxing after a day
Key facts
- 0.23 acre lot
- Built 1952
- Listed 7 days
Property features AI
Finance
- HOA & community: Homeowners association with annual fee of $300; Association fee includes lake/beach access
Exterior
- Utilities: Private well water; Septic system; Electric service
- Home design: Single-family home
- Construction: Frame construction with wood siding (gray); Asphalt shingle roof; Block and concrete foundation
- Exterior features: Level lot; Deck; Shed; Beach rights and walk-to-water access (association required); Part of a water community
Interior
- Kitchen: Oven/Range; Refrigerator; Dishwasher
- Bedrooms: 4 bedrooms
- Bathrooms: 1 full bathroom; 1 half bathroom
- Heating & cooling: Baseboard heating (electric); Window air conditioning unit; 40-gallon electric hot water tank
- Interior features: Open floor plan; Cable available; Has attic with storage space and access via hatch; Crawl space basement
- Laundry & utility: Stackable washer and dryer on the main level
Neighborhood map
What this means for you Summary
Snapshot
- This is a 4-bed/1.5-bath single-family listed at $600k.
Deal economics
- At list price, monthly cash flow is $513 ($6k/yr) — positive.
- The deal already cash-flows at list — no discount required.
- To meet the 1% rule (rent ≥ 1% of price), the offer needs to be $575k (4.1% below list).
- Recommended offer: $575k (4.1% below list) — sets the bar for 1% rule.
- Cap rate 7.3% vs local median 3.1% in Guilford Center — top-decile yield for the area; either an underpriced asset or a hidden risk that comps aren't pricing in. Stress-test before assuming the spread holds.
Location & tenants
- Location reads 82/100 on livability (#10 in CT, #1,186 nationally) — a professional / high-income tenant draw. Strengths: crime A+, employment A+, health & safety A+; Watch: cost of living F.
- Guilford School District (suburban): math 64% / reading 75% proficiency, ranked #19 of 153 in CT (top 12%) — acceptable for families but not a draw, mixed tenant base, ~2y average lease; only 6% free/reduced lunch — higher-income household profile.
- Zoned schools: A. W. Cox School (math 67% / reading 72%, grade A-, #78 of 553 statewide, top 17%, 262 students, 13% FRL); Guilford High School (math 60% / reading 84%, grade B+, #14 of 194 statewide, top 8%, 1,048 students, 11% FRL).
- Market conditions: 108 active listings in the ZIP; 3 comparable units currently listed for rent nearby; rentals lingering (median 44d on market — plan ~5-8 weeks vacancy on turnover, expect pricing pressure); 67% of comp listings sitting > 30 days — soft ceiling on asking rent; 1,059 units permitted in South Central Connecticut Planning Region in 2024 (779 in 5+ unit buildings).
Forward outlook
- Local home prices are declining (-3.0%/yr); year-one equity from $4k of loan paydown is wiped out by about $18k of value loss. Plan a longer hold.
Negotiation context
- Only 7 days on market — expect competitive offers; lowballing is unlikely to land.
Risks & watch-outs
- Watch-outs: built in 1952 — expect roof / HVAC / electrical / plumbing capex.
- Climate carrying-cost: severe wind risk, 80% chance of damaging wind over 30y; extreme-heat days projected 7→17/yr by 2055 (HVAC capex compounding) — expect insurance premiums to compound above CPI over the hold.
Questions for the listing agent
- Built in 1952 — when were the roof, HVAC, electrical panel, plumbing, and water heater last replaced?
- What does the HOA fee cover, when was the last increase, and are there any pending special assessments or reserve-fund shortfalls?
- Is there a deadline driving the sale (1031 exchange, divorce, estate, relocation)? That informs how much negotiation room exists.
- Schools are A-rated — typically a magnet for longer-tenancy family renters. What's the average tenant stay here, and is there a school-zone premium baked into asking?
- What's the average days-on-market for RENTAL listings here right now (not sales)? A rising rental-DOM trend means longer vacancies and softer asking-rent achievability than the comps imply.
- What's the recent tenant-quality profile in this submarket — average credit score on applications, eviction rate, late-payment / NSF rate, and stable-employment percentage? A property-management company in the area should have these aggregated.
- How much new for-sale + rental construction is in the pipeline within 1–3 miles? Heavy new supply typically softens prices + rents 12–24 months out; constrained supply supports both.
Investment metrics
- 1% rule
- 0.96% ✗
- Cap rate
- 7.32%
- Cash-on-cash
- 3.67%
- DSCR
- 1.16
- GRM
- 8.7
CMA / ARV
- ARV (on-the-fly)
- $996,770
- Comps found
- 1
Show comp detail 1 sale within ~0.75 mi
| Address | Dist | Beds/Ba | Sqft | Sold | Price | $/sf | Match |
|---|---|---|---|---|---|---|---|
| 59 Cedar Grove Rd | 0.45mi | 3/1.5 (-1) | 1,409 (+7%) | 0mo | $1,067,500 | $758 | 62 |
Match score weights: distance 35% · size 25% · config 20% · recency 20%. Top-matched comps best support the ARV.
Projected returns pro-forma
-3.0% appreciation · 3.0% rent growth · sell at horizon
- IRR
- -10.5%
- Equity multiple
- 0.62×
- Total profit
- $-64,514
- Equity at exit
- $89,462
- IRR
- -1.2%
- Equity multiple
- 0.92×
- Total profit
- $-14,010
- Equity at exit
- $51,877
Cash invested: $168,000 (down + closing). Projections, not guarantees.
Landlord ↔ Tenant lean methodology
- Overall (STATE)
- 27 Tenant-Leaning
- State Connecticut
- 27 Tenant-Leaning · D+7
- County
- — inherits STATE
- City
- — inherits STATE
ZIP-level market 06437
- Active inventory
- 108
- Price-to-rent
- 8.7×
Monthly cashflow live
- Estimated rent
- $5,755 medium interval (Pro) →
- Mortgage (P&I)
- −$3,146
- Tax from tax record
- −$611 /mo · $7,337/yr
- Insurance
- −$250
- HOA
- −$25
- Vacancy / Maint / Mgmt
- −$1,208
- Net cashflow
- $513
Break-even live
UW: 25.0% down · 7.5% · 30yr · 1.5% tax · 5.0% vac · 8.0% maint · 8.0% mgmt
Financing live
Cash to close
- Down payment
- $150,000
- Closing costs
- $18,000
- Reserves months
- —
- Total cash needed
- —
Loan-product check · same deal, 3 products live
Conventional
25% down · 7.5% · 30yr
- Down + closing
- —
- Monthly P&I
- —
- Monthly cashflow
- —
- DSCR
- —
- Eligible?
- —
Personal DTI + credit; lowest rate.
DSCR
20% down · 8.5% · 30yr
- Down + closing
- —
- Monthly P&I
- —
- Monthly cashflow
- —
- DSCR
- —
- Eligible?
- —
No personal income docs; deal must DSCR.
Hard money
10% down · 12.0% · 12mo
- Down + closing
- —
- Monthly P&I
- —
- Monthly cashflow
- —
- DSCR
- —
- Eligible?
- —
Short-term bridge; refi at stabilization.
Rent comps 3 comps
| Address | Beds | Baths | Sqft | Rent | $/sqft | DOM | Units | Dist |
|---|---|---|---|---|---|---|---|---|
| 92 High Ridge Rd Unit MONTH OF AUGUST 2026 Guilford, CT | 3.0 | 3.0 | 1316 | $8,000 | $6.08 | 43d | 1 | 0.34mi |
| 92 High Ridge Rd Unit June 2026 2 Weeks Guilford, CT | 3.0 | 3.0 | 1316 | $4,000 | $3.04 | 43d | 1 | 0.34mi |
| 67 Chimney Corner Cir Guilford, CT | 5.0 | 3.5 | 1269 | $3,800 | $2.99 | 3d | 1 | 1.31mi |
HOA detail
- Monthly dues
- $25 · $300/yr
Listing history 8 events
-
2026-06-13statusdays on market $600,000 Under Contract 7 DOM
-
2026-06-10days on market $600,000 Active 5 DOM
-
2026-06-09days on market $600,000 Active 4 DOM
-
2026-06-08days on market $600,000 Active 3 DOM
-
2026-06-07status $600,000 Active 2 DOM
-
2026-06-03days on market $600,000 Coming Soon 2 DOM
-
2026-06-01remarks 699-char remark
-
2026-06-01$600,000 Coming Soon 1 DOM
ⓘ Source: listings_history table (triggers on properties + properties_extension) + one-shot
backfill from property_details.listing_events for pre-trigger history.
Tax reassessment forecast CT · Partial reset (capped growth)
- Current annual tax
- $7,337 · $611/mo
- Projected year-2 tax
- $10,088 · $841/mo
- Expected delta
- +$2,752/yr (+$229/mo · 37.5%)
ⓘ Screening estimate from a state-policy table — verify with the county assessor before closing.
Climate risk First Street
- Flood 1/10 Low FEMA zone X (unshaded) · 0% chance over 30 yrs
- Wildfire 1/10 Low
- Heat 6/10 Major 7 d/yr ≥93°F today · 17 d/yr by 30 yrs out
- Wind 8/10 Severe 80% chance of damaging wind over 30 yrs
- Air quality 4/10 Moderate 5 unhealthy d/yr today · 7 by 30 yrs out
Nearby sold comps map
Loading sold comps map…
Walkable amenities ~0.75 mi
Loading nearby amenities…
Taxation est. · year 1
- Rental income
- $69,056
- − Mortgage interest
- −$33,609
- − Property taxes
- −$7,337
- − Insurance
- −$3,000
- − Repairs & maintenance
- −$5,525
- − Management
- −$5,525
- − HOA
- −$300
- − Depreciation
- −$17,455
- Taxable loss
- −$3,693
- Est. tax savings @ 24.0%
- +$886
- After-tax cash flow
- $7,046/yr
For passive investors: Depreciation is non-cash, so a rental often shows a tax loss while cash-flowing — sheltering income. Rental losses are passive: they offset passive income freely, and up to $25,000/yr can offset ordinary (W-2) income if you actively participate and your MAGI is under $100k (phasing out to $0 by $150k); unused losses carry forward. On sale, claimed depreciation is recaptured at up to 25%, and gains may owe capital-gains tax (a 1031 exchange can defer both). Figures are a year-1 estimate at your 24.0% rate — not tax advice; consult a CPA.
Schools (NCES district)
- District
- Guilford School District
- NCES district ID
- 0901800
- Math proficiency
- 64% ▼ -12.00%
- Reading proficiency
- 75% ▼ -7.00%
- Median HH income
- $97,539
- Composite
- 63.46/100
- National rank
- #614
- State rank
- #19 of 153 in CT
Livability — Guilford Center
- Score
- 82/100
- State rank
- #10
- US rank
- #1186
Category grades
Schools grade is shown separately in the Schools card above.
Census & demographics
- Population (ZIP)
- 22,037
Population outlook (South Central Connecticut County) Hauer SSP2
- By 2040
- 608,362
Race, ethnicity, and origin ACS 2023
- Neighborhood character
- Predominantly White (87%)
- Race & ethnicity
- White 87% Two or more races 6% Hispanic / Latino 4% Asian 3% Black 2%
- Common ancestry
- Romanian 7% Lithuanian 3% Slovak 2%
- Foreign-born
- 8% · Canada, China
- Languages at home
- 90% English-only · Spanish 3% Other Indo-European 2% German/W. Germanic 1%
Political lean MEDSL · South Central Connecticut
- 2024 margin
- Strong D (+20.1) · D 59.0% · R 38.9% · Other 2.1%
- All cycles
- 2024: D+20.1
Not yet ingested
- Civics
- —
Market trends
- HPI YoY
- ▼ -267.02%
- Current HPI
- 179.6376
- Rent YoY
- —
- Metro
- —
- State GDP YoY
- ▲ 1.06%
- F500 in state
- 38
Industry mix (Fortune 500 HQ in CT)
| Industry | F500 HQs | Revenue |
|---|---|---|
| Industrial Machinery | 4 | $38B |
|
||
| Insurance | 3 | $71B |
|
||
| Financial Services | 2 | $25B |
|
||
| Transportation / Logistics | 2 | $18B |
|
||
| Healthcare | 1 | $247B |
|
||
| Telecommunications | 1 | $55B |
|
||
Price history
1 event — show timeline
- 2026-06-01 Coming Soon $600,000 Smart MLS
Property tax history
+3.6%/yrLatest (2023): $7,337 · +19.1% YoY. Source: county tax records.
Cash-flow waterfall
monthlySold comps — $/sqft
last 12 mo · ≤1 miLoading sold comps…