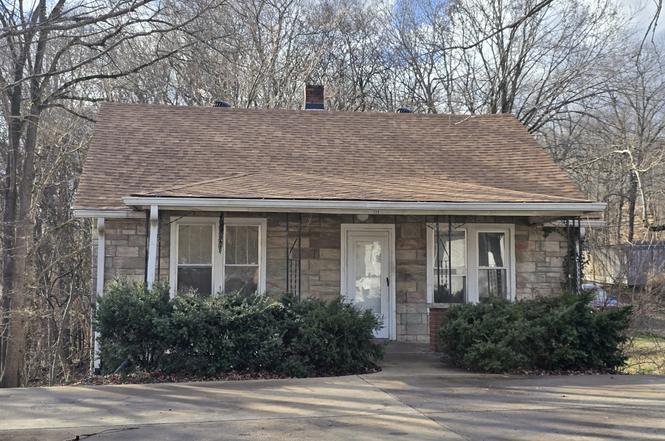
328 Edmondson Ferry Rd · Clarksville, TN
Flood risk 1/10 · Minimal
- FEMA flood zone
- X (unshaded)
- Chance of flooding over 30 yrs
- 0.0%
- Est. flood insurance / yr
- $473 – $860
Fire risk 1/10 · Minimal
- Est. fire insurance / yr
- $949 – $1,763
Heat risk 5/10 · Moderate
- Hot days now (above 108°F)
- 7 days/yr
- Hot days in 30 yrs
- 20 days/yr
Wind risk 4/10 · Minor
- Chance of severe wind over 30 yrs
- 10.0%
Air-quality risk 1/10 · Minimal
- Unhealthy air days now
- 0 days/yr
- Unhealthy air days in 30 yrs
- 0 days/yr
Risk factors via First Street. Map © Google.
Why this score? — see what drove the C- grade
The composite is a weighted blend of 9 inputs, each scored 0–100. Each bar is that input's sub-score; the figure is the points it added to the 100-point composite (weight × sub-score).
- Cash flow +18.0/30.0
- ARV discount +15.0/15.0
- DSCR +5.6/10.0
- Livability +4.2/5.0
- 1% rule +3.8/10.0
- Rent growth +2.8/5.0
- Schools +2.5/10.0
- Condition / age +2.5/5.0
- Appreciation +0.0/10.0
$140,000
🖨 Deal sheet 📄 Offer letter ✓ Due diligence
Listing remarks
Charming cottage-style home full of character and potential, ideally situated on a spacious 0.3-acre lot backing to a wooded tree line. Built in 1946, this 2-bedroom, 1-bath residence offers a unique floor plan. The unfinished basement provides excellent storage or future expansion opportunities. The generous yard offers privacy, room to garden, entertain, or simply enjoy the natural setting. Whether you’re looking for a primary residence, investment opportunity, or renovation project, this property presents a unique chance to own a classic home with potential in a desirable setting. New roof. Interior is freshly painted and home has been professionally cleaned. This home is just a sh
Key facts
- 0.3 acre lot
- 2 parking spots
- Built 1946
Property features AI
Finance
- HOA & community: Pets allowed
Exterior
- Parking: Driveway parking for 2 vehicles (concrete)
- Utilities: Public water; Public sewer; Natural gas available; Water available
- Home design: Single-family residence; One story; Residential property
- Construction: Frame construction; Asphalt roof; Block foundation; Existing (year built indicated as existing)
- Exterior features: Covered porch; Sloped lot
Interior
- Kitchen: Electric oven; Electric range; Refrigerator
- Bedrooms: 2 bedrooms (both on the main level)
- Flooring: Carpet; Laminate
- Bathrooms: 1 full bathroom
- Heating & cooling: Natural gas heating; Central air conditioning
- Interior features: Electric oven and electric range; Refrigerator; Unfinished basement
- Laundry & utility: Washer hookup; Electric dryer hookup
Neighborhood map
What this means for you Summary
Snapshot
- This is a 2-bed/1.0-bath single-family listed at $140k.
Deal economics
- At list price, monthly cash flow is $120 ($1k/yr) — positive.
- The deal already cash-flows at list — no discount required.
- To meet the 1% rule (rent ≥ 1% of price), the offer needs to be $123k (12.3% below list).
- Recommended offer: $123k (12.3% below list) — sets the bar for 1% rule.
- Cap rate 7.3% vs local median 3.5% in Clarksville — top-decile yield for the area; either an underpriced asset or a hidden risk that comps aren't pricing in. Stress-test before assuming the spread holds.
Location & tenants
- Location reads 84/100 on livability (#1 in TN, #798 nationally) — a professional / high-income tenant draw. Strengths: amenities A+, commute A+, cost of living A+; Watch: employment C-, crime D+.
- Montgomery County (urban): math 25% / reading 31% proficiency, ranked #65 of 139 in TN (top 47%) — low school quality limits family demand, transient renter base, plan for 1-2y turnover.
- Zoned schools: Norman Smith Elementary (math 14% / reading 23%, grade F, #691 of 952 statewide, top 73%, 566 students, 0% FRL); Montgomery Central High (math 6% / reading 40%, grade F, #149 of 332 statewide, top 46%, 1,056 students, 0% FRL) — zoned schools average 0% FRL vs 40% district-wide (40 pts lower); this property's tenant base skews higher-income than the district average.
- Market conditions: Rents rising (+1.3%/yr); 604 active listings in the ZIP; 24 comparable units currently listed for rent nearby; rentals at typical pace (median 21d on market — plan ~3-4 weeks tenant-placement turnaround); 2,583 units permitted in Montgomery County in 2024 (617 in 5+ unit buildings).
Forward outlook
- Local home prices are declining (-3.0%/yr); year-one equity from $968 of loan paydown is wiped out by about $4k of value loss. Plan a longer hold.
- Montgomery County population projected at +49% by 2050 — long-run rental-demand tailwind backs the buy-and-hold thesis.
Negotiation context
- It's been on market 97 days — a 9% lower offer ($127k) is reasonable based on typical stale-listing flexibility.
Risks & watch-outs
- Watch-outs: built in 1946 — expect roof / HVAC / electrical / plumbing capex.
- Climate carrying-cost: extreme-heat days projected 7→20/yr by 2055 (HVAC capex compounding) — expect insurance premiums to compound above CPI over the hold.
Questions for the listing agent
- It's been on market 97 days. Have you received any prior offers? Is the seller open to a 12% concession, seller financing, or rate buy-down credit?
- Built in 1946 — when were the roof, HVAC, electrical panel, plumbing, and water heater last replaced?
- Why hasn't it sold? Are there any deal-killer items the seller is aware of (foundation, flood, title, zoning, code violations)?
- Is there a deadline driving the sale (1031 exchange, divorce, estate, relocation)? That informs how much negotiation room exists.
- Crime grade is D in this area — have there been break-ins, vandalism, or insurance claims at this property in the last 3 years? What carrier currently insures it and at what premium?
- What's the average days-on-market for RENTAL listings here right now (not sales)? A rising rental-DOM trend means longer vacancies and softer asking-rent achievability than the comps imply.
- What's the recent tenant-quality profile in this submarket — average credit score on applications, eviction rate, late-payment / NSF rate, and stable-employment percentage? A property-management company in the area should have these aggregated.
- How much new for-sale + rental construction is in the pipeline within 1–3 miles? Heavy new supply typically softens prices + rents 12–24 months out; constrained supply supports both.
Investment metrics
- 1% rule
- 0.88% ✗
- Cap rate
- 7.32%
- Cash-on-cash
- 3.68%
- DSCR
- 1.16
- GRM
- 9.5
CMA / ARV
- ARV (on-the-fly)
- $222,600
- Comps found
- 7
Show comp detail 7 sales within ~0.75 mi
| Address | Dist | Beds/Ba | Sqft | Sold | Price | $/sf | Match |
|---|---|---|---|---|---|---|---|
| 328 Edmondson Ferry Rd | 0.00mi | 2/1.0 | 918 (-13%) | 1mo | $125,000 | $136 | 78 |
| 725 Kingsbury Rd | 0.42mi | 3/1.0 (+1) | 1,050 (0%) | 5mo | $235,000 | $224 | 71 |
| 602 Hidden Valley Dr | 0.12mi | 3/2.0 (+1) | 1,175 (+12%) | 12mo | $270,000 | $230 | 56 |
| 263 Edmondson Ferry Rd | 0.36mi | 2/1.0 | 912 (-13%) | 11mo | $206,000 | $226 | 52 |
| 107 Jay Cir | 0.54mi | 2/1.0 | 1,204 (+15%) | 10mo | $75,000 | $62 | 42 |
| 218 Edmonson Ferry Rd | 0.58mi | 3/2.0 (+1) | 1,092 (+4%) | 18mo | $231,000 | $212 | 42 |
| 229 Scarlet Dr | 0.49mi | 3/2.0 (+1) | 1,205 (+15%) | 8mo | $239,000 | $198 | 37 |
Match score weights: distance 35% · size 25% · config 20% · recency 20%. Top-matched comps best support the ARV.
Projected returns pro-forma
-3.0% appreciation · 1.32% rent growth · sell at horizon
- IRR
- -12.3%
- Equity multiple
- 0.56×
- Total profit
- $-17,129
- Equity at exit
- $20,874
- IRR
- -5.7%
- Equity multiple
- 0.66×
- Total profit
- $-13,381
- Equity at exit
- $12,105
Cash invested: $39,200 (down + closing). Projections, not guarantees.
Landlord ↔ Tenant lean methodology
- Overall (STATE)
- 87 Strongly Landlord-Friendly
- State Tennessee
- 87 Strongly Landlord-Friendly · R+13
- County
- — inherits STATE
- City
- — inherits STATE
ZIP-level market 37040
- Home prices YoY
- -22.0%
- Rents YoY
- 1.3%
- Active inventory
- 604
- Price-to-rent
- 9.5×
Monthly cashflow live
- Estimated rent
- $1,228 high interval (Pro) →
- Mortgage (P&I)
- −$734
- Tax from tax record
- −$58 /mo · $691/yr
- Insurance
- −$58
- HOA
- −$0
- Vacancy / Maint / Mgmt
- −$258
- Net cashflow
- $120
Break-even live
UW: 25.0% down · 7.5% · 30yr · 1.5% tax · 5.0% vac · 8.0% maint · 8.0% mgmt
Financing live
Cash to close
- Down payment
- $35,000
- Closing costs
- $4,200
- Reserves months
- —
- Total cash needed
- —
Loan-product check · same deal, 3 products live
Conventional
25% down · 7.5% · 30yr
- Down + closing
- —
- Monthly P&I
- —
- Monthly cashflow
- —
- DSCR
- —
- Eligible?
- —
Personal DTI + credit; lowest rate.
DSCR
20% down · 8.5% · 30yr
- Down + closing
- —
- Monthly P&I
- —
- Monthly cashflow
- —
- DSCR
- —
- Eligible?
- —
No personal income docs; deal must DSCR.
Hard money
10% down · 12.0% · 12mo
- Down + closing
- —
- Monthly P&I
- —
- Monthly cashflow
- —
- DSCR
- —
- Eligible?
- —
Short-term bridge; refi at stabilization.
Rent comps 24 comps
| Address | Beds | Baths | Sqft | Rent | $/sqft | DOM | Units | Dist |
|---|---|---|---|---|---|---|---|---|
| 706 Kingsbury Rd Clarksville, TN | 3.0 | 1.0 | 1450 | $1,450 | $1.00 | 13d | 1 | 0.35mi |
| 407 Barry Dr Clarksville, TN | 2.0 | 2.5 | 1280 | $1,500 | $1.17 | 20d | 1 | 0.39mi |
| 229 E Johnson Cir Clarksville, TN | 2.0 | 2.0 | 1190 | $1,245 | $1.05 | 20d | 1 | 0.42mi |
| 311 Hawkins Rd Clarksville, TN | 1.0–3.0 | 1.0–1.5 | 788 | $1,072 | $1.36 | 13d | 10 | 0.42mi |
| 105 Kingsbury Ct Unit D Clarksville, TN | 2.0 | 1.5 | 1000 | $900 | $0.90 | 20d | 1 | 0.56mi |
| 940 Kingsbury Dr Unit B Clarksville, TN | 2.0 | 1.0 | 750 | $850 | $1.13 | 13d | 1 | 0.59mi |
| 102 Kingsbury Ct Unit A Clarksville, TN | 2.0 | 1.5 | 1050 | $900 | $0.86 | 20d | 1 | 0.61mi |
| 102 Kingsbury Ct Clarksville, TN | 2.0 | 1.5 | 1020 | $900 | $0.88 | 13d | 1 | 0.61mi |
| 706 Kingsbury Dr Clarksville, TN | 3.0 | 1.0 | 1450 | $1,450 | $1.00 | 13d | 1 | 0.62mi |
| 923 Kingsbury Dr Unit B Clarksville, TN | 2.0 | 1.5 | 1024 | $1,050 | $1.03 | 13d | 1 | 0.68mi |
| 921 Kingsbury Dr Unit C Clarksville, TN | 2.0 | 1.5 | 1024 | $1,200 | $1.17 | 13d | 1 | 0.69mi |
| 127 Davis Ridge Ln Clarksville, TN | 2.0 | 2.5 | 1216 | $1,295 | $1.06 | 20d | 1 | 0.83mi |
| 218 Woodland Valley Ln Clarksville, TN | 2.0 | 2.5 | 1228 | $1,250 | $1.02 | 20d | 1 | 0.88mi |
| 219 Woodland Valley Ln Clarksville, TN | 2.0 | 2.5 | 1228 | $1,250 | $1.02 | 20d | 1 | 0.90mi |
| 1010 Ridgecrest Dr Clarksville, TN | 2.0 | 1.0 | 775 | $1,150 | $1.48 | 13d | 1 | 0.92mi |
| 254 Woodland Valley Ln Clarksville, TN | 2.0 | 2.5 | 1216 | $1,400 | $1.15 | 20d | 1 | 0.93mi |
| 1121 Riverwood Pl Clarksville, TN | 1.0–3.0 | 1.0–2.5 | 938 | $1,142 | $1.22 | 20d | 1 | 0.93mi |
| 1101 Riverwood Pl Clarksville, TN | 2.0 | 2.5 | 1100 | $1,195 | $1.09 | 13d | 1 | 1.00mi |
| 1104 Plymouth Rd Apt A Clarksville, TN | 2.0 | 1.5 | 1100 | $1,250 | $1.14 | 13d | 2 | 1.04mi |
| 767 Monroe St Unit A Clarksville, TN | 3.0 | 1.5 | 1066 | $1,275 | $1.20 | 20d | 1 | 1.08mi |
| 1115 Hillwood Dr Unit E3 Clarksville, TN | 2.0 | 2.5 | 1100 | $1,250 | $1.14 | 20d | 1 | 1.10mi |
| 1115 Hillwood Dr Unit I6 Clarksville, TN | 2.0 | 2.5 | 1100 | $1,180 | $1.07 | 20d | 1 | 1.12mi |
| 945 Cumberland Dr Clarksville, TN | 3.0 | 2.5 | 1350 | $1,500 | $1.11 | 20d | 1 | 1.23mi |
| 947 Wall St Clarksville, TN | 2.0 | 2.5 | 1032 | $1,299 | $1.26 | 13d | 1 | 1.39mi |
Listing history 5 events
-
2026-05-12status Pending
-
2026-03-30price $140,000
-
2026-03-27price $145,000
-
2026-02-04$155,000 Active
-
2026-01-14historical $155,000
ⓘ Source: listings_history table (triggers on properties + properties_extension) + one-shot
backfill from property_details.listing_events for pre-trigger history.
Tax reassessment forecast TN · Resets to sale price
- Current annual tax
- $691 · $58/mo
- Projected year-2 tax
- $994 · $83/mo
- Expected delta
- +$303/yr (+$25/mo · 43.8%)
ⓘ Screening estimate from a state-policy table — verify with the county assessor before closing.
Climate risk First Street
- Flood 1/10 Low FEMA zone X (unshaded) · 0% chance over 30 yrs
- Wildfire 1/10 Low
- Heat 5/10 Major 7 d/yr ≥108°F today · 20 d/yr by 30 yrs out
- Wind 4/10 Moderate 10% chance of damaging wind over 30 yrs
- Air quality 1/10 Low 0 unhealthy d/yr today · 0 by 30 yrs out
Nearby sold comps map
Loading sold comps map…
Walkable amenities ~0.75 mi
Loading nearby amenities…
Taxation est. · year 1
- Rental income
- $14,738
- − Mortgage interest
- −$7,842
- − Property taxes
- −$691
- − Insurance
- −$700
- − Repairs & maintenance
- −$1,179
- − Management
- −$1,179
- − Depreciation
- −$4,073
- Taxable loss
- −$926
- Est. tax savings @ 24.0%
- +$222
- After-tax cash flow
- $1,664/yr
For passive investors: Depreciation is non-cash, so a rental often shows a tax loss while cash-flowing — sheltering income. Rental losses are passive: they offset passive income freely, and up to $25,000/yr can offset ordinary (W-2) income if you actively participate and your MAGI is under $100k (phasing out to $0 by $150k); unused losses carry forward. On sale, claimed depreciation is recaptured at up to 25%, and gains may owe capital-gains tax (a 1031 exchange can defer both). Figures are a year-1 estimate at your 24.0% rate — not tax advice; consult a CPA.
Schools (NCES district)
- District
- Montgomery County
- NCES district ID
- 4703030
- Math proficiency
- 25% ▼ -20.00%
- Reading proficiency
- 31% ▼ -10.00%
- Median HH income
- $50,423
- Composite
- 24.56/100
- National rank
- #7641
- State rank
- #65 of 139 in TN
Livability — Clarksville
- Score
- 84/100
- State rank
- #1
- US rank
- #798
Category grades
Schools grade is shown separately in the Schools card above.
Census & demographics
- Census place
- Clarksville, TN
- County
- Montgomery County · 211,371 people
- City population
- 211,371
- Metro
- Clarksville, TN-KY
- Population (ZIP)
- 64,977
- Household income
- $67,745
- Rent vs Own
- Severe rent burden
- 2670.0
Population outlook (Montgomery County) Hauer SSP2
- Today (2025)
- 236,633 people
- By 2030
- 258,978 · +9.4%
- By 2040
- 305,456 · +29.1%
- By 2050
- 353,147 · +49.2%
- By 2075
- 471,289 · +99.2%
- By 2100
- 564,122 · +138.4%
Race, ethnicity, and origin ACS 2023
- Neighborhood character
- Diverse neighborhood (Simpson 0.61)
- Race & ethnicity
- White 56% Black 25% Two or more races 11% Hispanic / Latino 10% Asian 2%
- Hispanic origin (detail)
- Mexican 6% Puerto Rican 2%
- Common ancestry
- Italian 4% Lithuanian 1% Slovak 1%
- Foreign-born
- 6% · Canada, South Korea
- Languages at home
- 90% English-only · Spanish 5% Other Asian/Pacific 1% Other Indo-European 1%
Political lean MEDSL · Montgomery
- 2024 margin
- R (+18.4) · D 40.0% · R 58.5% · Other 1.5%
- 2008→2024 swing
- -10.5pp toward R · 2008: -7.9pp · 2024: -18.4pp
- All cycles
- 2024: R+18.4 2020: R+12.7 2016: R+18.6 2012: R+10.5 2008: R+7.9
Not yet ingested
- Civics
- —
Market trends
- HPI YoY
- ▼ -75.79%
- Current HPI
- 269.0601
- Rent YoY
- ▲ 1.32%
- Metro
- Clarksville, TN-KY
- State GDP YoY
- ▲ 2.78%
- F500 in state
- 22
Industry mix (Fortune 500 HQ in TN)
| Industry | F500 HQs | Revenue |
|---|---|---|
| Healthcare | 3 | $91B |
|
||
| Retail | 3 | $72B |
|
||
| Transportation / Logistics | 1 | $88B |
|
||
| Paper / Packaging | 1 | $19B |
|
||
| Insurance | 1 | $13B |
|
||
| Energy | 1 | $12B |
|
||
Price history
-9.7% since first listed5 events — show timeline
- 2026-05-12 Pending — REALTRACS as Distributed by MLS Grid
- 2026-03-30 Price Changed $140,000 REALTRACS as Distributed by MLS Grid
- 2026-03-27 Price Changed $145,000 REALTRACS as Distributed by MLS Grid
- 2026-02-04 Listed $155,000 REALTRACS as Distributed by MLS Grid
- 2026-01-14 Coming Soon $155,000 REALTRACS as Distributed by MLS Grid
Property tax history
+6.5%/yrLatest (2025): $691 · +0.0% YoY. Source: county tax records.
Cash-flow waterfall
monthlySold comps — $/sqft
last 12 mo · ≤1 miLoading sold comps…