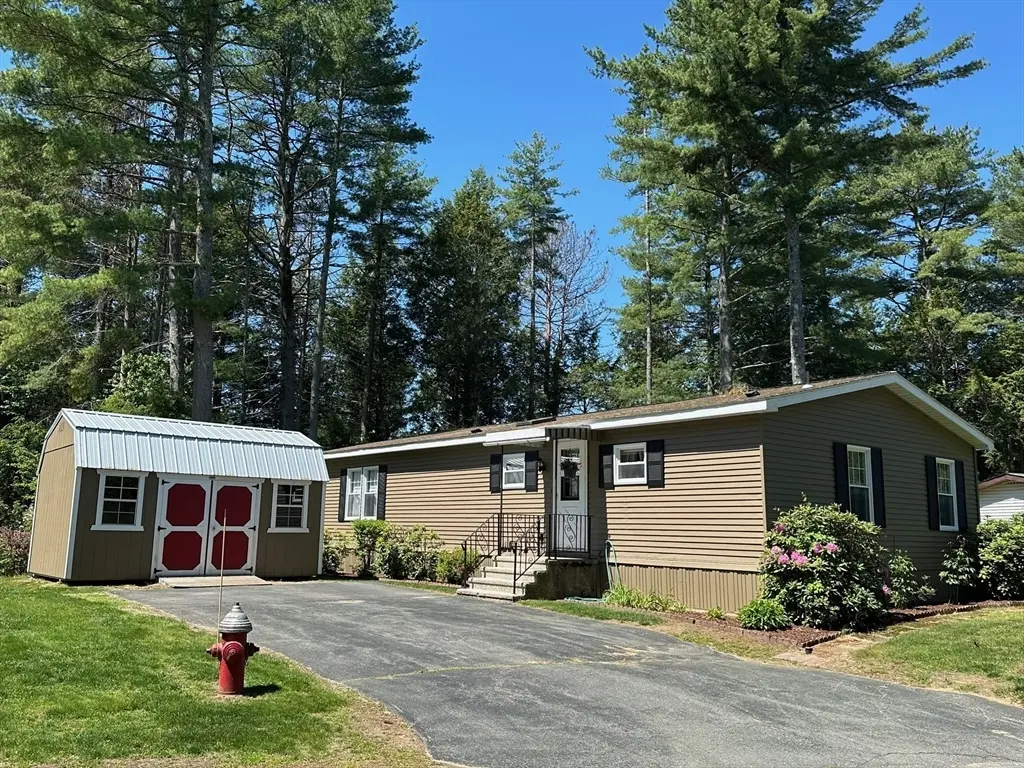
30 Earl Dr · Athol, MA
Flood risk 1/10 · Minimal
- FEMA flood zone
- X
- Chance of flooding over 30 yrs
- 0.0%
- Est. flood insurance / yr
- $507 – $1,088
Fire risk 1/10 · Minimal
- Est. fire insurance / yr
- $915 – $1,699
Heat risk 3/10 · Minor
- Hot days now (above 94°F)
- 7 days/yr
- Hot days in 30 yrs
- 16 days/yr
Wind risk 4/10 · Minor
- Chance of severe wind over 30 yrs
- 17.0%
Air-quality risk 2/10 · Minimal
- Unhealthy air days now
- 1 days/yr
- Unhealthy air days in 30 yrs
- 1 days/yr
Risk factors via First Street. Map © Google.
Why this score? — see what drove the D+ grade
The composite is a weighted blend of 9 inputs, each scored 0–100. Each bar is that input's sub-score; the figure is the points it added to the 100-point composite (weight × sub-score).
- ARV discount +15.0/15.0
- Cash flow +13.8/30.0
- DSCR +4.2/10.0
- 1% rule +3.9/10.0
- Livability +3.7/5.0
- Rent growth +2.5/5.0
- Schools +2.4/10.0
- Condition / age +2.2/5.0
- Appreciation +0.0/10.0
$192,500
🖨 Deal sheet 📄 Offer letter ✓ Due diligence
Listing remarks MLS
Riverbend Woods Adult Community, over 55 community with indoor pool, exercise room, activities, community room and much more. This home has a wonderful Sun Room heated with a Pellet Stove, the windows bring in the outdoors with trees and flowers. There are two master suites, with full baths, vaulted ceilings in the main open concept living area, Central Air Conditioning, Newer windows, roof is 10 years old, storage shed , brick patio, Millers River is in the back yard and a private location .Easy living in this community!!
Key facts
- Private backyard
- Sunroom
- New appliances
Tags
Property features AI
Finance
- Other: Located on a private road; Directions available for access
- HOA & community: Located in a senior community; Community amenities include pool, park, walk/jog trails, and conservation area
Exterior
- Parking: Paved off-street parking; Open parking for 4 vehicles
- Utilities: Public water; Private sewer; Electric service with circuit breakers
- Home design: Mobile home; Single-story (first floor living); Brown exterior; Entry faces private road
- Construction: Modular construction; Slab foundation; Shingle roof; Built (owner-reported, actual/approximate)
- Exterior features: Porch; Storage; Wooded lot; Riverfront waterfront
Interior
- Kitchen: Vaulted ceiling; Laminate flooring; Open to dining area / breakfast nook; Range; Dishwasher; Refrigerator
- Bedrooms: Master bedroom on the first floor with full bathroom and walk-in closet; Second bedroom on the first floor with adjacent full bathroom
- Flooring: Wall-to-wall carpet in living room and bedrooms; Laminate flooring in kitchen and laundry
- Bathrooms: Two full bathrooms; Master bathroom present; Full bath with shower stall
- Heating & cooling: Forced air heating (oil); Central air conditioning
- Interior features: Sun room; Vaulted ceilings; Open floorplan; Dining area; Breakfast bar / nook; Total of 5 rooms
- Laundry & utility: Washer and dryer included; Laundry on the first floor with exterior access; Laundry area with laminate flooring
Neighborhood map
What this means for you Summary
Snapshot
- This is a 2-bed/2.0-bath manufactured listed at $192k. Condition is rated fair.
Deal economics
- At list price, monthly cash flow is $18 ($211/yr) — positive.
- The deal already cash-flows at list — no discount required.
- To meet the 1% rule (rent ≥ 1% of price), the offer needs to be $171k (11.4% below list).
- Recommended offer: $171k (11.4% below list) — sets the bar for 1% rule.
- Cap rate 6.4% vs local median 4.0% in Athol — top-decile yield for the area; either an underpriced asset or a hidden risk that comps aren't pricing in. Stress-test before assuming the spread holds.
Location & tenants
- Location reads 74/100 on livability (#84 in MA, #4,383 nationally) — a middle-class / working-renter tenant base. Strengths: housing A+, health & safety A+, cost of living A-; Watch: employment D, schools F, amenities F.
- Athol-Royalston (town): math 22% / reading 33% proficiency, ranked #265 of 302 in MA (top 88%) — low school quality limits family demand, transient renter base, plan for 1-2y turnover.
- Market conditions: 42 active listings in the ZIP; 2,293 units permitted in Worcester County in 2024 (1,205 in 5+ unit buildings).
Forward outlook
- Local home prices are declining (-3.0%/yr); year-one equity from $1k of loan paydown is wiped out by about $6k of value loss. Plan a longer hold.
Negotiation context
- Only 13 days on market — expect competitive offers; lowballing is unlikely to land.
- 3 sale attempts since 22y ago with the ask held roughly flat each time — persistent listings suggest the price (not the market) is what's stuck; bring a comps-based counter.
- Current owner paid $69k; list at $192k implies a 179% gain — meaningful room to come down on a strong offer.
Questions for the listing agent
- Have any recent inspections been done? Can we get a copy of the seller's disclosures and any deferred-maintenance estimates?
- Is there a deadline driving the sale (1031 exchange, divorce, estate, relocation)? That informs how much negotiation room exists.
- Schools are F-rated, which usually means shorter tenancies and higher turnover. Who's the typical renter profile here, and what's been the actual vacancy rate?
- The area grade is low — what's the realistic commute time and amenity access for the typical tenant pool here? Any planned neighborhood developments (good or bad) we should know about?
- What's the average days-on-market for RENTAL listings here right now (not sales)? A rising rental-DOM trend means longer vacancies and softer asking-rent achievability than the comps imply.
- What's the recent tenant-quality profile in this submarket — average credit score on applications, eviction rate, late-payment / NSF rate, and stable-employment percentage? A property-management company in the area should have these aggregated.
- How much new for-sale + rental construction is in the pipeline within 1–3 miles? Heavy new supply typically softens prices + rents 12–24 months out; constrained supply supports both.
Investment metrics
- 1% rule
- 0.89% ✗
- Cap rate
- 6.40%
- Cash-on-cash
- 0.39%
- DSCR
- 1.02
- GRM
- 9.4
CMA / ARV
- ARV (on-the-fly)
- $243,000
- Comps found
- 10
Show comp detail 10 sales within ~0.75 mi
| Address | Dist | Beds/Ba | Sqft | Sold | Price | $/sf | Match |
|---|---|---|---|---|---|---|---|
| 90 Earl Dr | 0.00mi | 3/2.0 (+1) | 1,352 (+0%) | 1mo | $259,900 | $192 | 94 |
| 124 Miller's River Dr | 0.23mi | 2/2.0 | 1,386 (+3%) | 9mo | $250,000 | $180 | 77 |
| 174 Robert Dr | 0.08mi | 3/2.0 (+1) | 1,400 (+4%) | 13mo | $300,000 | $214 | 75 |
| 189 Robert Dr | 0.09mi | 3/2.0 (+1) | 1,254 (-7%) | 7mo | $227,000 | $181 | 73 |
| 53 Earl | 0.00mi | 3/2.0 (+1) | 1,152 (-15%) | 2mo | $150,000 | $130 | 69 |
| 58 Earl Dr | 0.00mi | 3/2.0 (+1) | 1,150 (-15%) | 5mo | $184,900 | $161 | 66 |
| 47 Earl Dr | 0.01mi | 3/2.0 (+1) | 1,500 (+11%) | 16mo | $200,000 | $133 | 63 |
| 89 Earl Dr | 0.16mi | 3/2.0 (+1) | 1,456 (+8%) | 19mo | $232,000 | $159 | 58 |
| 75 Kelly Ave | 0.51mi | 3/2.0 (+1) | 1,200 (-11%) | 12mo | $236,000 | $197 | 43 |
| 519 East River St #31 | 0.54mi | 3/2.0 (+1) | 1,280 (-5%) | 23mo | $215,000 | $168 | 42 |
Match score weights: distance 35% · size 25% · config 20% · recency 20%. Top-matched comps best support the ARV.
Projected returns pro-forma
-3.0% appreciation · 3.0% rent growth · sell at horizon
- IRR
- -15.7%
- Equity multiple
- 0.44×
- Total profit
- $-30,048
- Equity at exit
- $28,702
- IRR
- -7.2%
- Equity multiple
- 0.54×
- Total profit
- $-24,619
- Equity at exit
- $16,644
Cash invested: $53,900 (down + closing). Projections, not guarantees.
Landlord ↔ Tenant lean methodology
- Overall (STATE)
- 20 Strongly Tenant-Friendly
- State Massachusetts
- 20 Strongly Tenant-Friendly · D+15
- County
- — inherits STATE
- City
- — inherits STATE
ZIP-level market 01331
- Home prices YoY
- -9.9%
- Active inventory
- 42
- Price-to-rent
- 9.4×
Monthly cashflow live
- Estimated rent
- $1,706 medium interval (Pro) →
- Mortgage (P&I)
- −$1,009
- Tax est. 1.5%
- −$241 /mo · $2,888/yr
- Insurance
- −$80
- HOA
- −$0
- Vacancy / Maint / Mgmt
- −$358
- Net cashflow
- $18
Break-even live
UW: 25.0% down · 7.5% · 30yr · 1.5% tax · 5.0% vac · 8.0% maint · 8.0% mgmt
Financing live
Cash to close
- Down payment
- $48,125
- Closing costs
- $5,775
- Reserves months
- —
- Total cash needed
- —
Loan-product check · same deal, 3 products live
Conventional
25% down · 7.5% · 30yr
- Down + closing
- —
- Monthly P&I
- —
- Monthly cashflow
- —
- DSCR
- —
- Eligible?
- —
Personal DTI + credit; lowest rate.
DSCR
20% down · 8.5% · 30yr
- Down + closing
- —
- Monthly P&I
- —
- Monthly cashflow
- —
- DSCR
- —
- Eligible?
- —
No personal income docs; deal must DSCR.
Hard money
10% down · 12.0% · 12mo
- Down + closing
- —
- Monthly P&I
- —
- Monthly cashflow
- —
- DSCR
- —
- Eligible?
- —
Short-term bridge; refi at stabilization.
Listing history 11 events
-
2026-06-18days on market $192,500 Active 13 DOM
-
2026-06-17days on market $192,500 Active 12 DOM
-
2026-06-16days on market $192,500 Active 11 DOM
-
2026-06-15days on market $192,500 Active 10 DOM
-
2026-06-13days on market $192,500 Active 8 DOM
-
2026-06-12days on market $192,500 Active 7 DOM
-
2026-06-09statusdays on market $192,500 Active 4 DOM
-
2026-06-08days on market $192,500 New 3 DOM
-
2026-06-07days on market $192,500 New 2 DOM
-
2026-06-07remarks 684-char remark
-
2026-06-07$192,500 New 1 DOM
ⓘ Source: listings_history table (triggers on properties + properties_extension) + one-shot
backfill from property_details.listing_events for pre-trigger history.
Climate risk First Street
- Flood 1/10 Low FEMA zone X · 0% chance over 30 yrs
- Wildfire 1/10 Low
- Heat 3/10 Moderate 7 d/yr ≥94°F today · 16 d/yr by 30 yrs out
- Wind 4/10 Moderate 17% chance of damaging wind over 30 yrs
- Air quality 2/10 Low 1 unhealthy d/yr today · 1 by 30 yrs out
Nearby sold comps map
Loading sold comps map…
Walkable amenities ~0.75 mi
Loading nearby amenities…
Taxation est. · year 1
- Rental income
- $20,475
- − Mortgage interest
- −$10,783
- − Property taxes
- −$2,888
- − Insurance
- −$962
- − Repairs & maintenance
- −$1,638
- − Management
- −$1,638
- − Depreciation
- −$5,600
- Taxable loss
- −$3,034
- Est. tax savings @ 24.0%
- +$728
- After-tax cash flow
- $939/yr
For passive investors: Depreciation is non-cash, so a rental often shows a tax loss while cash-flowing — sheltering income. Rental losses are passive: they offset passive income freely, and up to $25,000/yr can offset ordinary (W-2) income if you actively participate and your MAGI is under $100k (phasing out to $0 by $150k); unused losses carry forward. On sale, claimed depreciation is recaptured at up to 25%, and gains may owe capital-gains tax (a 1031 exchange can defer both). Figures are a year-1 estimate at your 24.0% rate — not tax advice; consult a CPA.
Condition & rehab AI · 12 photos
This home requires moderate renovations to improve its condition and appeal to buyers and renters. Key areas for improvement include the kitchen, bathroom, and roof.
Repairs flagged
- Minor kitchen cabinets — slight wear
- Minor bathroom fixtures — dated and possibly leaking
- Moderate roof — visible wear
Value-add opportunities
- Both update kitchen cabinets and fixtures — modernizing kitchen would appeal to buyers and renters
- Both paint interior walls — fresh paint enhances curb appeal and interior aesthetics
- Both replace carpeting with hardwood or tile — hardwood or tile flooring would increase both resale and rental value
Renovation cost estimate screening
| Repair item | Severity | Est. cost |
|---|---|---|
| kitchen cabinets · slight wear | Minor | $500–3,000 |
| bathroom fixtures · dated and possibly leaking | Minor | $500–3,000 |
| roof · visible wear | Moderate | $3,000–15,000 |
| Total estimated repair cost · 3 items | $4,000–21,000 |
Value-add ROI direction
- Both update kitchen cabinets and fixtures — modernizing kitchen would appeal to buyers and renters ↑
- Both paint interior walls — fresh paint enhances curb appeal and interior aesthetics ↑
- Both replace carpeting with hardwood or tile — hardwood or tile flooring would increase both resale and rental value ↑
ⓘ Cost ranges are severity-bucket heuristics (US national rule-of-thumb). Get contractor quotes + a written scope before underwriting a rehab budget.
Schools (NCES district)
- District
- Athol-Royalston
- NCES district ID
- 2502160
- Math proficiency
- 22% ▼ -14.00%
- Reading proficiency
- 33% ▼ -5.00%
- Median HH income
- $49,570
- Composite
- 24.05/100
- National rank
- #7764
- State rank
- #265 of 302 in MA
Livability — Athol
- Score
- 74/100
- State rank
- #84
- US rank
- #4383
Category grades
Schools grade is shown separately in the Schools card above.
Census & demographics
- Population (ZIP)
- 13,865
Population outlook (Worcester County) Hauer SSP2
- Today (2025)
- 850,858 people
- By 2030
- 860,403 · +1.1%
- By 2040
- 869,902 · +2.2%
- By 2050
- 869,110 · +2.1%
- By 2075
- 870,120 · +2.3%
- By 2100
- 829,703 · -2.5%
Race, ethnicity, and origin ACS 2023
- Neighborhood character
- Predominantly White (89%)
- Race & ethnicity
- White 89% Hispanic / Latino 5% Two or more races 4% Black 2%
- Hispanic origin (detail)
- Puerto Rican 4%
- Common ancestry
- Lithuanian 14% Romanian 6% Slovak 2%
- Foreign-born
- 3% · Canada
- Languages at home
- 94% English-only · Spanish 2% French/Haitian/Cajun 2% German/W. Germanic 1%
Political lean MEDSL · Worcester
- 2024 margin
- D (+10.0) · D 53.9% · R 43.9% · Other 2.2%
- 2008→2024 swing
- -3.8pp toward R · 2008: 13.8pp · 2024: 10.0pp
- All cycles
- 2024: D+10.0 2020: D+17.8 2016: D+10.5 2012: D+9.2 2008: D+13.8
Not yet ingested
- Civics
- —
Market trends
- HPI YoY
- ▼ -37.02%
- Current HPI
- 336.1238
- Rent YoY
- —
- Metro
- —
- State GDP YoY
- ▲ 2.28%
- F500 in state
- 38
Industry mix (Fortune 500 HQ in MA)
| Industry | F500 HQs | Revenue |
|---|---|---|
| Technology | 3 | $17B |
|
||
| Insurance | 2 | $84B |
|
||
| Retail | 2 | $76B |
|
||
| Life Sciences | 1 | $43B |
|
||
| Energy Technology | 1 | $31B |
|
||
| Aerospace / Defense | 1 | $18B |
|
||
Price history
+140.9% since first listed10 events — show timeline
- 2026-06-05 Listed $192,500 MLS PIN
- 2019-12-30 Sold (MLS) $69,000 MLS PIN
- 2019-12-09 Pending — MLS PIN
- 2019-11-27 Contingent — MLS PIN
- 2019-11-19 Price Changed $69,900 MLS PIN
- 2019-10-16 Price Changed $74,900 MLS PIN
- 2019-09-09 Listed $79,900 MLS PIN
- 2004-06-24 Sold (MLS) $79,900 MLS PIN
- 2004-05-20 Listing Removed — MLS PIN
- 2004-05-18 Listed $79,900 MLS PIN
Cash-flow waterfall
monthlySold comps — $/sqft
last 12 mo · ≤1 miLoading sold comps…