 Duplex
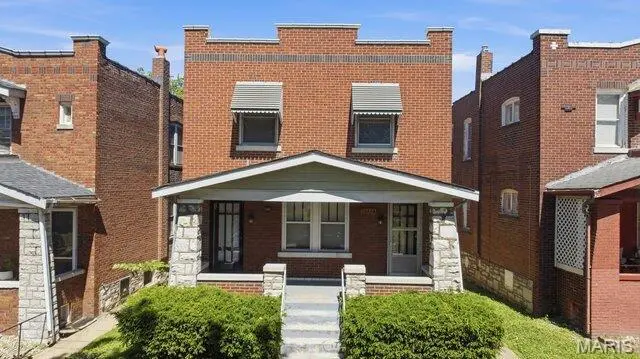
5847 Goener Ave · St. Louis, MO
Flood risk 1/10 · Minimal
- FEMA flood zone
- X (unshaded)
- Chance of flooding over 30 yrs
- 0.0%
- Est. flood insurance / yr
- $473 – $860
Fire risk 1/10 · Minimal
- Est. fire insurance / yr
- $1,054 – $1,958
Heat risk 5/10 · Moderate
- Hot days now (above 108°F)
- 7 days/yr
- Hot days in 30 yrs
- 21 days/yr
Wind risk 2/10 · Minimal
- Chance of severe wind over 30 yrs
- 1.0%
Air-quality risk 3/10 · Minor
- Unhealthy air days now
- 3 days/yr
- Unhealthy air days in 30 yrs
- 4 days/yr
Risk factors via First Street. Map © Google.
Why this score? — see what drove the C- grade
The composite is a weighted blend of 9 inputs, each scored 0–100. Each bar is that input's sub-score; the figure is the points it added to the 100-point composite (weight × sub-score).
- Cash flow +20.7/30.0
- ARV discount +9.7/15.0
- DSCR +6.6/10.0
- 1% rule +4.7/10.0
- Rent growth +3.2/5.0
- Livability +2.5/5.0
- Condition / age +2.5/5.0
- Schools +1.2/10.0
- Appreciation +0.0/10.0
$240,000
🖨 Deal sheet 📄 Offer letter ✓ Due diligence
Multi-family units
County records classify this as Multi-Family (2-4 Unit). Listing-text estimate: 2 units. confirmed
Listing remarks MLS
Great 2 family brick duplex in well established South City area near Joseph R Leisure Park. Being sold AS-IS with a ton of updates remodeling already completed. Both units have central heat and air. Parking available in the back of the structure. newly refinished hardwood floors in both units. Basement has plenty of room for storage. New roof installed in 2020. Refrigerator and stove will stay in both units.
Key facts
- 3,781 sq ft lot
- Built 1926
- Listed 20 days
Property features AI
Finance
- Financial info: No second mortgage reported
Exterior
- Parking: Alley access; Concrete parking areas; On-street parking
- Utilities: Electric service by Ameren
- Home design: Residential income property (2–4 units); Total of 2 units; Above-grade finished area about 2,250 (public records)
- Construction: Concrete construction
- Exterior features: Lot approximately 0.0868 acres; Neighborhood: Boulevard Heights; GPS-friendly directions
Interior
- Bedrooms: Two 2-bedroom units (one unit each)
- Bathrooms: Each unit has 1 bathroom
- Heating & cooling: Natural gas heating; Central air conditioning; Ceiling fans
- Interior features: Has basement with concrete, unfinished space and walk-out access; Seller may consider concessions
- Laundry & utility: Laundry located in basement
Neighborhood map
What this means for you Summary
Snapshot
- This is a 2 × 2-bed/1-bath units multifamily listed at $240k.
Deal economics
- At list price, monthly cash flow is $324 ($4k/yr) — positive. Per door: $162/mo.
- The deal already cash-flows at list — no discount required.
- To meet the 1% rule (rent ≥ 1% of price), the offer needs to be $232k (3.1% below list).
- Recommended offer: $232k (3.1% below list) — sets the bar for 1% rule.
- Cap rate 7.9% vs local median 5.0% in St. Louis — top-decile yield for the area; either an underpriced asset or a hidden risk that comps aren't pricing in. Stress-test before assuming the spread holds.
Location & tenants
- Location reads: area grade C — affects rentability + tenant quality, not the cash-flow math above.
- St. Louis City (urban): math 10% / reading 18% proficiency, ranked #312 of 324 in MO (top 96%) — low school quality limits family demand, transient renter base, plan for 1-2y turnover; 80% free/reduced lunch — lower-income household profile, screen leases tightly.
- Zoned schools: Woerner Elem. (math 8% / reading 17%, grade F, #1,007 of 1,115 statewide, top 91%, 362 students, 99% FRL); Roosevelt High (math 2% / reading 8%, grade F, #517 of 521 statewide, top 100%, 460 students, 99% FRL) — zoned schools average 99% FRL vs 80% district-wide (19 pts higher); higher-poverty schools than district average — tighter screening recommended.
- Market conditions: Rents rising (+2.6%/yr); 255 active listings in the ZIP; 2 comparable units currently listed for rent nearby; 294 units permitted in St. Louis city in 2024 (227 in 5+ unit buildings).
- At $2,325/mo this rent would consume 45% of the median local household income ($61k/yr) (locally 1923% of renters already pay >50% of income on rent) — very limited rent-growth headroom before tenants either downsize or default.
Forward outlook
- Local home prices are declining (-3.0%/yr); year-one equity from $2k of loan paydown is wiped out by about $7k of value loss. Plan a longer hold.
- St. Louis County population projected to shrink 6% by 2050 — rents likely to lag national; underwrite the cash flow, not the appreciation.
Negotiation context
- It's been on market 20 days — a 2% lower offer ($236k) is reasonable based on typical stale-listing flexibility.
- 4 sale attempts since 8y ago with the ask held roughly flat each time — persistent listings suggest the price (not the market) is what's stuck; bring a comps-based counter.
- Current owner paid $185k; 30% above their basis — modest negotiation headroom, anchor on the comps not their cost.
Risks & watch-outs
- Watch-outs: built in 1926 — expect roof / HVAC / electrical / plumbing capex.
- Climate carrying-cost: extreme-heat days projected 7→21/yr by 2055 (HVAC capex compounding) — expect insurance premiums to compound above CPI over the hold.
Questions for the listing agent
- Can we see the unit-by-unit rent roll, current vacancy, and any below-market leases? What's the average tenancy length?
- What capital expenditures (roof, boiler, parking lot, exteriors) have been made in the last 5 years, and what's planned in the next 2?
- Built in 1926 — when were the roof, HVAC, electrical panel, plumbing, and water heater last replaced?
- Is there a deadline driving the sale (1031 exchange, divorce, estate, relocation)? That informs how much negotiation room exists.
- What's the average days-on-market for RENTAL listings here right now (not sales)? A rising rental-DOM trend means longer vacancies and softer asking-rent achievability than the comps imply.
- What's the recent tenant-quality profile in this submarket — average credit score on applications, eviction rate, late-payment / NSF rate, and stable-employment percentage? A property-management company in the area should have these aggregated.
- How much new apartment / multifamily construction is in the pipeline within 1–3 miles? Heavy new supply (>2% of stock underway) typically softens rents 12–24 months out; light construction supports rent growth.
Investment metrics
- 1% rule
- 0.97% ✗
- Cap rate
- 7.91%
- Cash-on-cash
- 5.78%
- DSCR
- 1.26
- GRM
- 8.6
CMA / ARV
- ARV (median comp)
- $252,584
- List price
- $240,000
- Delta
- -4.98%
- Verdict
- FAIR
- Comps
- 20 within 1.0 mi
Show comp detail 12 sales within ~0.75 mi
| Address | Dist | Beds/Ba | Sqft | Sold | Price | $/sf | Match |
|---|---|---|---|---|---|---|---|
| 5600 S Kingshighway Blvd | 0.38mi | 4/2.0 | 2,268 (+1%) | 5mo | $250,000 | $110 | 77 |
| 5425 5425A Christy Boulevard St. Louis Mo. 63116 Blvd | 0.22mi | 4/2.0 | 2,496 (+11%) | 3mo | $149,900 | $60 | 69 |
| 4654 Delor St | 0.51mi | 4/2.0 | 2,316 (+3%) | 2mo | $154,900 | $67 | 69 |
| 5423 Christy Blvd | 0.23mi | 3/2.0 (-1) | 1,968 (-12%) | 6mo | $249,900 | $127 | 58 |
| 5459 Holly Hills Ave | 0.72mi | 4/2.0 | 2,288 (+2%) | 8mo | $299,000 | $131 | 57 |
| 5012 Christy Blvd | 0.53mi | 4/2.0 | 2,426 (+8%) | 7mo | $314,900 | $130 | 56 |
| 4926 Murdoch Ave | 0.72mi | 4/2.0 | 2,100 (-7%) | 2mo | $285,000 | $136 | 53 |
| 4645 Wilcox Ave | 0.48mi | 5/2.0 (+1) | 2,450 (+9%) | 9mo | $346,500 | $141 | 51 |
| 6146 Morganford Rd | 0.36mi | 4/4.0 | 2,552 (+13%) | 6mo | $300,000 | $118 | 48 |
| 4633 Morganford Rd | 0.74mi | 4/2.0 | 2,082 (-8%) | 9mo | $200,000 | $96 | 45 |
| 5503 Rhodes Ave | 0.73mi | 4/2.0 | 1,926 (-14%) | 4mo | $315,000 | $164 | 39 |
| 4615 Quincy St | 0.71mi | 4/4.0 | 2,024 (-10%) | 6mo | $194,900 | $96 | 37 |
Match score weights: distance 35% · size 25% · config 20% · recency 20%. Top-matched comps best support the ARV.
Projected returns pro-forma
-3.0% appreciation · 2.62% rent growth · sell at horizon
- IRR
- -7.8%
- Equity multiple
- 0.71×
- Total profit
- $-19,210
- Equity at exit
- $35,785
- IRR
- 1.3%
- Equity multiple
- 1.09×
- Total profit
- $5,997
- Equity at exit
- $20,751
Cash invested: $67,200 (down + closing). Projections, not guarantees.
Landlord ↔ Tenant lean methodology
- Overall (STATE)
- 81 Strongly Landlord-Friendly
- State Missouri
- 81 Strongly Landlord-Friendly · R+10
- County
- — inherits STATE
- City
- — inherits STATE
ZIP-level market 63116
- Rents YoY
- 2.6%
- Active inventory
- 255
- Price-to-rent
- 17.2×
Monthly cashflow live
- Estimated rent
- $2,325 high interval (Pro) →
- Mortgage (P&I)
- −$1,259
- Tax from tax record
- −$154 /mo · $1,853/yr
- Insurance
- −$100
- HOA
- −$0
- Vacancy / Maint / Mgmt
- −$488
- Net cashflow
- $324
Break-even live
2-unit breakdown (identical units grouped — click to expand)
| Units | Beds | Baths | Est. rent |
|---|---|---|---|
| 2× units | 2 | 1 | $2,324 |
| #1 | 2 | 1 | $1,162 |
| #2 | 2 | 1 | $1,162 |
| Total (2 units) | $2,325 | ||
UW: 25.0% down · 7.5% · 30yr · 1.5% tax · 5.0% vac · 8.0% maint · 8.0% mgmt
Financing live
Cash to close
- Down payment
- $60,000
- Closing costs
- $7,200
- Reserves months
- —
- Total cash needed
- —
Loan-product check · same deal, 3 products live
Conventional
25% down · 7.5% · 30yr
- Down + closing
- —
- Monthly P&I
- —
- Monthly cashflow
- —
- DSCR
- —
- Eligible?
- —
Personal DTI + credit; lowest rate.
DSCR
20% down · 8.5% · 30yr
- Down + closing
- —
- Monthly P&I
- —
- Monthly cashflow
- —
- DSCR
- —
- Eligible?
- —
No personal income docs; deal must DSCR.
Hard money
10% down · 12.0% · 12mo
- Down + closing
- —
- Monthly P&I
- —
- Monthly cashflow
- —
- DSCR
- —
- Eligible?
- —
Short-term bridge; refi at stabilization.
Rent comps 2 comps
| Address | Beds | Baths | Sqft | Rent | $/sqft | DOM | Units | Dist |
|---|---|---|---|---|---|---|---|---|
| 5185 Goethe Ave Fl 1 St. Louis, MO | 3.0 | 2.0 | 1858 | $2,240 | $1.21 | 43d | 1 | 0.62mi |
| 3857 Boulevard Heights Ct Saint Louis, MO | 3.0 | 2.5 | 1697 | $2,250 | $1.33 | 1d | 1 | 1.13mi |
Listing history 24 events
-
2026-06-07statusdays on market $240,000 Pending 20 DOM
-
2026-06-05days on market $240,000 Active 18 DOM
-
2026-06-03days on market $240,000 Active 17 DOM
-
2026-06-02days on market $240,000 Active 16 DOM
-
2026-06-02price $240,000 Active 15 DOM
-
2026-06-01days on market $250,000 Active 15 DOM
-
2026-05-31days on market $250,000 Active 14 DOM
-
2026-05-18$250,000 Active 764-char remark
-
2026-05-16historical $250,000 764-char remark
-
2023-06-27historical
-
2021-05-28soldstatus $185,000
-
2021-05-26soldstatus Closed 411-char remark
Show marketing remark (411 chars)
Great 2 family brick duplex in well established South City area near Joseph R Leisure Park. Being sold AS-IS with a ton of updates remodeling already completed. Both units have central heat and air. Parking available in the back of the structure. newly refinished hardwood floors in both units. Basement has plenty of room for storage. New roof installed in 2020. Refrigerator and stove will stay in both units.
-
2021-03-30status Pending 411-char remark
Show marketing remark (411 chars)
Great 2 family brick duplex in well established South City area near Joseph R Leisure Park. Being sold AS-IS with a ton of updates remodeling already completed. Both units have central heat and air. Parking available in the back of the structure. newly refinished hardwood floors in both units. Basement has plenty of room for storage. New roof installed in 2020. Refrigerator and stove will stay in both units.
-
2021-03-26$179,900 Active 411-char remark
Show marketing remark (411 chars)
Great 2 family brick duplex in well established South City area near Joseph R Leisure Park. Being sold AS-IS with a ton of updates remodeling already completed. Both units have central heat and air. Parking available in the back of the structure. newly refinished hardwood floors in both units. Basement has plenty of room for storage. New roof installed in 2020. Refrigerator and stove will stay in both units.
-
2019-04-09soldstatus $144,000
-
2019-04-02soldstatus Closed
Show marketing remark (208 chars)
Nice Size 2 family in well established South City Area. Garage is being sold AS IS. Both units have Forced Ar Heat and Central . Building has been family owned for many years. City occupancy has been done.
-
2019-03-11status Pending
Show marketing remark (208 chars)
Nice Size 2 family in well established South City Area. Garage is being sold AS IS. Both units have Forced Ar Heat and Central . Building has been family owned for many years. City occupancy has been done.
-
2019-02-11historical Active Under Contract
Show marketing remark (208 chars)
Nice Size 2 family in well established South City Area. Garage is being sold AS IS. Both units have Forced Ar Heat and Central . Building has been family owned for many years. City occupancy has been done.
-
2019-02-08status Active
Show marketing remark (208 chars)
Nice Size 2 family in well established South City Area. Garage is being sold AS IS. Both units have Forced Ar Heat and Central . Building has been family owned for many years. City occupancy has been done.
-
2019-01-29status Pending
Show marketing remark (208 chars)
Nice Size 2 family in well established South City Area. Garage is being sold AS IS. Both units have Forced Ar Heat and Central . Building has been family owned for many years. City occupancy has been done.
-
2019-01-21historical Option
Show marketing remark (208 chars)
Nice Size 2 family in well established South City Area. Garage is being sold AS IS. Both units have Forced Ar Heat and Central . Building has been family owned for many years. City occupancy has been done.
-
2019-01-13price $149,000
Show marketing remark (208 chars)
Nice Size 2 family in well established South City Area. Garage is being sold AS IS. Both units have Forced Ar Heat and Central . Building has been family owned for many years. City occupancy has been done.
-
2018-11-26$159,900 Active
Show marketing remark (208 chars)
Nice Size 2 family in well established South City Area. Garage is being sold AS IS. Both units have Forced Ar Heat and Central . Building has been family owned for many years. City occupancy has been done.
-
2018-11-26historical $159,900
Show marketing remark (208 chars)
Nice Size 2 family in well established South City Area. Garage is being sold AS IS. Both units have Forced Ar Heat and Central . Building has been family owned for many years. City occupancy has been done.
ⓘ Source: listings_history table (triggers on properties + properties_extension) + one-shot
backfill from property_details.listing_events for pre-trigger history.
Tax reassessment forecast MO · Resets to sale price
- Current annual tax
- $1,853 · $154/mo
- Projected year-2 tax
- $2,328 · $194/mo
- Expected delta
- +$475/yr (+$40/mo · 25.6%)
ⓘ Screening estimate from a state-policy table — verify with the county assessor before closing.
Climate risk First Street
- Flood 1/10 Low FEMA zone X (unshaded) · 0% chance over 30 yrs
- Wildfire 1/10 Low
- Heat 5/10 Major 7 d/yr ≥108°F today · 21 d/yr by 30 yrs out
- Wind 2/10 Low 100% chance of damaging wind over 30 yrs
- Air quality 3/10 Moderate 3 unhealthy d/yr today · 4 by 30 yrs out
Nearby sold comps map
Loading sold comps map…
Walkable amenities ~0.75 mi
Loading nearby amenities…
Taxation est. · year 1
- Rental income
- $27,900
- − Mortgage interest
- −$13,444
- − Property taxes
- −$1,853
- − Insurance
- −$1,200
- − Repairs & maintenance
- −$2,232
- − Management
- −$2,232
- − Depreciation
- −$6,982
- Taxable loss
- −$42
- Est. tax savings @ 24.0%
- +$10
- After-tax cash flow
- $3,895/yr
For passive investors: Depreciation is non-cash, so a rental often shows a tax loss while cash-flowing — sheltering income. Rental losses are passive: they offset passive income freely, and up to $25,000/yr can offset ordinary (W-2) income if you actively participate and your MAGI is under $100k (phasing out to $0 by $150k); unused losses carry forward. On sale, claimed depreciation is recaptured at up to 25%, and gains may owe capital-gains tax (a 1031 exchange can defer both). Figures are a year-1 estimate at your 24.0% rate — not tax advice; consult a CPA.
Schools (NCES district)
- District
- St. Louis City
- NCES district ID
- 2929280
- Math proficiency
- 10% ▼ -6.00%
- Reading proficiency
- 18% ▼ -3.00%
- Median HH income
- $35,685
- Composite
- 11.54/100
- National rank
- #9699
- State rank
- #312 of 324 in MO
Livability — St. Louis
No livability data for this city. (Only ~50 U.S. cities are tracked.)
Census & demographics
- Census place
- St. Louis, MO
- County
- Saint Louis City · 254,015 people
- City population
- 283,259
- Metro
- St. Louis, MO-IL
- Population (ZIP)
- 42,170
- Household income
- $61,433
- Rent vs Own
- Severe rent burden
- 1923.0
Population outlook (St. Louis County) Hauer SSP2
- Today (2025)
- 315,737 people
- By 2030
- 313,865 · -0.6%
- By 2040
- 305,439 · -3.3%
- By 2050
- 296,529 · -6.1%
- By 2075
- 271,028 · -14.2%
- By 2100
- 255,359 · -19.1%
Race, ethnicity, and origin ACS 2023
- Neighborhood character
- Diverse neighborhood (Simpson 0.63)
- Race & ethnicity
- White 54% Black 27% Hispanic / Latino 10% Two or more races 8% Asian 5%
- Hispanic origin (detail)
- Mexican 7%
- Common ancestry
- Lithuanian 4% Romanian 2% Italian 2%
- Foreign-born
- 11% · Canada, Vietnam, Philippines
- Languages at home
- 85% English-only · Spanish 6% Vietnamese 2% Arabic 2%
Political lean MEDSL · St. Louis
- 2024 margin
- Solid D (+64.7) · D 81.4% · R 16.7% · Other 2.0%
- 2008→2024 swing
- -3.5pp toward R · 2008: 68.2pp · 2024: 64.7pp
- All cycles
- 2024: D+64.7 2020: D+66.2 2016: D+63.7 2012: D+66.6 2008: D+68.2
Not yet ingested
- Civics
- —
Market trends
- HPI YoY
- ▼ -271.19%
- Current HPI
- 215.7108
- Rent YoY
- ▲ 2.62%
- Metro
- St. Louis, MO-IL
- State GDP YoY
- ▲ 1.84%
- F500 in state
- 20
Industry mix (Fortune 500 HQ in MO)
| Industry | F500 HQs | Revenue |
|---|---|---|
| Healthcare | 1 | $163B |
|
||
| Insurance | 1 | $21B |
|
||
| Industrial Technology | 1 | $17B |
|
||
| Retail | 1 | $16B |
|
||
| Industrial Distribution | 1 | $10B |
|
||
| Utilities | 1 | $9B |
|
||
Price history
+50.1% since first listed19 events — show timeline
- 2026-06-06 Pending — MARIS as Distributed by MLS Grid
- 2026-06-01 Price Changed $240,000 MARIS as Distributed by MLS Grid
- 2026-05-18 Listed $250,000 MARIS as Distributed by MLS Grid
- 2026-05-16 Coming Soon $250,000 MARIS as Distributed by MLS Grid
- 2023-06-27 Rental Removed — APPFOLIO
- 2021-05-28 Sold (Public Records) $185,000 Public Records
- 2021-05-26 Sold (MLS) — MARIS as Distributed by MLS Grid
- 2021-03-30 Pending — MARIS as Distributed by MLS Grid
- 2021-03-26 Listed $179,900 MARIS as Distributed by MLS Grid
- 2019-04-09 Sold (Public Records) $144,000 Public Records
- 2019-04-02 Sold (MLS) — MARIS as Distributed by MLS Grid
- 2019-03-11 Pending — MARIS as Distributed by MLS Grid
- 2019-02-11 Contingent — MARIS as Distributed by MLS Grid
- 2019-02-08 Relisted — MARIS as Distributed by MLS Grid
- 2019-01-29 Pending — MARIS as Distributed by MLS Grid
- 2019-01-21 Contingent — MARIS as Distributed by MLS Grid
- 2019-01-13 Price Changed $149,000 MARIS as Distributed by MLS Grid
- 2018-11-26 Listed $159,900 MARIS as Distributed by MLS Grid
- 2018-11-26 Coming Soon $159,900 MARIS as Distributed by MLS Grid
Property tax history
+5.4%/yrLatest (2024): $1,853 · +5.1% YoY. Source: county tax records.
Cash-flow waterfall
monthlySold comps — $/sqft
last 12 mo · ≤1 miLoading sold comps…