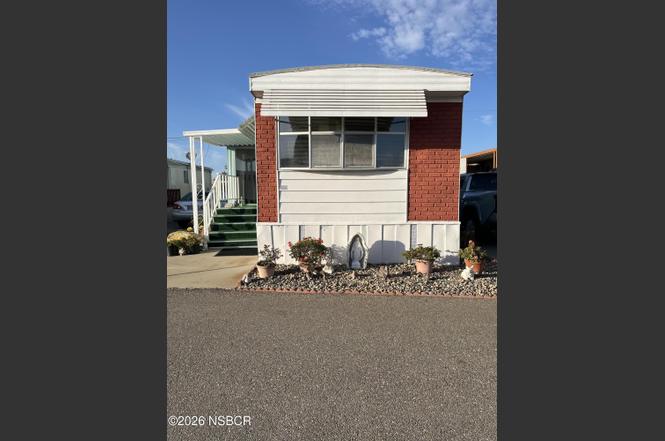
1600 E Clark Ave #78 · Orcutt, CA
Flood risk 1/10 · Minimal
- FEMA flood zone
- X (unshaded)
- Chance of flooding over 30 yrs
- 0.0%
- Est. flood insurance / yr
- $507 – $1,088
Fire risk 5/10 · Moderate
- Est. fire insurance / yr
- $659 – $1,223
Heat risk 2/10 · Minimal
- Hot days now (above 87°F)
- 7 days/yr
- Hot days in 30 yrs
- 16 days/yr
Wind risk 1/10 · Minimal
- Chance of severe wind over 30 yrs
- —
Air-quality risk 6/10 · Moderate
- Unhealthy air days now
- 8 days/yr
- Unhealthy air days in 30 yrs
- 10 days/yr
Risk factors via First Street. Map © Google.
Why this score? — see what drove the B- grade
The composite is a weighted blend of 9 inputs, each scored 0–100. Each bar is that input's sub-score; the figure is the points it added to the 100-point composite (weight × sub-score).
- Cash flow +30.0/30.0
- 1% rule +10.0/10.0
- DSCR +10.0/10.0
- ARV discount +6.1/15.0
- Schools +4.6/10.0
- Livability +3.7/5.0
- Rent growth +3.1/5.0
- Condition / age +2.5/5.0
- Appreciation +0.0/10.0
$69,000
🖨 Deal sheet 📄 Offer letter ✓ Due diligence
Listing remarks
A wonderful demonstration of a home well-loved and maintained in the Town & Country Mobile Park. The interior has a nice kitchen with dining area and built-in hutch. It has an open concept and has a large pantry. Windows on two sides offers morning and afternoon light and a cozy feeling while you are dining. The home has a light-colored (clean) carpet throughout, and the bathroom and kitchen have a linoleum floors. The living room has an expansion with cathedral ceilings and is definitely a nice large living space for larger furniture. The 2nd bedroom is currently used as storage but can be a bedroom, office or craft room. The master bedroom is in the back and has nice built-ins. The
Key facts
- Rock garden
- Cathedral ceilings
- Large pantry
Tags
Property features AI
Finance
- HOA & community: Age-restricted community
Exterior
- Parking: Drive space
- Utilities: Public water; Public sewer
- Home design: Manufactured home; New (year-built listed as new); 60 ft by 12 ft mobile dimensions
- Construction: Aluminum siding; Pillar/post/pier foundation; Flat roof
- Exterior features: Tool shed
Interior
- Kitchen: Gas range/oven; Oven; Refrigerator
- Flooring: Carpet; Linoleum
- Bathrooms: 1 full bathroom
- Heating & cooling: Forced air heating
- Interior features: Pantry
- Laundry & utility: Common area laundry
Neighborhood map
What this means for you Summary
Snapshot
- This is a 2-bed/1.0-bath manufactured listed at $69k.
Deal economics
- At list price, monthly cash flow is $1k ($17k/yr) — positive.
- The deal already cash-flows at list — no discount required.
- Meets the 1% rule at list price ($2k rent vs $69k).
- Recommended offer: $68k (1.5% below list) — sets the bar for market timing.
- Cap rate 31.6% vs local median 2.6% in Orcutt — top-decile yield for the area; either an underpriced asset or a hidden risk that comps aren't pricing in. Stress-test before assuming the spread holds.
Location & tenants
- Location reads 73/100 on livability (#169 in CA) — a middle-class / working-renter tenant base. Strengths: commute A+, employment A+, housing A+; Watch: crime D+, cost of living F.
- Orcutt Union Elementary (suburban): math 44% / reading 54% proficiency, ranked #414 of 1,400 in CA (top 30%) — families likely to look elsewhere, expect single-tenant / working-renter base with shorter leases.
- Market conditions: Rents rising (+2.2%/yr); 124 active listings in the ZIP; 1 comparable units currently listed for rent nearby; high-income renter base; 719 units permitted in Santa Barbara County in 2024 (217 in 5+ unit buildings).
Forward outlook
- Local home prices are declining (-3.0%/yr); year-one equity from $477 of loan paydown is wiped out by about $2k of value loss. Plan a longer hold.
- Santa Barbara County population projected at +20% by 2050 — long-run rental-demand tailwind backs the buy-and-hold thesis.
- At projected returns (-3.0% appreciation + 2.2% rent growth), your $19k cash investment doubles in ~2 years — after that, you're playing with house money.
Negotiation context
- It's been on market 18 days — a 2% lower offer ($68k) is reasonable based on typical stale-listing flexibility.
- 4 sale attempts with the ask held roughly flat each time — persistent listings suggest the price (not the market) is what's stuck; bring a comps-based counter.
Risks & watch-outs
- Climate carrying-cost: moderate wildfire risk — expect insurance premiums to compound above CPI over the hold.
Questions for the listing agent
- Built in 1972 — when were the roof, HVAC, electrical panel, plumbing, and water heater last replaced?
- Is there a deadline driving the sale (1031 exchange, divorce, estate, relocation)? That informs how much negotiation room exists.
- Schools are B-rated — typically a magnet for longer-tenancy family renters. What's the average tenant stay here, and is there a school-zone premium baked into asking?
- Crime grade is D in this area — have there been break-ins, vandalism, or insurance claims at this property in the last 3 years? What carrier currently insures it and at what premium?
- What's the average days-on-market for RENTAL listings here right now (not sales)? A rising rental-DOM trend means longer vacancies and softer asking-rent achievability than the comps imply.
- What's the recent tenant-quality profile in this submarket — average credit score on applications, eviction rate, late-payment / NSF rate, and stable-employment percentage? A property-management company in the area should have these aggregated.
- How much new for-sale + rental construction is in the pipeline within 1–3 miles? Heavy new supply typically softens prices + rents 12–24 months out; constrained supply supports both.
Investment metrics
- 1% rule
- 3.54% ✓
- Cap rate
- 31.55%
- Cash-on-cash
- 90.21%
- DSCR
- 5.01
- GRM
- 2.4
CMA / ARV
- ARV (on-the-fly)
- $66,960
- Comps found
- 6
Show comp detail 6 sales within ~0.75 mi
| Address | Dist | Beds/Ba | Sqft | Sold | Price | $/sf | Match |
|---|---|---|---|---|---|---|---|
| 1600 E Clark Ave #78 | 0.00mi | 2/1.0 | 723 (-3%) | 1mo | $67,000 | $93 | 94 |
| 1600 E Clark Ave #69 | 0.07mi | 1/1.0 (-1) | 720 (-3%) | 9mo | $75,000 | $104 | 79 |
| 1600 E Clark Ave #50 | 0.02mi | 2/1.0 | 700 (-6%) | 15mo | $23,000 | $33 | 77 |
| 1600 E 1600 E Clark Ave #46 | 0.02mi | 2/— | 672 (-10%) | 9mo | $50,500 | $75 | 75 |
| 1600 E Clark Ave #110 | 0.07mi | 2/1.0 | 682 (-8%) | 17mo | $48,000 | $70 | 68 |
| 1600 E Clark #135 | 0.14mi | 2/2.0 | 720 (-3%) | 22mo | $65,000 | $90 | 66 |
Match score weights: distance 35% · size 25% · config 20% · recency 20%. Top-matched comps best support the ARV.
Projected returns pro-forma
-3.0% appreciation · 2.23% rent growth · sell at horizon
- IRR
- 90.0%
- Equity multiple
- 5.11×
- Total profit
- $79,477
- Equity at exit
- $10,288
- IRR
- 92.8%
- Equity multiple
- 10.36×
- Total profit
- $180,879
- Equity at exit
- $5,966
Cash invested: $19,320 (down + closing). Projections, not guarantees.
Landlord ↔ Tenant lean methodology
- Overall (STATE)
- 18 Strongly Tenant-Friendly
- State California
- 18 Strongly Tenant-Friendly · D+13
- County
- — inherits STATE
- City
- — inherits STATE
ZIP-level market 93455
- Rents YoY
- 2.2%
- Active inventory
- 124
- Price-to-rent
- 2.4×
Monthly cashflow live
- Estimated rent
- $2,442 medium interval (Pro) →
- Mortgage (P&I)
- −$362
- Tax est. 1.5%
- −$86 /mo · $1,035/yr
- Insurance
- −$29
- HOA
- −$0
- Vacancy / Maint / Mgmt
- −$513
- Net cashflow
- $1,452
Break-even live
UW: 25.0% down · 7.5% · 30yr · 1.5% tax · 5.0% vac · 8.0% maint · 8.0% mgmt
Financing live
Cash to close
- Down payment
- $17,250
- Closing costs
- $2,070
- Reserves months
- —
- Total cash needed
- —
Loan-product check · same deal, 3 products live
Conventional
25% down · 7.5% · 30yr
- Down + closing
- —
- Monthly P&I
- —
- Monthly cashflow
- —
- DSCR
- —
- Eligible?
- —
Personal DTI + credit; lowest rate.
DSCR
20% down · 8.5% · 30yr
- Down + closing
- —
- Monthly P&I
- —
- Monthly cashflow
- —
- DSCR
- —
- Eligible?
- —
No personal income docs; deal must DSCR.
Hard money
10% down · 12.0% · 12mo
- Down + closing
- —
- Monthly P&I
- —
- Monthly cashflow
- —
- DSCR
- —
- Eligible?
- —
Short-term bridge; refi at stabilization.
Rent comps 1 comps
| Address | Beds | Baths | Sqft | Rent | $/sqft | DOM | Units | Dist |
|---|---|---|---|---|---|---|---|---|
| 1189 Oak Knoll Rd Unit 2 Orcutt, CA | 1.0 | 1.0 | 430 | $2,199 | $5.11 | 14d | 1 | 1.09mi |
Listing history 9 events
-
2026-05-04status Pending
-
2026-05-04status Active
-
2026-04-25status Active
-
2026-03-21status Active
-
2026-02-19historical Active Under Contract
-
2026-02-19status Pending
-
2026-02-19historical
-
2026-02-19historical
-
2026-01-31$69,000 Active
ⓘ Source: listings_history table (triggers on properties + properties_extension) + one-shot
backfill from property_details.listing_events for pre-trigger history.
Climate risk First Street
- Flood 1/10 Low FEMA zone X (unshaded) · 0% chance over 30 yrs
- Wildfire 5/10 Major
- Heat 2/10 Low 7 d/yr ≥87°F today · 16 d/yr by 30 yrs out
- Wind 1/10 Low
- Air quality 6/10 Major 8 unhealthy d/yr today · 10 by 30 yrs out
Nearby sold comps map
Loading sold comps map…
Walkable amenities ~0.75 mi
Loading nearby amenities…
Taxation est. · year 1
- Rental income
- $29,304
- − Mortgage interest
- −$3,865
- − Property taxes
- −$1,035
- − Insurance
- −$345
- − Repairs & maintenance
- −$2,344
- − Management
- −$2,344
- − Depreciation
- −$2,007
- Taxable income
- $17,363
- Est. tax owed @ 24.0%
- −$4,167
- After-tax cash flow
- $13,261/yr
For passive investors: Depreciation is non-cash, so a rental often shows a tax loss while cash-flowing — sheltering income. Rental losses are passive: they offset passive income freely, and up to $25,000/yr can offset ordinary (W-2) income if you actively participate and your MAGI is under $100k (phasing out to $0 by $150k); unused losses carry forward. On sale, claimed depreciation is recaptured at up to 25%, and gains may owe capital-gains tax (a 1031 exchange can defer both). Figures are a year-1 estimate at your 24.0% rate — not tax advice; consult a CPA.
Schools (NCES district)
- District
- Orcutt Union Elementary
- NCES district ID
- 0628710
- Math proficiency
- 44% ▼ -1.00%
- Reading proficiency
- 54% ▲ 2.00%
- Median HH income
- $70,564
- Composite
- 45.96/100
- National rank
- #5530
- State rank
- #414 of 1400 in CA
Livability — Orcutt
- Score
- 73/100
- State rank
- #169
- US rank
- #5508
Category grades
Schools grade is shown separately in the Schools card above.
Census & demographics
- Census place
- Orcutt, CA
- County
- Santa Barbara County · 410,380 people
- Metro
- Santa Maria-Santa Barbara, CA
- Population (ZIP)
- 44,611
- Household income
- $110,661
- Rent vs Own
- Severe rent burden
- 765.0
Population outlook (Santa Barbara County) Hauer SSP2
- Today (2025)
- 484,679 people
- By 2030
- 505,323 · +4.3%
- By 2040
- 545,783 · +12.6%
- By 2050
- 584,263 · +20.5%
- By 2075
- 682,586 · +40.8%
- By 2100
- 723,188 · +49.2%
Race, ethnicity, and origin ACS 2023
- Neighborhood character
- Diverse neighborhood (Simpson 0.61)
- Race & ethnicity
- White 47% Hispanic / Latino 41% Two or more races 24% Asian 5% Black 2%
- Hispanic origin (detail)
- Mexican 38%
- Common ancestry
- Lithuanian 2% Russian 2% Italian 2%
- Foreign-born
- 13% · Canada, China, South Korea
- Languages at home
- 73% English-only · Spanish 23% Tagalog/Filipino 2%
Political lean MEDSL · Santa Barbara
- 2024 margin
- Strong D (+26.7) · D 61.8% · R 35.1% · Other 3.1%
- 2008→2024 swing
- +3.8pp toward D · 2008: 22.9pp · 2024: 26.7pp
- All cycles
- 2024: D+26.7 2020: D+32.1 2016: D+28.2 2012: D+17.1 2008: D+22.9
Not yet ingested
- Civics
- —
Market trends
- HPI YoY
- ▼ -729.78%
- Current HPI
- 314.6499
- Rent YoY
- ▲ 2.23%
- Metro
- Santa Maria-Santa Barbara, CA
- State GDP YoY
- ▲ 3.21%
- F500 in state
- 116
Industry mix (Fortune 500 HQ in CA)
| Industry | F500 HQs | Revenue |
|---|---|---|
| Technology | 27 | $1,492B |
|
||
| Financial Services | 3 | $174B |
|
||
| Retail | 3 | $44B |
|
||
| Insurance | 3 | $26B |
|
||
| Media / Entertainment | 2 | $115B |
|
||
| Pharmaceuticals / Biotech | 2 | $62B |
|
||
Price history
9 events — show timeline
- 2026-05-04 Pending — NSBCRMLS
- 2026-05-04 Relisted — NSBCRMLS
- 2026-04-25 Relisted — NSBCRMLS
- 2026-03-21 Relisted — NSBCRMLS
- 2026-02-19 Contingent — NSBCRMLS
- 2026-02-19 Pending — NSBCRMLS
- 2026-02-19 Listing Removed — NSBCRMLS
- 2026-02-19 Listing Removed — NSBCRMLS
- 2026-01-31 Listed $69,000 NSBCRMLS
Cash-flow waterfall
monthlySold comps — $/sqft
last 12 mo · ≤1 miLoading sold comps…