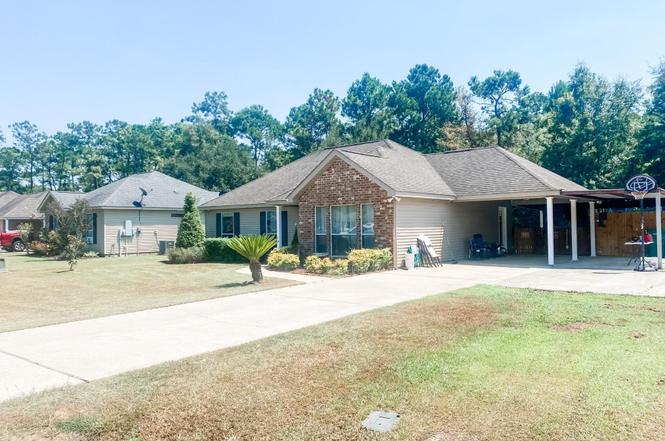
20116 Pecan Trace Dr · Ponchatoula, LA
Flood risk 1/10 · Minimal
- FEMA flood zone
- X (unshaded)
- Chance of flooding over 30 yrs
- 0.0%
- Est. flood insurance / yr
- $507 – $1,088
Fire risk 5/10 · Moderate
- Est. fire insurance / yr
- $1,269 – $2,357
Heat risk 9/10 · Severe
- Hot days now (above 109°F)
- 7 days/yr
- Hot days in 30 yrs
- 22 days/yr
Wind risk 9/10 · Severe
- Chance of severe wind over 30 yrs
- 99.0%
Air-quality risk 2/10 · Minimal
- Unhealthy air days now
- 0 days/yr
- Unhealthy air days in 30 yrs
- 1 days/yr
Risk factors via First Street. Map © Google.
Why this score? — see what drove the B+ grade
The composite is a weighted blend of 9 inputs, each scored 0–100. Each bar is that input's sub-score; the figure is the points it added to the 100-point composite (weight × sub-score).
- Cash flow +30.0/30.0
- ARV discount +15.0/15.0
- DSCR +10.0/10.0
- 1% rule +9.6/10.0
- Livability +3.4/5.0
- Rent growth +2.7/5.0
- Condition / age +2.5/5.0
- Schools +2.0/10.0
- Appreciation +0.0/10.0
$130,000
🖨 Deal sheet 📄 Offer letter ✓ Due diligence
Listing remarks
3 bedroom/2 bath home in Pecan Trace in need of repair. Owner carefully gutted property after a flood from the laundry area. this home is clean and ready to be put back together. Possible short sale
Key facts
- 3 parking spots
- Built 2017
Neighborhood map
What this means for you Summary
Snapshot
- This is a 3-bed/2.0-bath single-family listed at $130k.
Deal economics
- At list price, monthly cash flow is $659 ($8k/yr) — positive.
- The deal already cash-flows at list — no discount required.
- Meets the 1% rule at list price ($2k rent vs $130k).
- Cap rate 12.4% vs local median 5.1% in Ponchatoula — top-decile yield for the area; either an underpriced asset or a hidden risk that comps aren't pricing in. Stress-test before assuming the spread holds.
Location & tenants
- Location reads 68/100 on livability (#91 in LA) — a middle-class / working-renter tenant base. Strengths: cost of living A+, health & safety A+, housing A-; Watch: employment D, crime D-, amenities F.
- Tangipahoa Parish (rural): math 18% / reading 29% proficiency, ranked #63 of 98 in LA (top 64%) — low school quality limits family demand, transient renter base, plan for 1-2y turnover; 73% free/reduced lunch — lower-income household profile, screen leases tightly.
- Market conditions: Rents flat; 526 active listings in the ZIP; 2 comparable units currently listed for rent nearby; 1,085 units permitted in Tangipahoa Parish in 2024 (378 in 5+ unit buildings).
- This rent runs 32% of the median local income ($72k/yr) — at the standard rent-burdened threshold; future hikes will face affordability resistance.
Forward outlook
- Local home prices are declining (-3.0%/yr); year-one equity from $899 of loan paydown is wiped out by about $4k of value loss. Plan a longer hold.
- Tangipahoa County population projected at +22% by 2050 — long-run rental-demand tailwind backs the buy-and-hold thesis.
- At projected returns (-3.0% appreciation + 0.7% rent growth), your $36k cash investment doubles in ~7 years — after that, you're playing with house money.
Negotiation context
- Only 1 days on market — expect competitive offers; lowballing is unlikely to land.
- 13 sale attempts since 18y ago with the ask held roughly flat each time — persistent listings suggest the price (not the market) is what's stuck; bring a comps-based counter.
Risks & watch-outs
- Climate carrying-cost: severe wind risk, 99% chance of damaging wind over 30y; moderate wildfire risk; extreme-heat days projected 7→22/yr by 2055 (HVAC capex compounding) — expect insurance premiums to compound above CPI over the hold.
Questions for the listing agent
- Is there a deadline driving the sale (1031 exchange, divorce, estate, relocation)? That informs how much negotiation room exists.
- Schools are B-rated — typically a magnet for longer-tenancy family renters. What's the average tenant stay here, and is there a school-zone premium baked into asking?
- Crime grade is D in this area — have there been break-ins, vandalism, or insurance claims at this property in the last 3 years? What carrier currently insures it and at what premium?
- What's the average days-on-market for RENTAL listings here right now (not sales)? A rising rental-DOM trend means longer vacancies and softer asking-rent achievability than the comps imply.
- What's the recent tenant-quality profile in this submarket — average credit score on applications, eviction rate, late-payment / NSF rate, and stable-employment percentage? A property-management company in the area should have these aggregated.
- How much new for-sale + rental construction is in the pipeline within 1–3 miles? Heavy new supply typically softens prices + rents 12–24 months out; constrained supply supports both.
Investment metrics
- 1% rule
- 1.46% ✓
- Cap rate
- 12.37%
- Cash-on-cash
- 21.71%
- DSCR
- 1.97
- GRM
- 5.7
CMA / ARV
- ARV (on-the-fly)
- $212,090
- Comps found
- 11
Show comp detail 11 sales within ~0.75 mi
| Address | Dist | Beds/Ba | Sqft | Sold | Price | $/sf | Match |
|---|---|---|---|---|---|---|---|
| 20095 Pecan Trce | 0.05mi | 3/2.0 | 1,280 (+1%) | 0mo | $218,000 | $170 | 96 |
| 40222 Pecan Allee St | 0.06mi | 3/2.0 | 1,260 (-1%) | 5mo | $199,000 | $158 | 91 |
| 40190 Pecan Allee Dr | 0.09mi | 3/2.0 | 1,250 (-2%) | 2mo | $216,000 | $173 | 91 |
| 40183 Pecan Allee Dr | 0.15mi | 3/2.0 | 1,259 (-1%) | 2mo | $210,750 | $167 | 90 |
| 40214 Pecan Allee Dr | 0.07mi | 3/2.0 | 1,265 (-0%) | 23mo | $200,000 | $158 | 77 |
| 20014 Pecan Trace Dr | 0.18mi | 3/2.0 | 1,237 (-3%) | 14mo | $212,000 | $171 | 76 |
| 20006 Pecan Trace Dr | 0.19mi | 3/2.0 | 1,299 (+2%) | 18mo | $216,000 | $166 | 72 |
| 40205 Olde Mill Ln | 0.28mi | 3/2.0 | 1,458 (+15%) | 7mo | $250,000 | $171 | 56 |
| 40178 Saucier Rd | 0.74mi | 3/2.0 | 1,295 (+2%) | 16mo | $58,000 | $45 | 49 |
| 40311 Saucier Rd | 0.75mi | 3/2.0 | 1,232 (-3%) | 15mo | $175,266 | $142 | 48 |
| 39454 Ridgedell Rd | 0.67mi | 2/2.0 (-1) | 1,097 (-14%) | 20mo | $185,000 | $169 | 24 |
Match score weights: distance 35% · size 25% · config 20% · recency 20%. Top-matched comps best support the ARV.
Projected returns pro-forma
-3.0% appreciation · 0.66% rent growth · sell at horizon
- IRR
- 11.8%
- Equity multiple
- 1.45×
- Total profit
- $16,508
- Equity at exit
- $19,383
- IRR
- 18.9%
- Equity multiple
- 2.41×
- Total profit
- $51,273
- Equity at exit
- $11,240
Cash invested: $36,400 (down + closing). Projections, not guarantees.
Landlord ↔ Tenant lean methodology
- Overall (STATE)
- 90 Strongly Landlord-Friendly
- State Louisiana
- 90 Strongly Landlord-Friendly · R+12
- County
- — inherits STATE
- City
- — inherits STATE
ZIP-level market 70454
- Rents YoY
- 0.7%
- Active inventory
- 526
- Price-to-rent
- 5.7×
Monthly cashflow live
- Estimated rent
- $1,896 medium interval (Pro) →
- Mortgage (P&I)
- −$682
- Tax from tax record
- −$103 /mo · $1,242/yr
- Insurance
- −$54
- HOA
- −$0
- Vacancy / Maint / Mgmt
- −$398
- Net cashflow
- $659
Break-even live
UW: 25.0% down · 7.5% · 30yr · 1.5% tax · 5.0% vac · 8.0% maint · 8.0% mgmt
Financing live
Cash to close
- Down payment
- $32,500
- Closing costs
- $3,900
- Reserves months
- —
- Total cash needed
- —
Loan-product check · same deal, 3 products live
Conventional
25% down · 7.5% · 30yr
- Down + closing
- —
- Monthly P&I
- —
- Monthly cashflow
- —
- DSCR
- —
- Eligible?
- —
Personal DTI + credit; lowest rate.
DSCR
20% down · 8.5% · 30yr
- Down + closing
- —
- Monthly P&I
- —
- Monthly cashflow
- —
- DSCR
- —
- Eligible?
- —
No personal income docs; deal must DSCR.
Hard money
10% down · 12.0% · 12mo
- Down + closing
- —
- Monthly P&I
- —
- Monthly cashflow
- —
- DSCR
- —
- Eligible?
- —
Short-term bridge; refi at stabilization.
Rent comps 2 comps
| Address | Beds | Baths | Sqft | Rent | $/sqft | DOM | Units | Dist |
|---|---|---|---|---|---|---|---|---|
| 39676 Gayle Rd Ponchatoula, LA | 3.0 | 2.0 | 1800 | $1,700 | $0.94 | 44d | 1 | 0.84mi |
| 21176 Brighton Cove Dr Ponchatoula, LA | 3.0 | 2.0 | 1705 | $2,000 | $1.17 | 44d | 1 | 1.27mi |
Listing history 24 events
-
2025-03-07status Pending
-
2025-03-07$130,000 Active
-
2025-03-07$130,000
-
2024-09-17$150,000
-
2023-09-25soldstatus Sold
-
2023-09-25soldstatus $206,000
-
2023-08-24historical
-
2023-08-21$200,000 Active
-
2023-08-21$200,000
-
2016-05-04soldstatus Sold
-
2016-05-04soldstatus $135,000 Sold
-
2016-05-04soldstatus $135,000
-
2016-04-12status Pending
-
2016-03-22historical Pending Continue to Show
-
2016-02-24$136,900 Active
-
2016-02-22$136,900 Active
-
2016-02-22$136,900
-
2016-02-22$136,900
-
2009-03-20soldstatus $135,900
-
2009-01-13$135,900
-
2009-01-13$135,900
-
2008-06-30soldstatus $27,000
-
2008-01-06$29,900
-
2008-01-06$29,900
ⓘ Source: listings_history table (triggers on properties + properties_extension) + one-shot
backfill from property_details.listing_events for pre-trigger history.
Tax reassessment forecast LA · Resets to sale price
- Current annual tax
- $1,242 · $103/mo
- Projected year-2 tax
- $1,242 · $103/mo
- Expected delta
- $0/yr ($0/mo · 0.0%)
ⓘ Screening estimate from a state-policy table — verify with the county assessor before closing.
Climate risk First Street
- Flood 1/10 Low FEMA zone X (unshaded) · 0% chance over 30 yrs
- Wildfire 5/10 Major
- Heat 9/10 Extreme 7 d/yr ≥109°F today · 22 d/yr by 30 yrs out
- Wind 9/10 Extreme 99% chance of damaging wind over 30 yrs
- Air quality 2/10 Low 0 unhealthy d/yr today · 1 by 30 yrs out
Nearby sold comps map
Loading sold comps map…
Walkable amenities ~0.75 mi
Loading nearby amenities…
Taxation est. · year 1
- Rental income
- $22,753
- − Mortgage interest
- −$7,282
- − Property taxes
- −$1,242
- − Insurance
- −$650
- − Repairs & maintenance
- −$1,820
- − Management
- −$1,820
- − Depreciation
- −$3,782
- Taxable income
- $6,157
- Est. tax owed @ 24.0%
- −$1,478
- After-tax cash flow
- $6,425/yr
For passive investors: Depreciation is non-cash, so a rental often shows a tax loss while cash-flowing — sheltering income. Rental losses are passive: they offset passive income freely, and up to $25,000/yr can offset ordinary (W-2) income if you actively participate and your MAGI is under $100k (phasing out to $0 by $150k); unused losses carry forward. On sale, claimed depreciation is recaptured at up to 25%, and gains may owe capital-gains tax (a 1031 exchange can defer both). Figures are a year-1 estimate at your 24.0% rate — not tax advice; consult a CPA.
Schools (NCES district)
- District
- Tangipahoa Parish
- NCES district ID
- 2201680
- Math proficiency
- 18% ▼ -32.00%
- Reading proficiency
- 29% ▼ -31.00%
- Median HH income
- $41,283
- Composite
- 19.94/100
- National rank
- #8676
- State rank
- #63 of 98 in LA
Livability — Ponchatoula
- Score
- 68/100
- State rank
- #91
- US rank
- #9755
Category grades
Schools grade is shown separately in the Schools card above.
Census & demographics
- County
- Tangipahoa Parish · 85,958 people
- City population
- 34,564
- Metro
- Hammond, LA
- Population (ZIP)
- 34,564
- Household income
- $71,611
- Rent vs Own
- Severe rent burden
- 479.0
Population outlook (Tangipahoa County) Hauer SSP2
- Today (2025)
- 144,204 people
- By 2030
- 151,413 · +5.0%
- By 2040
- 164,374 · +14.0%
- By 2050
- 175,427 · +21.7%
- By 2075
- 195,165 · +35.3%
- By 2100
- 201,641 · +39.8%
Race, ethnicity, and origin ACS 2023
- Neighborhood character
- Predominantly White (73%)
- Race & ethnicity
- White 73% Black 16% Two or more races 8% Hispanic / Latino 8%
- Hispanic origin (detail)
- Mexican 2%
- Common ancestry
- Lithuanian 15% Slovak 1% Portuguese 1%
- Foreign-born
- 3% · Canada
- Languages at home
- 94% English-only · Spanish 5%
Political lean MEDSL · Tangipahoa
- 2024 margin
- Solid R (+37.4) · D 30.6% · R 68.0% · Other 1.3%
- 2008→2024 swing
- -6.5pp toward R · 2008: -30.9pp · 2024: -37.4pp
- All cycles
- 2024: R+37.4 2020: R+32.8 2016: R+32.6 2012: R+27.7 2008: R+30.9
Not yet ingested
- Civics
- —
Market trends
- HPI YoY
- ▼ -83.55%
- Current HPI
- 129.6069
- Rent YoY
- ▲ 0.66%
- Metro
- Hammond, LA
- State GDP YoY
- ▲ 3.29%
- F500 in state
- 10
Industry mix (Fortune 500 HQ in LA)
| Industry | F500 HQs | Revenue |
|---|---|---|
| Telecommunications | 2 | $23B |
|
||
| Utilities | 1 | $12B |
|
||
| Wholesale / Distribution | 1 | $5B |
|
||
| Advertising | 1 | $2B |
|
||
Price history
+334.8% since first listed24 events — show timeline
- 2025-03-07 Pending — GSREIN
- 2025-03-07 Listed $130,000 AcadianaMLS
- 2025-03-07 Listed $130,000 GSREIN
- 2024-09-17 Listed $150,000 AcadianaMLS
- 2023-09-25 Sold (Public Records) $206,000 Public Records
- 2023-09-25 Sold (MLS) — GBRMLS
- 2023-08-24 Delisted — GBRMLS
- 2023-08-21 Listed $200,000 AcadianaMLS
- 2023-08-21 Listed $200,000 GBRMLS
- 2016-05-04 Sold (Public Records) $135,000 Public Records
- 2016-05-04 Sold (MLS) $135,000 GSREIN
- 2016-05-04 Sold (MLS) — GBRMLS
- 2016-04-12 Pending — GBRMLS
- 2016-03-22 Contingent — GSREIN
- 2016-02-24 Listed $136,900 GBRMLS
- 2016-02-22 Listed $136,900 GSREIN
- 2016-02-22 Listed $136,900 AcadianaMLS
- 2016-02-22 Listed $136,900 AcadianaMLS
- 2009-03-20 Sold (MLS) $135,900 GSREIN
- 2009-01-13 Listed $135,900 AcadianaMLS
- 2009-01-13 Listed $135,900 GSREIN
- 2008-06-30 Sold (MLS) $27,000 GSREIN
- 2008-01-06 Listed $29,900 GSREIN
- 2008-01-06 Listed $29,900 AcadianaMLS
Property tax history
+0.5%/yrLatest (2025): $1,242 · +1.0% YoY. Source: county tax records.
Cash-flow waterfall
monthlySold comps — $/sqft
last 12 mo · ≤1 miLoading sold comps…