101 Starks Cir · Simpsonville, SC
Flood risk 1/10 · Minimal
- FEMA flood zone
- X (unshaded)
- Chance of flooding over 30 yrs
- 0.0%
- Est. flood insurance / yr
- $507 – $1,088
Fire risk 5/10 · Moderate
- Est. fire insurance / yr
- $783 – $1,453
Heat risk 6/10 · Moderate
- Hot days now (above 104°F)
- 7 days/yr
- Hot days in 30 yrs
- 17 days/yr
Wind risk 2/10 · Minimal
- Chance of severe wind over 30 yrs
- 2.0%
Air-quality risk 4/10 · Minor
- Unhealthy air days now
- 3 days/yr
- Unhealthy air days in 30 yrs
- 4 days/yr
Risk factors via First Street. Map © Google.
Why this score? — see what drove the D grade
The composite is a weighted blend of 9 inputs, each scored 0–100. Each bar is that input's sub-score; the figure is the points it added to the 100-point composite (weight × sub-score).
- ARV discount +12.1/15.0
- Cash flow +9.8/30.0
- Livability +4.4/5.0
- Schools +4.2/10.0
- Condition / age +4.0/5.0
- 1% rule +3.4/10.0
- Rent growth +3.2/5.0
- DSCR +2.8/10.0
- Appreciation +0.0/10.0
$250,990
🖨 Deal sheet 📄 Offer letter ✓ Due diligence
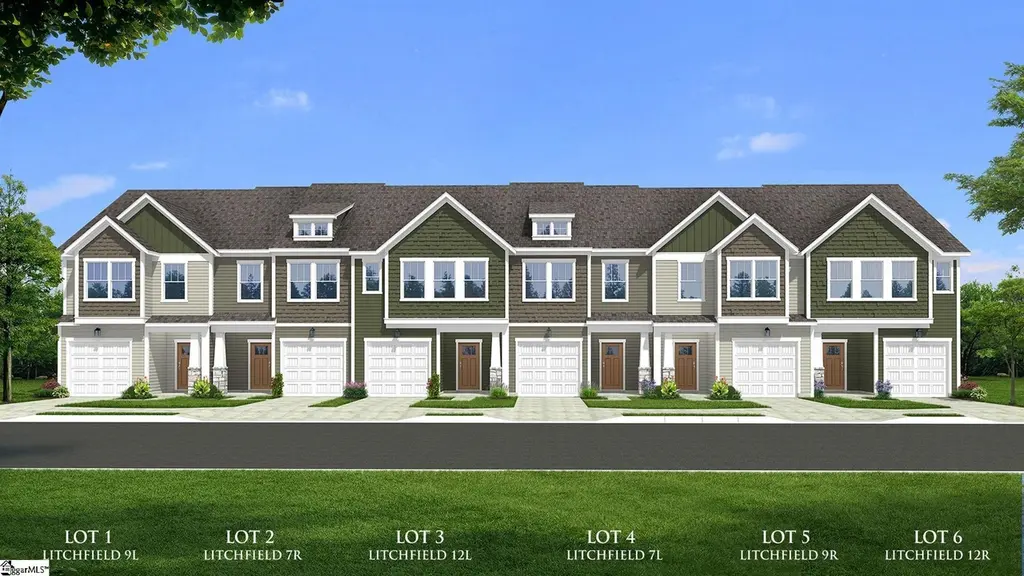
Listing remarks
Welcome to Anna’s Pointe! New townhomes in Simpsonville just off West Georgia Rd. with easy access to Interstates 385 and 85. Step inside this beautifully designed home featuring an open-concept layout perfect for everyday living and entertaining. The heart of the home is the stunning kitchen with a 9-foot center island, seamlessly flowing into the bright family room and cozy breakfast area—ideal for gatherings or quiet mornings. Other features of the kitchen include white cabinetry, Quartz countertops, tiled backsplash and a full stainless steel appliance package including a gas range/oven and refrigerator. Upstairs you’ll find three generously sized bedrooms, two full b
Key facts
- $100 HOA
- Garage
- Built 2026
Neighborhood map
What this means for you Summary
Snapshot
- This is a 3-bed/2.5-bath townhouse listed at $251k. Condition is rated good.
Deal economics
- At list price, monthly cash flow is $-162 ($-2k/yr) — negative.
- To cash-flow at today's rent, offer at most $227k (9.4% below list).
- To meet the 1% rule (rent ≥ 1% of price), the offer needs to be $212k (15.7% below list).
- Recommended offer: $212k (15.7% below list) — sets the bar for 1% rule.
- Cap rate 5.5% vs local median 3.9% in Simpsonville — top-decile yield for the area; either an underpriced asset or a hidden risk that comps aren't pricing in. Stress-test before assuming the spread holds.
Location & tenants
- Location reads 87/100 on livability (#1 in SC, #295 nationally) — a professional / high-income tenant draw. Strengths: commute A+, housing A+, health & safety A+.
- Greenville 01 (suburban): math 44% / reading 54% proficiency, ranked #10 of 80 in SC (top 12%) — families likely to look elsewhere, expect single-tenant / working-renter base with shorter leases.
- Zoned schools: Ellen Woodside Elementary (math 46% / reading 44%, grade D-, #224 of 597 statewide, top 38%, 1,020 students, 78% FRL) — zoned schools average 78% FRL vs 42% district-wide (35 pts higher); higher-poverty schools than district average — tighter screening recommended.
- Market conditions: Rents rising (+2.9%/yr); 245 active listings in the ZIP; 9 comparable units currently listed for rent nearby; rentals leasing fast (median 12d on market — plan ~1-2 weeks tenant-placement turnaround); solid renter incomes; 5,595 units permitted in Greenville County in 2024 (566 in 5+ unit buildings).
Forward outlook
- Local home prices are declining (-3.0%/yr); year-one equity from $2k of loan paydown is wiped out by about $8k of value loss. Plan a longer hold.
- Greenville County population projected at +34% by 2050 — long-run rental-demand tailwind backs the buy-and-hold thesis.
Negotiation context
- Only 0 days on market — expect competitive offers; lowballing is unlikely to land.
Risks & watch-outs
- Climate carrying-cost: moderate wildfire risk; extreme-heat days projected 7→17/yr by 2055 (HVAC capex compounding) — expect insurance premiums to compound above CPI over the hold.
Questions for the listing agent
- What do current leases actually rent for vs. the listed asking? Can we see a recent rent roll and the last 12 months of T-12 income?
- What does the HOA fee cover, when was the last increase, and are there any pending special assessments or reserve-fund shortfalls?
- Is there a deadline driving the sale (1031 exchange, divorce, estate, relocation)? That informs how much negotiation room exists.
- Schools are B-rated — typically a magnet for longer-tenancy family renters. What's the average tenant stay here, and is there a school-zone premium baked into asking?
- The area grade is low — what's the realistic commute time and amenity access for the typical tenant pool here? Any planned neighborhood developments (good or bad) we should know about?
- What's the average days-on-market for RENTAL listings here right now (not sales)? A rising rental-DOM trend means longer vacancies and softer asking-rent achievability than the comps imply.
- What's the recent tenant-quality profile in this submarket — average credit score on applications, eviction rate, late-payment / NSF rate, and stable-employment percentage? A property-management company in the area should have these aggregated.
- How much new for-sale + rental construction is in the pipeline within 1–3 miles? Heavy new supply typically softens prices + rents 12–24 months out; constrained supply supports both.
Investment metrics
- 1% rule
- 0.84% ✗
- Cap rate
- 5.52%
- Cash-on-cash
- -2.77%
- DSCR
- 0.88
- GRM
- 9.9
CMA / ARV
- ARV (on-the-fly)
- $279,312
- Comps found
- 2
Show comp detail 2 sales within ~0.75 mi
| Address | Dist | Beds/Ba | Sqft | Sold | Price | $/sf | Match |
|---|---|---|---|---|---|---|---|
| 7 Starks Cir | 0.02mi | 3/2.5 | 1,587 (0%) | 0mo | $273,990 | $173 | 99 |
| 9 Starks Cir | 0.01mi | 3/2.5 | 1,616 (+2%) | 0mo | $284,990 | $176 | 96 |
Match score weights: distance 35% · size 25% · config 20% · recency 20%. Top-matched comps best support the ARV.
Projected returns pro-forma
-3.0% appreciation · 2.85% rent growth · sell at horizon
- IRR
- -21.0%
- Equity multiple
- 0.27×
- Total profit
- $-51,245
- Equity at exit
- $37,423
- IRR
- -14.7%
- Equity multiple
- 0.16×
- Total profit
- $-58,875
- Equity at exit
- $21,701
Cash invested: $70,277 (down + closing). Projections, not guarantees.
Landlord ↔ Tenant lean methodology
- Overall (STATE)
- 90 Strongly Landlord-Friendly
- State South Carolina
- 90 Strongly Landlord-Friendly · R+6
- County
- — inherits STATE
- City
- — inherits STATE
ZIP-level market 29680
- Home prices YoY
- -31.2%
- Rents YoY
- 2.9%
- Active inventory
- 245
- Price-to-rent
- 9.9×
Monthly cashflow live
- Estimated rent
- $2,117 high interval (Pro) →
- Mortgage (P&I)
- −$1,316
- Tax est. 1.5%
- −$314 /mo · $3,765/yr
- Insurance
- −$105
- HOA
- −$100
- Vacancy / Maint / Mgmt
- −$444
- Net cashflow
- $-162
Break-even live
UW: 25.0% down · 7.5% · 30yr · 1.5% tax · 5.0% vac · 8.0% maint · 8.0% mgmt
Financing live
Cash to close
- Down payment
- $62,748
- Closing costs
- $7,530
- Reserves months
- —
- Total cash needed
- —
Loan-product check · same deal, 3 products live
Conventional
25% down · 7.5% · 30yr
- Down + closing
- —
- Monthly P&I
- —
- Monthly cashflow
- —
- DSCR
- —
- Eligible?
- —
Personal DTI + credit; lowest rate.
DSCR
20% down · 8.5% · 30yr
- Down + closing
- —
- Monthly P&I
- —
- Monthly cashflow
- —
- DSCR
- —
- Eligible?
- —
No personal income docs; deal must DSCR.
Hard money
10% down · 12.0% · 12mo
- Down + closing
- —
- Monthly P&I
- —
- Monthly cashflow
- —
- DSCR
- —
- Eligible?
- —
Short-term bridge; refi at stabilization.
Rent comps 9 comps
| Address | Beds | Baths | Sqft | Rent | $/sqft | DOM | Units | Dist |
|---|---|---|---|---|---|---|---|---|
| 123 Carruth St Simpsonville, SC | 3.0 | 2.5 | 2056 | $2,245 | $1.09 | 3d | 1 | 0.33mi |
| 41 Beachley Pl Simpsonville, SC | 3.0 | 2.5 | 1400 | $1,650 | $1.18 | 3d | 1 | 0.56mi |
| 44 Beachley Pl Simpsonville, SC | 3.0 | 2.5 | 1400 | $1,695 | $1.21 | 12d | 1 | 0.57mi |
| 113 Riverport Dr Simpsonville, SC | 4.0 | 2.5 | 2200 | $2,200 | $1.00 | 24d | 1 | 0.68mi |
| 135 Bayridge Rd , SC | 3.0 | 2.0 | 1700 | $1,950 | $1.15 | 3d | 1 | 0.73mi |
| 218 Marefair Ln Simpsonville, SC | 4.0 | 3.0 | 2157 | $2,300 | $1.07 | 19d | 1 | 0.96mi |
| 519 Crowder Pl Piedmont, SC | 4.0 | 3.0 | 2100 | $2,100 | $1.00 | 3d | 1 | 1.00mi |
| 101 Brentmoor Pl Simpsonville, SC | 4.0 | 2.0 | 2053 | $2,250 | $1.10 | 24d | 1 | 1.15mi |
| 517 Spokane Dr Simpsonville, SC | 3.0 | 2.0 | 1601 | $2,399 | $1.50 | 12d | 1 | 1.49mi |
HOA detail
- Monthly dues
- $100 · $1,200/yr
- Likely covers
- gas
Listing history 2 events
-
2026-04-13$250,990
-
2026-04-13historical
ⓘ Source: listings_history table (triggers on properties + properties_extension) + one-shot
backfill from property_details.listing_events for pre-trigger history.
Climate risk First Street
- Flood 1/10 Low FEMA zone X (unshaded) · 0% chance over 30 yrs
- Wildfire 5/10 Major
- Heat 6/10 Major 7 d/yr ≥104°F today · 17 d/yr by 30 yrs out
- Wind 2/10 Low 2% chance of damaging wind over 30 yrs
- Air quality 4/10 Moderate 3 unhealthy d/yr today · 4 by 30 yrs out
Nearby sold comps map
Loading sold comps map…
Walkable amenities ~0.75 mi
Loading nearby amenities…
Taxation est. · year 1
- Rental income
- $25,398
- − Mortgage interest
- −$14,059
- − Property taxes
- −$3,765
- − Insurance
- −$1,255
- − Repairs & maintenance
- −$2,032
- − Management
- −$2,032
- − HOA
- −$1,200
- − Depreciation
- −$7,302
- Taxable loss
- −$6,246
- Est. tax savings @ 24.0%
- +$1,499
- After-tax cash flow
- $-451/yr
For passive investors: Depreciation is non-cash, so a rental often shows a tax loss while cash-flowing — sheltering income. Rental losses are passive: they offset passive income freely, and up to $25,000/yr can offset ordinary (W-2) income if you actively participate and your MAGI is under $100k (phasing out to $0 by $150k); unused losses carry forward. On sale, claimed depreciation is recaptured at up to 25%, and gains may owe capital-gains tax (a 1031 exchange can defer both). Figures are a year-1 estimate at your 24.0% rate — not tax advice; consult a CPA.
Condition & rehab AI · 3 photos
This new townhome in Anna’s Pointe offers a good condition with an open-concept layout and modern finishes. Minor updates and maintenance would further enhance its value for both resale and rental.
Value-add opportunities
- Both Painting and minor touch-ups throughout — Enhances curb appeal and interior aesthetics.
- Both New flooring in bathrooms — Improves functionality and appearance.
- Both Landscaping and curb appeal improvements — Enhances overall aesthetic and attracts potential buyers/tenants.
Renovation cost estimate screening
Value-add ROI direction
- Both Painting and minor touch-ups throughout — Enhances curb appeal and interior aesthetics. ↑
- Both New flooring in bathrooms — Improves functionality and appearance. ↑
- Both Landscaping and curb appeal improvements — Enhances overall aesthetic and attracts potential buyers/tenants. ↑
ⓘ Cost ranges are severity-bucket heuristics (US national rule-of-thumb). Get contractor quotes + a written scope before underwriting a rehab budget.
Schools (NCES district)
- District
- Greenville 01
- NCES district ID
- 4502310
- Math proficiency
- 44% ▼ -10.00%
- Reading proficiency
- 54% ▼ -2.00%
- Median HH income
- $49,596
- Composite
- 41.88/100
- National rank
- #3370
- State rank
- #10 of 80 in SC
Livability — Simpsonville
- Score
- 87/100
- State rank
- #1
- US rank
- #295
Category grades
Schools grade is shown separately in the Schools card above.
Census & demographics
- County
- Greenville County · 573,815 people
- City population
- 104,420
- Metro
- Greenville-Anderson, SC
- Population (ZIP)
- 35,770
- Household income
- $86,716
- Rent vs Own
- Severe rent burden
- 553.0
Population outlook (Greenville County) Hauer SSP2
- Today (2025)
- 574,580 people
- By 2030
- 615,615 · +7.1%
- By 2040
- 695,373 · +21.0%
- By 2050
- 769,367 · +33.9%
- By 2075
- 933,296 · +62.4%
- By 2100
- 1,029,196 · +79.1%
Race, ethnicity, and origin ACS 2023
- Neighborhood character
- Diverse neighborhood (Simpson 0.60)
- Race & ethnicity
- White 57% Black 24% Two or more races 10% Hispanic / Latino 9% Asian 2%
- Hispanic origin (detail)
- Mexican 2% Puerto Rican 2%
- Common ancestry
- Lithuanian 2% Slovak 2% Italian 2%
- Foreign-born
- 8% · Canada, Jamaica
- Languages at home
- 89% English-only · Spanish 7% French/Haitian/Cajun 1% Other Indo-European 1%
Political lean MEDSL · Greenville
- 2024 margin
- Strong R (+22.2) · D 38.0% · R 60.2% · Other 1.8%
- 2008→2024 swing
- +1.7pp toward D · 2008: -23.9pp · 2024: -22.2pp
- All cycles
- 2024: R+22.2 2020: R+18.2 2016: R+24.7 2012: R+27.8 2008: R+23.9
Not yet ingested
- Civics
- —
Market trends
- HPI YoY
- ▼ -102.15%
- Current HPI
- 224.9051
- Rent YoY
- ▲ 2.85%
- Metro
- Greenville-Anderson, SC
- State GDP YoY
- ▲ 4.51%
- F500 in state
- 2
Industry mix (Fortune 500 HQ in SC)
| Industry | F500 HQs | Revenue |
|---|---|---|
| Packaging | 1 | $7B |
|
||
Price history
2 events — show timeline
- 2026-04-13 Listing Removed — Greater Greenville MLS
- 2026-04-13 Listed $250,990 Greater Greenville MLS
Cash-flow waterfall
monthlySold comps — $/sqft
last 12 mo · ≤1 miLoading sold comps…