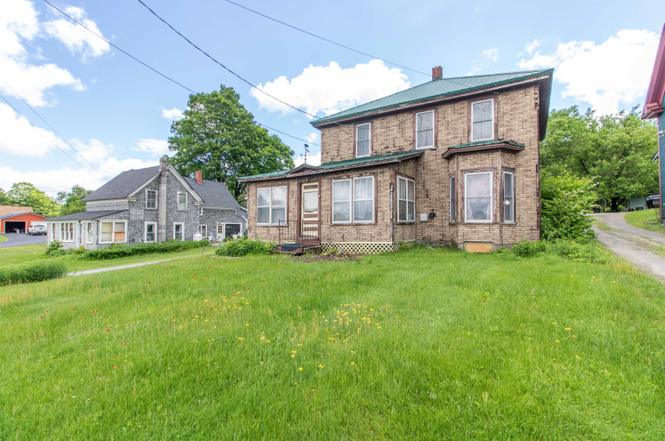
443 Derby St · Brighton, VT
Flood risk 1/10 · Minimal
- FEMA flood zone
- X
- Chance of flooding over 30 yrs
- 0.0%
- Est. flood insurance / yr
- $473 – $860
Fire risk 1/10 · Minimal
- Est. fire insurance / yr
- $480 – $892
Heat risk 1/10 · Minimal
- Hot days now (above 86°F)
- 7 days/yr
- Hot days in 30 yrs
- 17 days/yr
Wind risk 2/10 · Minimal
- Chance of severe wind over 30 yrs
- 3.0%
Air-quality risk 2/10 · Minimal
- Unhealthy air days now
- 1 days/yr
- Unhealthy air days in 30 yrs
- 1 days/yr
Risk factors via First Street. Map © Google.
Why this score? — see what drove the B+ grade
The composite is a weighted blend of 9 inputs, each scored 0–100. Each bar is that input's sub-score; the figure is the points it added to the 100-point composite (weight × sub-score).
- Cash flow +30.0/30.0
- 1% rule +10.0/10.0
- DSCR +10.0/10.0
- Appreciation +7.6/10.0
- ARV discount +7.5/15.0
- Schools +5.0/10.0
- Rent growth +2.5/5.0
- Livability +2.5/5.0
- Condition / age +2.5/5.0
$120,000
🖨 Deal sheet (PDF) 📄 Offer letter ✓ Due diligence
Listing remarks
Opportunity awaits in this spacious New England home located in the heart of Brighton, with the Town of Brighton baseball fields just beyond your backyard, providing plenty of room for outdoor play and prime parking for local games. Conveniently located just minutes from downtown Island Pond, you'll enjoy easy access to local shops, restaurants, and everyday amenities, as well as nearby VAST and VASA trail access for year-round outdoor recreation. Inside, the home features four bedrooms on the second floor, providing plenty of space for family, guests, or a home office. The main level offers a comfortable, open flow between the kitchen, dining room, and living room, along with a bright encl
Key facts
- New propane boiler
- Prime parking
- New england home
Tags
Property features AI
Exterior
- Parking: Detached or attached 2-car garage capacity; Gravel driveway
- Utilities: Public water; Public sewer; Electric service with fuses (Vermont Electric); Propane fuel (Suburban Propane); DSL and cable internet available; Xfinity cable available; Telephone service available
- Home design: Colonial style; Existing single-family wood frame home; Metal roof; Built in 1900; Road frontage present
- Construction: Wood frame construction; Metal roof; Built in 1900
- Exterior features: City lot in town; Near snowmobile and ATV trails; Paved, public, publicly maintained road frontage
Interior
- Kitchen: Gas range; Refrigerator
- Bedrooms: Three bedrooms on the second floor; One bedroom on the first floor
- Flooring: Dirt floor in basement
- Bathrooms: One full bathroom
- Heating & cooling: Propane heating; Hot water heat
- Interior features: Eight total rooms; Porch
- Laundry & utility: Basement access from interior
Neighborhood map
What this means for you Summary
Snapshot
- This is a 4-bed/1.0-bath single-family listed at $120k.
Deal economics
- At list price, monthly cash flow is $1k ($15k/yr) — positive.
- The deal already cash-flows at list — no discount required.
- Meets the 1% rule at list price ($2k rent vs $120k).
Location & tenants
- Location reads: area grade B — affects rentability + tenant quality, not the cash-flow math above.
- Zoned schools: Brighton Elementary School (math 32% / reading 37%, grade F, #123 of 192 statewide, top 66%, 135 students, 62% FRL).
- Market conditions: 17 active listings in the ZIP; 1 comparable units currently listed for rent nearby; 11 units permitted in Essex County in 2024 (0 in 5+ unit buildings).
Forward outlook
- In year one you build about $7k of equity ($830 loan paydown + $6k appreciation (5.3% local appreciation)).
- Essex County population projected at -30% by 2050 — secular population decline; favor cash flow + early exit over multi-decade hold.
- At projected returns (5.3% appreciation + 3.0% rent growth), your $34k cash investment doubles in ~2 years — after that, you're playing with house money.
- By year 5, paydown + projected appreciation supports a ~$31k cash-out refi (75% LTV) — recoverable capital for the next deal without selling this one.
Negotiation context
- Only 3 days on market — expect competitive offers; lowballing is unlikely to land.
Risks & watch-outs
- Watch-outs: built in 1900 — expect roof / HVAC / electrical / plumbing capex.
Questions for the listing agent
- Built in 1900 — when were the roof, HVAC, electrical panel, plumbing, and water heater last replaced?
- Is there a deadline driving the sale (1031 exchange, divorce, estate, relocation)? That informs how much negotiation room exists.
- What's the average days-on-market for RENTAL listings here right now (not sales)? A rising rental-DOM trend means longer vacancies and softer asking-rent achievability than the comps imply.
- What's the recent tenant-quality profile in this submarket — average credit score on applications, eviction rate, late-payment / NSF rate, and stable-employment percentage? A property-management company in the area should have these aggregated.
- How much new for-sale + rental construction is in the pipeline within 1–3 miles? Heavy new supply typically softens prices + rents 12–24 months out; constrained supply supports both.
Investment metrics
- 1% rule
- 2.08% ✓
- Cap rate
- 18.40%
- Cash-on-cash
- 43.25%
- DSCR
- 2.92
- GRM
- 4.0
CMA / ARV
- ARV (on-the-fly)
- $75,174
- Comps found
- 3
Show comp detail 3 sales within ~0.75 mi
| Address | Dist | Beds/Ba | Sqft | Sold | Price | $/sf | Match |
|---|---|---|---|---|---|---|---|
| 34 Clark St | 0.64mi | 4/1.0 | 1,404 (-5%) | 11mo | $30,000 | $21 | 53 |
| 47 Main St | 0.52mi | 3/1.0 (-1) | 1,574 (+7%) | 21mo | $80,000 | $51 | 42 |
| 66 North St | 0.74mi | 3/1.0 (-1) | 1,608 (+9%) | 21mo | $165,000 | $103 | 28 |
Match score weights: distance 35% · size 25% · config 20% · recency 20%. Top-matched comps best support the ARV.
Projected returns pro-forma
5.26% appreciation · 3.0% rent growth · sell at horizon
- IRR
- 51.7%
- Equity multiple
- 4.17×
- Total profit
- $106,556
- Equity at exit
- $69,882
- IRR
- 49.2%
- Equity multiple
- 8.58×
- Total profit
- $254,650
- Equity at exit
- $122,191
Cash invested: $33,600 (down + closing). Projections, not guarantees.
Landlord ↔ Tenant lean methodology
- Overall (STATE)
- 41 Moderately Tenant-Leaning
- State Vermont
- 41 Moderately Tenant-Leaning · D+15
- County
- — inherits STATE
- City
- — inherits STATE
ZIP-level market 05846
- Home prices YoY
- 3.0%
- Active inventory
- 17
- Price-to-rent
- 4.0×
Monthly cashflow live
- Estimated rent
- $2,500 medium interval (Pro) →
- Mortgage (P&I)
- −$629
- Tax from tax record
- −$85 /mo · $1,016/yr
- Insurance
- −$50
- HOA
- −$0
- Vacancy / Maint / Mgmt
- −$525
- Net cashflow
- $1,211
Break-even live
Sensitivity live
| Price | -10% $1,279 | -5% $1,245 | +0% $1,211 | +5% $1,177 | +10% $1,143 |
|---|---|---|---|---|---|
| Rent | -10% $1,014 | -5% $1,112 | +0% $1,211 | +5% $1,310 | +10% $1,409 |
| Rate | -1.0pp $1,271 | -0.5pp $1,242 | base $1,211 | +0.5pp $1,180 | +1.0pp $1,148 |
UW: 25.0% down · 7.5% · 30yr · 1.5% tax · 5.0% vac · 8.0% maint · 8.0% mgmt
Financing live
Cash to close
- Down payment
- $30,000
- Closing costs
- $3,600
- Reserves months
- —
- Total cash needed
- —
Loan-product check · same deal, 3 products live
Conventional
25% down · 7.5% · 30yr
- Down + closing
- —
- Monthly P&I
- —
- Monthly cashflow
- —
- DSCR
- —
- Eligible?
- —
Personal DTI + credit; lowest rate.
DSCR
20% down · 8.5% · 30yr
- Down + closing
- —
- Monthly P&I
- —
- Monthly cashflow
- —
- DSCR
- —
- Eligible?
- —
No personal income docs; deal must DSCR.
Hard money
10% down · 12.0% · 12mo
- Down + closing
- —
- Monthly P&I
- —
- Monthly cashflow
- —
- DSCR
- —
- Eligible?
- —
Short-term bridge; refi at stabilization.
Rent comps 1 comps
| Address | Beds | Baths | Sqft | Rent | $/sqft | DOM | Units | Dist |
|---|---|---|---|---|---|---|---|---|
| 201 Cottage Rd Island Pond, VT | 4.0 | 1.0 | 1400 | $2,500 | $1.79 | 45d | 1 | 0.81mi |
Listing history 4 events
-
2026-06-21days on market $120,000 Active 3 DOM
-
2026-06-21days on market $120,000 Active 2 DOM
-
2026-06-18remarks 699-char remark
-
2026-06-18$120,000 Active 1 DOM
ⓘ Source: listings_history table (triggers on properties + properties_extension) + one-shot
backfill from property_details.listing_events for pre-trigger history.
Tax reassessment forecast VT · Partial reset (capped growth)
- Current annual tax
- $1,016 · $85/mo
- Projected year-2 tax
- $1,648 · $137/mo
- Expected delta
- +$632/yr (+$53/mo · 62.2%)
ⓘ Screening estimate from a state-policy table — verify with the county assessor before closing.
Climate risk First Street
- Flood 1/10 Low FEMA zone X · 0% chance over 30 yrs
- Wildfire 1/10 Low
- Heat 1/10 Low 7 d/yr ≥86°F today · 17 d/yr by 30 yrs out
- Wind 2/10 Low 3% chance of damaging wind over 30 yrs
- Air quality 2/10 Low 1 unhealthy d/yr today · 1 by 30 yrs out
Nearby sold comps map
Loading sold comps map…
Walkable amenities ~0.75 mi
Loading nearby amenities…
Taxation est. · year 1
- Rental income
- $30,000
- − Mortgage interest
- −$6,722
- − Property taxes
- −$1,016
- − Insurance
- −$600
- − Repairs & maintenance
- −$2,400
- − Management
- −$2,400
- − Depreciation
- −$3,491
- Taxable income
- $13,372
- Est. tax owed @ 24.0%
- −$3,209
- After-tax cash flow
- $11,324/yr
For passive investors: Depreciation is non-cash, so a rental often shows a tax loss while cash-flowing — sheltering income. Rental losses are passive: they offset passive income freely, and up to $25,000/yr can offset ordinary (W-2) income if you actively participate and your MAGI is under $100k (phasing out to $0 by $150k); unused losses carry forward. On sale, claimed depreciation is recaptured at up to 25%, and gains may owe capital-gains tax (a 1031 exchange can defer both). Figures are a year-1 estimate at your 24.0% rate — not tax advice; consult a CPA.
Schools (NCES district)
No district data.
Livability — Brighton
No livability data for this city. (Only ~50 U.S. cities are tracked.)
Census & demographics
- Census place
- Island Pond, VT
- Population (ZIP)
- 1,144
Population outlook (Essex County) Hauer SSP2
- Today (2025)
- 5,715 people
- By 2030
- 5,396 · -5.6%
- By 2040
- 4,680 · -18.1%
- By 2050
- 4,025 · -29.6%
- By 2075
- 3,104 · -45.7%
- By 2100
- 2,590 · -54.7%
Race, ethnicity, and origin ACS 2023
- Neighborhood character
- Predominantly White (94%)
- Race & ethnicity
- White 94% Hispanic / Latino 4% Two or more races 2%
- Common ancestry
- Lithuanian 18% Slovak 4% Romanian 2%
- Foreign-born
- 3% · Canada
- Languages at home
- 93% English-only · French/Haitian/Cajun 5% Spanish 3%
Political lean MEDSL · Essex
- 2024 margin
- R (+16.0) · D 39.4% · R 55.4% · Other 5.2%
- 2008→2024 swing
- -30.5pp toward R · 2008: 14.5pp · 2024: -16.0pp
- All cycles
- 2024: R+16.0 2020: R+11.2 2016: R+18.0 2012: D+13.4 2008: D+14.5
Not yet ingested
- Civics
- —
Market trends
- HPI YoY
- ▲ 5.26%
- Current HPI
- 183.2072
- Rent YoY
- —
- Metro
- —
- State GDP YoY
- —
- F500 in state
- 0
Price history
1 event — show timeline
- 2026-06-18 Listed $120,000 PrimeMLS
Property tax history
+1.9%/yrLatest (2024): $1,016 · +9.3% YoY. Source: county tax records.
Cash-flow waterfall
monthlySold comps — $/sqft
last 12 mo · ≤1 miLoading sold comps…