 🏢 Co-op
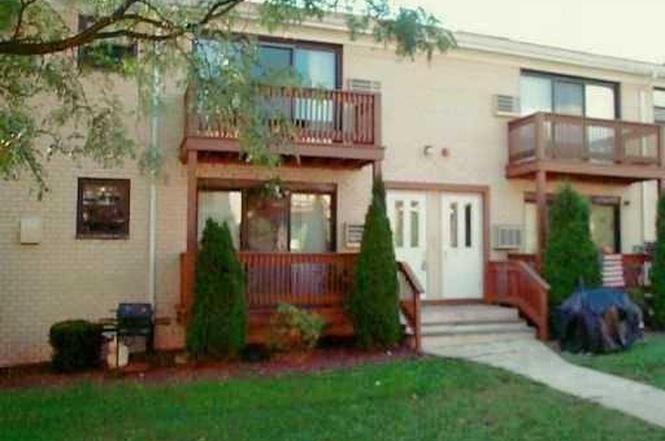
220 Sneden Pl #220 · Spring Valley, NY
Flood risk 1/10 · Minimal
- FEMA flood zone
- X (unshaded)
- Chance of flooding over 30 yrs
- 0.0%
- Est. flood insurance / yr
- $473 – $860
Fire risk 1/10 · Minimal
- Est. fire insurance / yr
- $691 – $1,283
Heat risk 6/10 · Moderate
- Hot days now (above 97°F)
- 7 days/yr
- Hot days in 30 yrs
- 15 days/yr
Wind risk 4/10 · Minor
- Chance of severe wind over 30 yrs
- 23.0%
Air-quality risk 4/10 · Minor
- Unhealthy air days now
- 3 days/yr
- Unhealthy air days in 30 yrs
- 6 days/yr
Risk factors via First Street. Map © Google.
Why this score? — see what drove the B- grade
The composite is a weighted blend of 9 inputs, each scored 0–100. Each bar is that input's sub-score; the figure is the points it added to the 100-point composite (weight × sub-score).
- Cash flow +30.0/30.0
- DSCR +10.0/10.0
- 1% rule +8.5/10.0
- ARV discount +7.5/15.0
- Livability +3.4/5.0
- Schools +2.6/10.0
- Rent growth +2.5/5.0
- Condition / age +2.5/5.0
- Appreciation +0.0/10.0
$169,900
🖨 Deal sheet (PDF) 📄 Offer letter ✓ Due diligence
Listing remarks
This AMAZING TWO BEDROOM unit with EIK features UPDATED appliances, Dining area, Living room with sliding doors to renovated deck. Primary Bedroom with Lavatory, Bedroom and Full Hallway Bathroom with a Bonus room ideal for office Den or Nursery. This Co-op is located in a very well-maintained co-op complex located on the second floor. This unit has Lots of closets. Amenities include play area and pool. Close to Eateries, buses and train to all areas.
Key facts
- Parking
- Community pool
- Built 1972
Neighborhood map
What this means for you Summary
Snapshot
- This is a 2-bed/1.5-bath condo listed at $170k.
Deal economics
- At list price, monthly cash flow is $638 ($8k/yr) — positive.
- The deal already cash-flows at list — no discount required.
- Meets the 1% rule at list price ($2k rent vs $170k).
- Recommended offer: $150k (12.0% below list) — sets the bar for market timing.
- Cap rate 10.8% vs local median 2.2% in Spring Valley — top-decile yield for the area; either an underpriced asset or a hidden risk that comps aren't pricing in. Stress-test before assuming the spread holds.
Location & tenants
- Location reads 67/100 on livability (#588 in NY) — a middle-class / working-renter tenant base. Strengths: commute A+, health & safety B+; Watch: employment D+, crime F, amenities F.
- East Ramapo Central School District (Spring Valley) (suburban): math 22% / reading 34% proficiency, ranked #576 of 590 in NY (top 98%) — low school quality limits family demand, transient renter base, plan for 1-2y turnover; 68% free/reduced lunch — lower-income household profile, screen leases tightly.
- Zoned schools: Margetts Elementary School (math 22% / reading 32%, grade F, #1,786 of 2,108 statewide, top 86%, 609 students, 68% FRL); Chestnut Ridge Middle School (math 9% / reading 30%, grade F, #685 of 729 statewide, top 94%, 646 students, 83% FRL); Spring Valley High School (math 67% / reading 77%, grade B+, #677 of 1,100 statewide, top 63%, 1,434 students, 82% FRL).
- Market conditions: 259 active listings in the ZIP; 10 comparable units currently listed for rent nearby; rentals lingering (median 44d on market — plan ~5-8 weeks vacancy on turnover, expect pricing pressure); 50% of comp listings sitting > 30 days — soft ceiling on asking rent; 429 units permitted in Rockland County in 2024 (231 in 5+ unit buildings).
Forward outlook
- Local home prices are declining (-3.0%/yr); year-one equity from $1k of loan paydown is wiped out by about $5k of value loss. Plan a longer hold.
- Rockland County population projected at +7% by 2050 — modest demand growth; plan on rents tracking national, not racing it.
- At projected returns (-3.0% appreciation + 3.0% rent growth), your $48k cash investment doubles in ~8 years — after that, you're playing with house money.
Negotiation context
- It's been on market 196 days — a 12% lower offer ($150k) is reasonable based on typical stale-listing flexibility.
- 5 sale attempts since 12y ago; this cycle's ask has dropped $10k (6%) from the opening price — seller is motivated, your offer sets the floor, not the list.
- Current owner paid $60k; list at $170k implies a 183% gain — meaningful room to come down on a strong offer.
Risks & watch-outs
- Climate carrying-cost: extreme-heat days projected 7→15/yr by 2055 (HVAC capex compounding) — expect insurance premiums to compound above CPI over the hold.
Questions for the listing agent
- It's been on market 196 days. Have you received any prior offers? Is the seller open to a 12% concession, seller financing, or rate buy-down credit?
- Built in 1972 — when were the roof, HVAC, electrical panel, plumbing, and water heater last replaced?
- Any open or pending special assessments — roof, HVAC, plumbing, elevator, façade? What's the per-unit balance and payoff schedule, and is the seller paying it off at close or rolling it to the buyer?
- Why hasn't it sold? Are there any deal-killer items the seller is aware of (foundation, flood, title, zoning, code violations)?
- Is there a deadline driving the sale (1031 exchange, divorce, estate, relocation)? That informs how much negotiation room exists.
- Crime grade is F in this area — have there been break-ins, vandalism, or insurance claims at this property in the last 3 years? What carrier currently insures it and at what premium?
- What's the average days-on-market for RENTAL listings here right now (not sales)? A rising rental-DOM trend means longer vacancies and softer asking-rent achievability than the comps imply.
- What's the recent tenant-quality profile in this submarket — average credit score on applications, eviction rate, late-payment / NSF rate, and stable-employment percentage? A property-management company in the area should have these aggregated.
- How much new apartment / multifamily construction is in the pipeline within 1–3 miles? Heavy new supply (>2% of stock underway) typically softens rents 12–24 months out; light construction supports rent growth.
Investment metrics
- 1% rule
- 1.35% ✓
- Cap rate
- 10.80%
- Cash-on-cash
- 16.10%
- DSCR
- 1.72
- GRM
- 6.2
CMA / ARV
No comps found within radius.
Projected returns pro-forma
-3.0% appreciation · 3.0% rent growth · sell at horizon
- IRR
- 7.1%
- Equity multiple
- 1.28×
- Total profit
- $13,156
- Equity at exit
- $25,333
- IRR
- 16.4%
- Equity multiple
- 2.34×
- Total profit
- $63,943
- Equity at exit
- $14,690
Cash invested: $47,572 (down + closing). Projections, not guarantees.
Landlord ↔ Tenant lean methodology
- Overall (STATE)
- 15 Strongly Tenant-Friendly
- State New York
- 15 Strongly Tenant-Friendly · D+10
- County
- — inherits STATE
- City
- — inherits STATE
ZIP-level market 10977
- Active inventory
- 259
- Price-to-rent
- 6.2×
Monthly cashflow live
- Estimated rent
- $2,294 high interval (Pro) →
- Mortgage (P&I)
- −$891
- Tax est. 1.5%
- −$212 /mo · $2,548/yr
- Insurance
- −$71
- HOA
- −$0
- Vacancy / Maint / Mgmt
- −$482
- Net cashflow
- $638
Break-even live
Sensitivity live
| Price | -10% $756 | -5% $697 | +0% $638 | +5% $580 | +10% $521 |
|---|---|---|---|---|---|
| Rent | -10% $457 | -5% $548 | +0% $638 | +5% $729 | +10% $820 |
| Rate | -1.0pp $724 | -0.5pp $681 | base $638 | +0.5pp $594 | +1.0pp $549 |
UW: 25.0% down · 7.5% · 30yr · 1.5% tax · 5.0% vac · 8.0% maint · 8.0% mgmt
Financing live
Cash to close
- Down payment
- $42,475
- Closing costs
- $5,097
- Reserves months
- —
- Total cash needed
- —
Loan-product check · same deal, 3 products live
Conventional
25% down · 7.5% · 30yr
- Down + closing
- —
- Monthly P&I
- —
- Monthly cashflow
- —
- DSCR
- —
- Eligible?
- —
Personal DTI + credit; lowest rate.
DSCR
20% down · 8.5% · 30yr
- Down + closing
- —
- Monthly P&I
- —
- Monthly cashflow
- —
- DSCR
- —
- Eligible?
- —
No personal income docs; deal must DSCR.
Hard money
10% down · 12.0% · 12mo
- Down + closing
- —
- Monthly P&I
- —
- Monthly cashflow
- —
- DSCR
- —
- Eligible?
- —
Short-term bridge; refi at stabilization.
Rent comps 10 comps
| Address | Beds | Baths | Sqft | Rent | $/sqft | DOM | Units | Dist |
|---|---|---|---|---|---|---|---|---|
| 285 Sneden Pl W Unit 285 Spring Valley, NY | 1.0 | 1.5 | 850 | $2,650 | $3.12 | 44d | 1 | 0.08mi |
| 68 Sneden Pl W Unit 68 Spring Valley, NY | 1.0 | 1.0 | 800 | $1,850 | $2.31 | 22d | 1 | 0.08mi |
| 15 Summit Ave Spring Valley, NY | 1.0–2.0 | 1.0 | 800 | $1,700 | $2.12 | 44d | 2 | 1.05mi |
| 42 Monsey Blvd Ramapo, NY | 1.0–2.0 | 1.0 | 620 | $2,490 | $4.02 | 2d | 2 | 1.12mi |
| 70 Chester Ln Nanuet, NY | 1.0 | 1.0 | 949 | $2,375 | $2.50 | 44d | 1 | 1.16mi |
| 127 Pipetown Hill Rd Nanuet, NY | 2.0 | 2.5 | 1065 | $2,750 | $2.58 | 44d | 1 | 1.38mi |
| 401 Town Hill Rd Unit 1D Nanuet, NY | 1.0 | 1.0 | 844 | $2,400 | $2.84 | 44d | 1 | 1.41mi |
| 709 Kennedy Dr Spring Valley, NY | 2.0 | 1.0 | 817 | $2,500 | $3.06 | 8d | 1 | 1.41mi |
| 304 Town Hill Rd Nanuet, NY | 1.0 | 1.0 | 800 | $2,625 | $3.28 | 5d | 1 | 1.41mi |
| 715 Kennedy Dr Spring Valley, NY | 2.0 | 2.0 | 1039 | $2,650 | $2.55 | 25d | 1 | 1.42mi |
HOA detail condo
- Monthly dues
- $0 · $0/yr
- Likely covers
- pool
- Assessments
- None detected in remarks — confirm with the listing agent.
Listing history 19 events
-
2026-03-27status Pending
-
2026-02-17price $169,900
-
2025-09-07$179,900 Active
-
2025-09-03historical $179,900
-
2021-11-09historical
-
2021-04-02status Pending
-
2021-02-08$94,900 Active
-
2019-05-29historical
-
2019-01-25status Pending
-
2018-12-20$85,000 Active
-
2015-06-04soldstatus $60,000 Sold
-
2015-06-04price $60,000
-
2015-06-03soldstatus $60,000
-
2015-03-05historical Pending
-
2015-03-04price $65,000
-
2015-02-16price $65,000
-
2014-10-24price $69,500
-
2014-08-27$74,500 Active
-
2014-08-27$65,000
ⓘ Source: listings_history table (triggers on properties + properties_extension) + one-shot
backfill from property_details.listing_events for pre-trigger history.
Climate risk First Street
- Flood 1/10 Low FEMA zone X (unshaded) · 0% chance over 30 yrs
- Wildfire 1/10 Low
- Heat 6/10 Major 7 d/yr ≥97°F today · 15 d/yr by 30 yrs out
- Wind 4/10 Moderate 23% chance of damaging wind over 30 yrs
- Air quality 4/10 Moderate 3 unhealthy d/yr today · 6 by 30 yrs out
Nearby sold comps map
Loading sold comps map…
Walkable amenities ~0.75 mi
Loading nearby amenities…
Taxation est. · year 1
- Rental income
- $27,530
- − Mortgage interest
- −$9,517
- − Property taxes
- −$2,548
- − Insurance
- −$850
- − Repairs & maintenance
- −$2,202
- − Management
- −$2,202
- − Depreciation
- −$4,943
- Taxable income
- $5,268
- Est. tax owed @ 24.0%
- −$1,264
- After-tax cash flow
- $6,395/yr
For passive investors: Depreciation is non-cash, so a rental often shows a tax loss while cash-flowing — sheltering income. Rental losses are passive: they offset passive income freely, and up to $25,000/yr can offset ordinary (W-2) income if you actively participate and your MAGI is under $100k (phasing out to $0 by $150k); unused losses carry forward. On sale, claimed depreciation is recaptured at up to 25%, and gains may owe capital-gains tax (a 1031 exchange can defer both). Figures are a year-1 estimate at your 24.0% rate — not tax advice; consult a CPA.
Schools (NCES district)
- District
- East Ramapo Central School District (Spring Valley)
- NCES district ID
- 3627810
- Math proficiency
- 22% ▼ -10.00%
- Reading proficiency
- 34% ▼ -2.00%
- Median HH income
- $61,547
- Composite
- 25.6/100
- National rank
- #7418
- State rank
- #576 of 590 in NY
Livability — Spring Valley
- Score
- 67/100
- State rank
- #588
- US rank
- #10623
Category grades
Schools grade is shown separately in the Schools card above.
Census & demographics
- Census place
- Spring Valley, NY
- City population
- 71,465
- Population (ZIP)
- 71,465
Population outlook (Rockland County) Hauer SSP2
- Today (2025)
- 339,642 people
- By 2030
- 345,987 · +1.9%
- By 2040
- 357,178 · +5.2%
- By 2050
- 362,456 · +6.7%
- By 2075
- 367,281 · +8.1%
- By 2100
- 328,211 · -3.4%
Race, ethnicity, and origin ACS 2023
- Neighborhood character
- Diverse neighborhood (Simpson 0.62)
- Race & ethnicity
- White 55% Hispanic / Latino 23% Black 16% Two or more races 5% Asian 3%
- Hispanic origin (detail)
- Mexican 1% Puerto Rican 2% Dominican 2%
- Common ancestry
- Hispanic 7% Romanian 5% Italian 2%
- Foreign-born
- 27% · Canada
- Languages at home
- 31% English-only · German/W. Germanic 32% Spanish 21% French/Haitian/Cajun 10%
Political lean MEDSL · Rockland
- 2024 margin
- R (+11.8) · D 44.1% · R 55.9%
- 2008→2024 swing
- -17.7pp toward R · 2008: 5.9pp · 2024: -11.8pp
- All cycles
- 2024: R+11.8 2020: D+1.7 2016: D+5.1 2012: D+6.6 2008: D+5.9
Not yet ingested
- Civics
- —
Market trends
- HPI YoY
- ▼ -518.82%
- Current HPI
- 378.2133
- Rent YoY
- —
- Metro
- —
- State GDP YoY
- ▲ 2.60%
- F500 in state
- 92
Industry mix (Fortune 500 HQ in NY)
| Industry | F500 HQs | Revenue |
|---|---|---|
| Financial Services | 10 | $950B |
|
||
| Consumer Goods | 9 | $162B |
|
||
| Insurance | 4 | $225B |
|
||
| Telecommunications | 2 | $144B |
|
||
| Pharmaceuticals | 2 | $112B |
|
||
| Media / Entertainment | 2 | $69B |
|
||
Price history
+161.4% since first listed19 events — show timeline
- 2026-03-27 Pending — OneKey® MLS as Distributed by MLS Grid
- 2026-02-17 Price Changed $169,900 OneKey® MLS as Distributed by MLS Grid
- 2025-09-07 Listed $179,900 OneKey® MLS as Distributed by MLS Grid
- 2025-09-03 Coming Soon $179,900 OneKey® MLS as Distributed by MLS Grid
- 2021-11-09 Listing Removed — OneKey® MLS as Distributed by MLS Grid
- 2021-04-02 Pending — OneKey® MLS as Distributed by MLS Grid
- 2021-02-08 Listed $94,900 OneKey® MLS as Distributed by MLS Grid
- 2019-05-29 Listing Removed — OneKey® MLS as Distributed by MLS Grid
- 2019-01-25 Pending — OneKey® MLS as Distributed by MLS Grid
- 2018-12-20 Listed $85,000 OneKey® MLS as Distributed by MLS Grid
- 2015-06-04 Price Changed $60,000 HGMLS
- 2015-06-04 Sold (MLS) $60,000 HGMLS
- 2015-06-03 Sold (MLS) $60,000 OneKey® MLS as Distributed by MLS Grid
- 2015-03-05 Contingent — HGMLS
- 2015-03-04 Price Changed $65,000 HGMLS
- 2015-02-16 Price Changed $65,000 HGMLS
- 2014-10-24 Price Changed $69,500 HGMLS
- 2014-08-27 Listed $74,500 HGMLS
- 2014-08-27 Listed $65,000 OneKey® MLS as Distributed by MLS Grid
Cash-flow waterfall
monthlySold comps — $/sqft
last 12 mo · ≤1 miLoading sold comps…