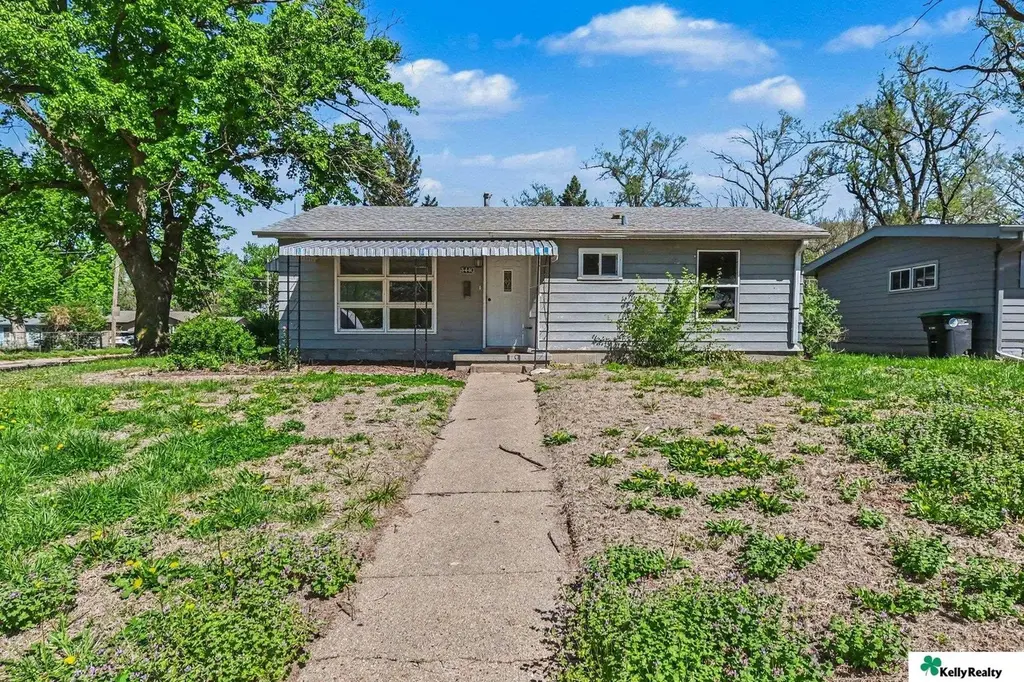
4440 Vernon Ave · Omaha, NE
Flood risk 1/10 · Minimal
- FEMA flood zone
- X (unshaded)
- Chance of flooding over 30 yrs
- 0.0%
- Est. flood insurance / yr
- $507 – $1,088
Fire risk 2/10 · Minimal
- Est. fire insurance / yr
- $1,161 – $2,155
Heat risk 3/10 · Minor
- Hot days now (above 103°F)
- 7 days/yr
- Hot days in 30 yrs
- 14 days/yr
Wind risk 2/10 · Minimal
- Chance of severe wind over 30 yrs
- —
Air-quality risk 2/10 · Minimal
- Unhealthy air days now
- 0 days/yr
- Unhealthy air days in 30 yrs
- 1 days/yr
Risk factors via First Street. Map © Google.
Why this score? — see what drove the B- grade
The composite is a weighted blend of 9 inputs, each scored 0–100. Each bar is that input's sub-score; the figure is the points it added to the 100-point composite (weight × sub-score).
- Cash flow +22.6/30.0
- Appreciation +10.0/10.0
- ARV discount +9.4/15.0
- DSCR +7.2/10.0
- 1% rule +5.8/10.0
- Livability +4.2/5.0
- Rent growth +3.3/5.0
- Condition / age +2.5/5.0
- Schools +2.1/10.0
$125,000
🖨 Deal sheet (PDF) 📄 Offer letter ✓ Due diligence
Listing remarks MLS
Investors delight! Home needs alot of work priced accordingly. New roof installed this summer. House sits on corner lot with 1 car garage.
Key facts
- 9,583 sq ft lot
- Garage
- Built 1955
Property features AI
Exterior
- Parking: Attached covered garage with 1 parking space
- Utilities: Public water; Public sewer
- Home design: Single-family residence; Built in 1955; Living area approximately 864
- Construction: Slab foundation
- Exterior features: Lot about 0.22 acre (approx. 64 x 150); Lot up to 1/4 acre
Interior
- Bedrooms: Master bedroom on the main floor; Second bedroom on the main floor; Third bedroom on the main floor
- Bathrooms: One full bathroom on the main floor
- Heating & cooling: Electric forced-air heating
- Interior features: No basement; No fireplaces
Neighborhood map
What this means for you Summary
Snapshot
- This is a 3-bed/1.0-bath single-family listed at $125k.
Deal economics
- At list price, monthly cash flow is $212 ($3k/yr) — positive.
- The deal already cash-flows at list — no discount required.
- Meets the 1% rule at list price ($1k rent vs $125k).
- Recommended offer: $123k (1.5% below list) — sets the bar for market timing.
- Cap rate 8.3% vs local median 3.6% in Omaha — top-decile yield for the area; either an underpriced asset or a hidden risk that comps aren't pricing in. Stress-test before assuming the spread holds.
Location & tenants
- Location reads 84/100 on livability (#7 in NE, #663 nationally) — a professional / high-income tenant draw. Strengths: amenities A+, commute A+, cost of living A+; Watch: crime F.
- Omaha Public Schools (urban): math 20% / reading 28% proficiency, ranked #110 of 111 in NE (top 99%) — low school quality limits family demand, transient renter base, plan for 1-2y turnover; 62% free/reduced lunch — lower-income household profile, screen leases tightly.
- Zoned schools: Wakonda Elementary School (math 12% / reading 22%, grade F, #471 of 502 statewide, top 95%, 325 students, 0% FRL); Bryan Middle School (math 11% / reading 25%, grade F, #123 of 128 statewide, top 96%, 866 students, 0% FRL); Northwest High School (math 8% / reading 14%, grade F, #256 of 261 statewide, top 98%, 1,593 students, 0% FRL) — zoned schools average 0% FRL vs 62% district-wide (62 pts lower); this property's tenant base skews higher-income than the district average.
- Market conditions: Rents rising (+3.2%/yr); 139 active listings in the ZIP; 20 comparable units currently listed for rent nearby; rentals at typical pace (median 25d on market — plan ~3-4 weeks tenant-placement turnaround); lower-income renter base — watch delinquency; 4,539 units permitted in Douglas County in 2024 (2,583 in 5+ unit buildings).
- This rent runs 38% of the median local income ($42k/yr) — at the standard rent-burdened threshold; future hikes will face affordability resistance.
Forward outlook
- In year one you build about $13k of equity ($864 loan paydown + $12k appreciation (10.0% local appreciation)).
- Douglas County population projected at +28% by 2050 — long-run rental-demand tailwind backs the buy-and-hold thesis.
- At projected returns (10.0% appreciation + 3.2% rent growth), your $35k cash investment doubles in ~3 years — after that, you're playing with house money.
- By year 3, paydown + projected appreciation supports a ~$34k cash-out refi (75% LTV) — recoverable capital for the next deal without selling this one.
Negotiation context
- It's been on market 19 days — a 2% lower offer ($123k) is reasonable based on typical stale-listing flexibility.
- 3 sale attempts since 24y ago with the ask held roughly flat each time — persistent listings suggest the price (not the market) is what's stuck; bring a comps-based counter.
Risks & watch-outs
- Watch-outs: built in 1955 — expect roof / HVAC / electrical / plumbing capex.
Questions for the listing agent
- Built in 1955 — when were the roof, HVAC, electrical panel, plumbing, and water heater last replaced?
- Is there a deadline driving the sale (1031 exchange, divorce, estate, relocation)? That informs how much negotiation room exists.
- Crime grade is F in this area — have there been break-ins, vandalism, or insurance claims at this property in the last 3 years? What carrier currently insures it and at what premium?
- What's the average days-on-market for RENTAL listings here right now (not sales)? A rising rental-DOM trend means longer vacancies and softer asking-rent achievability than the comps imply.
- What's the recent tenant-quality profile in this submarket — average credit score on applications, eviction rate, late-payment / NSF rate, and stable-employment percentage? A property-management company in the area should have these aggregated.
- How much new for-sale + rental construction is in the pipeline within 1–3 miles? Heavy new supply typically softens prices + rents 12–24 months out; constrained supply supports both.
Investment metrics
- 1% rule
- 1.08% ✓
- Cap rate
- 8.33%
- Cash-on-cash
- 7.26%
- DSCR
- 1.32
- GRM
- 7.7
CMA / ARV
- ARV (median comp)
- $130,437
- List price
- $125,000
- Delta
- -4.17%
- Verdict
- FAIR
- Comps
- 20 within 1.0 mi
Show comp detail 12 sales within ~0.75 mi
| Address | Dist | Beds/Ba | Sqft | Sold | Price | $/sf | Match |
|---|---|---|---|---|---|---|---|
| 4237 Curtis Ave | 0.17mi | 3/1.0 | 864 (0%) | 2mo | $134,900 | $156 | 91 |
| 4511 Laurel Ave | 0.34mi | 3/1.0 | 912 (+6%) | 1mo | $170,000 | $186 | 74 |
| 6320 N 42nd St | 0.22mi | 3/1.0 | 936 (+8%) | 2mo | $195,000 | $208 | 74 |
| 4026 Curtis Ave | 0.32mi | 3/1.0 | 909 (+5%) | 8mo | $135,000 | $149 | 70 |
| 4215 Vernon Ave | 0.20mi | 2/1.5 (-1) | 820 (-5%) | 10mo | $165,000 | $201 | 67 |
| 4502 Jaynes St | 0.51mi | 3/1.0 | 912 (+6%) | 7mo | $175,000 | $192 | 61 |
| 5401 N 45th Ave N | 0.65mi | 3/1.0 | 912 (+6%) | 2mo | $128,500 | $141 | 59 |
| 5433 N 45th Ave | 0.57mi | 3/1.5 | 912 (+6%) | 10mo | $195,000 | $214 | 54 |
| 4552 Ogden Ave | 0.56mi | 3/1.0 | 975 (+13%) | 2mo | $100,500 | $103 | 51 |
| 3730 Himebaugh Ave | 0.66mi | 2/1.0 (-1) | 806 (-7%) | 4mo | $125,000 | $155 | 50 |
| 4235 Redman Ave | 0.49mi | 2/1.0 (-1) | 744 (-14%) | 6mo | $110,000 | $148 | 44 |
| 5328 Fontenelle | 0.67mi | 2/1.0 (-1) | 768 (-11%) | 1mo | $169,900 | $221 | 44 |
Match score weights: distance 35% · size 25% · config 20% · recency 20%. Top-matched comps best support the ARV.
Projected returns pro-forma
10.0% appreciation · 3.22% rent growth · sell at horizon
- IRR
- 29.7%
- Equity multiple
- 3.34×
- Total profit
- $81,888
- Equity at exit
- $112,610
- IRR
- 25.8%
- Equity multiple
- 7.61×
- Total profit
- $231,176
- Equity at exit
- $242,848
Cash invested: $35,000 (down + closing). Projections, not guarantees.
Landlord ↔ Tenant lean methodology
- Overall (STATE)
- 83 Strongly Landlord-Friendly
- State Nebraska
- 83 Strongly Landlord-Friendly · R+13
- County
- — inherits STATE
- City
- — inherits STATE
ZIP-level market 68111
- Home prices YoY
- 4.0%
- Rents YoY
- 3.2%
- Active inventory
- 139
- Price-to-rent
- 7.7×
Monthly cashflow live
- Estimated rent
- $1,351 high interval (Pro) →
- Mortgage (P&I)
- −$656
- Tax from tax record
- −$147 /mo · $1,769/yr
- Insurance
- −$52
- HOA
- −$0
- Vacancy / Maint / Mgmt
- −$284
- Net cashflow
- $212
Break-even live
Sensitivity live
| Price | -10% $283 | -5% $247 | +0% $212 | +5% $176 | +10% $141 |
|---|---|---|---|---|---|
| Rent | -10% $105 | -5% $159 | +0% $212 | +5% $265 | +10% $319 |
| Rate | -1.0pp $275 | -0.5pp $244 | base $212 | +0.5pp $179 | +1.0pp $147 |
UW: 25.0% down · 7.5% · 30yr · 1.5% tax · 5.0% vac · 8.0% maint · 8.0% mgmt
Financing live
Cash to close
- Down payment
- $31,250
- Closing costs
- $3,750
- Reserves months
- —
- Total cash needed
- —
Loan-product check · same deal, 3 products live
Conventional
25% down · 7.5% · 30yr
- Down + closing
- —
- Monthly P&I
- —
- Monthly cashflow
- —
- DSCR
- —
- Eligible?
- —
Personal DTI + credit; lowest rate.
DSCR
20% down · 8.5% · 30yr
- Down + closing
- —
- Monthly P&I
- —
- Monthly cashflow
- —
- DSCR
- —
- Eligible?
- —
No personal income docs; deal must DSCR.
Hard money
10% down · 12.0% · 12mo
- Down + closing
- —
- Monthly P&I
- —
- Monthly cashflow
- —
- DSCR
- —
- Eligible?
- —
Short-term bridge; refi at stabilization.
Rent comps 20 comps
| Address | Beds | Baths | Sqft | Rent | $/sqft | DOM | Units | Dist |
|---|---|---|---|---|---|---|---|---|
| 4018 Bauman Ave Omaha, NE | 3.0 | 1.0 | 925 | $1,380 | $1.49 | 44d | 1 | 0.32mi |
| 4460 Redman Ave Omaha, NE | 3.0 | 1.0 | 750 | $950 | $1.27 | 44d | 1 | 0.41mi |
| 4470 Redman Ave Unit 4470A Omaha, NE | 2.0 | 1.5 | 980 | $1,050 | $1.07 | 11d | 1 | 0.42mi |
| 3941 Himebaugh Ave Omaha, NE | 2.0 | 1.0 | 720 | $1,350 | $1.88 | 24d | 1 | 0.55mi |
| 6327 N 51st Ave Omaha, NE | 3.0 | 1.0 | 860 | $1,450 | $1.69 | 24d | 1 | 0.70mi |
| 3164 Ida St Omaha, NE | 3.0 | 1.0 | 946 | $1,600 | $1.69 | 2d | 1 | 1.08mi |
| 3164 Ida St Omaha, NE | 3.0 | 1.0 | 946 | $1,600 | $1.69 | 11d | 1 | 1.08mi |
| 3164 Ida St Omaha, NE | 3.0 | 1.0 | 946 | $1,600 | $1.69 | 44d | 1 | 1.08mi |
| 5615 Northampton Blvd Omaha, NE | 3.0 | 1.0–1.5 | 781 | $1,500 | $1.92 | 2d | 1 | 1.10mi |
| 3138 Weber Cir Omaha, NE | 2.0 | 1.0 | 750 | $1,200 | $1.60 | 44d | 1 | 1.18mi |
| 4918 Ames Ave Unit 17 Omaha, NE | 2.0 | 1.5 | 1074 | $850 | $0.79 | 24d | 1 | 1.23mi |
| 4844 Taylor St Apt 4 Omaha, NE | 2.0 | 1.0 | 750 | $925 | $1.23 | 24d | 1 | 1.30mi |
| 2873 Kansas Ave Omaha, NE | 3.0 | 2.0 | 1112 | $1,450 | $1.30 | 24d | 1 | 1.31mi |
| 5922 N 28th Ave Omaha, NE | 2.0 | 1.0 | 764 | $950 | $1.24 | 3d | 1 | 1.37mi |
| 4852 Boyd St Omaha, NE | 2.0 | 2.0 | 912 | $1,500 | $1.64 | 44d | 1 | 1.37mi |
| 2723 Newport Ave Omaha, NE | 2.0 | 1.0 | 1079 | $1,450 | $1.34 | 2d | 1 | 1.42mi |
| 4112 N 48th St Omaha, NE | 2.0 | 1.0 | 825 | $899 | $1.09 | 11d | 2 | 1.46mi |
| 4112 N 48th St Unit 3 Omaha, NE | 2.0 | 1.0 | 800 | $850 | $1.06 | 24d | 1 | 1.46mi |
| 4112 N 48th St Unit 2 Omaha, NE | 2.0 | 1.0 | 800 | $899 | $1.12 | 24d | 1 | 1.46mi |
| 4625 N 56th St Apt 18 Omaha, NE | 2.0 | 1.0 | 700 | $875 | $1.25 | 44d | 1 | 1.49mi |
Listing history 9 events
-
2026-04-30$125,000 New 497-char remark
-
2008-12-18soldstatus $17,777
-
2008-12-05soldstatus $17,500 140-char remark
Show marketing remark (140 chars)
Investors delight! Home needs alot of work priced accordingly. New roof installed this summer. House sits on corner lot with 1 car garage.
-
2008-11-21historical 140-char remark
Show marketing remark (140 chars)
Investors delight! Home needs alot of work priced accordingly. New roof installed this summer. House sits on corner lot with 1 car garage.
-
2008-11-11$20,000 140-char remark
Show marketing remark (140 chars)
Investors delight! Home needs alot of work priced accordingly. New roof installed this summer. House sits on corner lot with 1 car garage.
-
2002-09-06soldstatus $48,000
Show marketing remark (134 chars)
Well Kept Ranch In Nice Area.Level Corner Lot,Storage Shed.Newer H2o,Furn.New Range,Refrigerator.Main Flr Laundry.Lots Of Storage.Ama.
-
2002-09-05soldstatus $48,000
-
2002-08-24historical
Show marketing remark (134 chars)
Well Kept Ranch In Nice Area.Level Corner Lot,Storage Shed.Newer H2o,Furn.New Range,Refrigerator.Main Flr Laundry.Lots Of Storage.Ama.
-
2002-08-21$49,950
Show marketing remark (134 chars)
Well Kept Ranch In Nice Area.Level Corner Lot,Storage Shed.Newer H2o,Furn.New Range,Refrigerator.Main Flr Laundry.Lots Of Storage.Ama.
ⓘ Source: listings_history table (triggers on properties + properties_extension) + one-shot
backfill from property_details.listing_events for pre-trigger history.
Tax reassessment forecast NE · Resets to sale price
- Current annual tax
- $1,769 · $147/mo
- Projected year-2 tax
- $2,162 · $180/mo
- Expected delta
- +$393/yr (+$33/mo · 22.2%)
ⓘ Screening estimate from a state-policy table — verify with the county assessor before closing.
Climate risk First Street
- Flood 1/10 Low FEMA zone X (unshaded) · 0% chance over 30 yrs
- Wildfire 2/10 Low
- Heat 3/10 Moderate 7 d/yr ≥103°F today · 14 d/yr by 30 yrs out
- Wind 2/10 Low
- Air quality 2/10 Low 0 unhealthy d/yr today · 1 by 30 yrs out
Nearby sold comps map
Loading sold comps map…
Walkable amenities ~0.75 mi
Loading nearby amenities…
Taxation est. · year 1
- Rental income
- $16,206
- − Mortgage interest
- −$7,002
- − Property taxes
- −$1,769
- − Insurance
- −$625
- − Repairs & maintenance
- −$1,296
- − Management
- −$1,296
- − Depreciation
- −$3,636
- Taxable income
- $581
- Est. tax owed @ 24.0%
- −$139
- After-tax cash flow
- $2,403/yr
For passive investors: Depreciation is non-cash, so a rental often shows a tax loss while cash-flowing — sheltering income. Rental losses are passive: they offset passive income freely, and up to $25,000/yr can offset ordinary (W-2) income if you actively participate and your MAGI is under $100k (phasing out to $0 by $150k); unused losses carry forward. On sale, claimed depreciation is recaptured at up to 25%, and gains may owe capital-gains tax (a 1031 exchange can defer both). Figures are a year-1 estimate at your 24.0% rate — not tax advice; consult a CPA.
Schools (NCES district)
- District
- Omaha Public Schools
- NCES district ID
- 3174820
- Math proficiency
- 20% ▼ -10.00%
- Reading proficiency
- 28% ▼ -5.00%
- Median HH income
- $46,039
- Composite
- 20.83/100
- National rank
- #8502
- State rank
- #110 of 111 in NE
Livability — Omaha
- Score
- 84/100
- State rank
- #7
- US rank
- #663
Category grades
Schools grade is shown separately in the Schools card above.
Census & demographics
- Census place
- Omaha, NE
- County
- Douglas County · 538,646 people
- City population
- 552,986
- Metro
- Omaha-Council Bluffs, NE-IA
- Population (ZIP)
- 24,210
- Household income
- $42,185
- Rent vs Own
- Severe rent burden
- 1913.0
Population outlook (Douglas County) Hauer SSP2
- Today (2025)
- 625,245 people
- By 2030
- 661,613 · +5.8%
- By 2040
- 732,395 · +17.1%
- By 2050
- 801,988 · +28.3%
- By 2075
- 968,637 · +54.9%
- By 2100
- 1,101,871 · +76.2%
Race, ethnicity, and origin ACS 2023
- Neighborhood character
- Diverse neighborhood (Simpson 0.65)
- Race & ethnicity
- Black 52% Hispanic / Latino 21% White 17% Two or more races 15% Asian 3% Native American 1%
- Hispanic origin (detail)
- Mexican 14%
- Common ancestry
- Ukrainian 3% Lithuanian 0%
- Foreign-born
- 14% · Canada, Philippines
- Languages at home
- 75% English-only · Spanish 16% Other Asian/Pacific 3% French/Haitian/Cajun 1%
Political lean MEDSL · Douglas
- 2024 margin
- D (+10.2) · D 54.4% · R 44.2% · Other 1.4%
- 2008→2024 swing
- +5.5pp toward D · 2008: 4.6pp · 2024: 10.2pp
- All cycles
- 2024: D+10.2 2020: D+11.3 2016: D+1.4 2012: R+4.3 2008: D+4.6
Not yet ingested
- Civics
- —
Market trends
- HPI YoY
- ▲ 13.82%
- Current HPI
- 358.7174
- Rent YoY
- ▲ 3.22%
- Metro
- Omaha-Council Bluffs, NE-IA
- State GDP YoY
- ▲ 0.68%
- F500 in state
- 2
Industry mix (Fortune 500 HQ in NE)
| Industry | F500 HQs | Revenue |
|---|---|---|
| Conglomerate | 1 | $371B |
|
||
Price history
+130.2% since first listed11 events — show timeline
- 2026-06-03 Sold (MLS) $115,000 GPRMLS
- 2026-05-19 Pending — GPRMLS
- 2026-04-30 Listed $125,000 GPRMLS
- 2008-12-18 Sold (Public Records) $17,777 Public Records
- 2008-12-05 Sold (MLS) $17,500 GPRMLS
- 2008-11-21 Listing Removed — GPRMLS
- 2008-11-11 Listed $20,000 GPRMLS
- 2002-09-06 Sold (MLS) $48,000 GPRMLS
- 2002-09-05 Sold (Public Records) $48,000 Public Records
- 2002-08-24 Listing Removed — GPRMLS
- 2002-08-21 Listed $49,950 GPRMLS
Property tax history
+9.1%/yrLatest (2025): $1,769 · +26.3% YoY. Source: county tax records.
Cash-flow waterfall
monthlySold comps — $/sqft
last 12 mo · ≤1 miLoading sold comps…