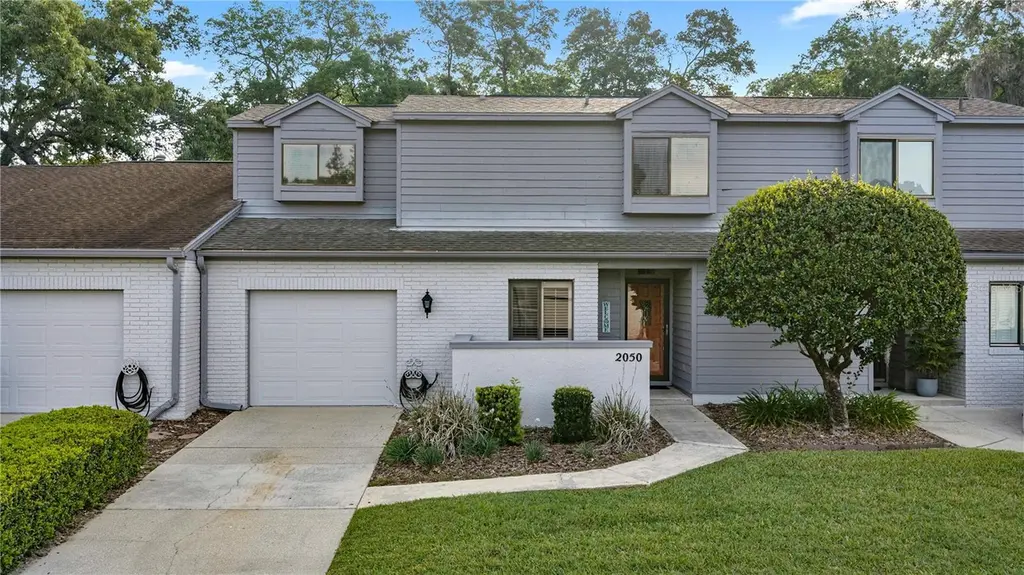
2050 SE 37th Court Cir · Ocala, FL
Flood risk 5/10 · Moderate
- FEMA flood zone
- X (shaded)
- Chance of flooding over 30 yrs
- 0.24%
- Est. flood insurance / yr
- $507 – $1,088
Fire risk 2/10 · Minimal
- Est. fire insurance / yr
- $947 – $1,759
Heat risk 8/10 · Major
- Hot days now (above 108°F)
- 7 days/yr
- Hot days in 30 yrs
- 21 days/yr
Wind risk 9/10 · Severe
- Chance of severe wind over 30 yrs
- 99.0%
Air-quality risk 4/10 · Minor
- Unhealthy air days now
- 5 days/yr
- Unhealthy air days in 30 yrs
- 5 days/yr
Risk factors via First Street. Map © Google.
Why this score? — see what drove the D grade
The composite is a weighted blend of 9 inputs, each scored 0–100. Each bar is that input's sub-score; the figure is the points it added to the 100-point composite (weight × sub-score).
- ARV discount +15.0/15.0
- Cash flow +9.4/30.0
- 1% rule +3.9/10.0
- Schools +3.6/10.0
- Livability +3.5/5.0
- DSCR +2.6/10.0
- Condition / age +2.5/5.0
- Rent growth +2.3/5.0
- Appreciation +0.0/10.0
$230,000
🖨 Deal sheet (PDF) 📄 Offer letter ✓ Due diligence
Listing remarks MLS
Welcome to 2050 SE 37th Ct Cir, a well-positioned home in SE Ocala offering a balance of convenience and everyday comfort. Located just minutes from shopping, dining, and downtown Ocala, this property provides easy access to the amenities that make daily life more enjoyable. Inside, the home features a bright and functional layout with generous living spaces and a natural flow between rooms. Large windows bring in abundant light, creating an inviting atmosphere throughout. The floor plan offers flexibility for a variety of living arrangements and uses. The outdoor space provides additional room to enjoy the Florida lifestyle, whether for relaxing, entertaining, or simply unwinding at the end of the day. A notable feature of this property is its placement on an emergency power grid, offering added reliability during outages and peace of mind year-round along with the 6 year old roof and air conditioner with plenty of durability for years to come! With its convenient location and practical features, this home presents a great opportunity in one of Ocala’s established areas.
Key facts
- 6 year old roof
- Outdoor space
- 1,965 sq ft lot
Tags
Neighborhood map
What this means for you Summary
Snapshot
- This is a 3-bed/2.5-bath condo listed at $230k.
Deal economics
- At list price, monthly cash flow is $-164 ($-2k/yr) — negative.
- To cash-flow at today's rent, offer at most $201k (12.6% below list).
- To meet the 1% rule (rent ≥ 1% of price), the offer needs to be $205k (10.8% below list).
- Recommended offer: $201k (12.6% below list) — sets the bar for cash-flow.
- Cap rate 5.4% vs local median 4.1% in Ocala — top-decile yield for the area; either an underpriced asset or a hidden risk that comps aren't pricing in. Stress-test before assuming the spread holds.
Location & tenants
- Location reads 69/100 on livability (#476 in FL) — a middle-class / working-renter tenant base. Strengths: cost of living A+, housing A+, health & safety A+; Watch: crime F, amenities F, commute F.
- Marion (rural): math 42% / reading 43% proficiency, ranked #61 of 73 in FL (top 84%) — families likely to look elsewhere, expect single-tenant / working-renter base with shorter leases; 61% free/reduced lunch — lower-income household profile, screen leases tightly.
- Zoned schools: Maplewood Elementary School (math 63% / reading 47%, grade C, #872 of 2,144 statewide, top 42%, 817 students, 56% FRL); Osceola Middle School (math 60% / reading 58%, grade B, #144 of 571 statewide, top 26%, 999 students, 44% FRL); Forest High School (math 36% / reading 54%, grade D-, #228 of 667 statewide, top 35%, 2,325 students, 42% FRL).
- Market conditions: Rents soft (-0.6%/yr); 318 active listings in the ZIP; 12 comparable units currently listed for rent nearby; rentals at typical pace (median 23d on market — plan ~3-4 weeks tenant-placement turnaround); 7,071 units permitted in Marion County in 2024 (534 in 5+ unit buildings).
- This rent runs 37% of the median local income ($66k/yr) — at the standard rent-burdened threshold; future hikes will face affordability resistance.
Forward outlook
- Local home prices are declining (-3.0%/yr); year-one equity from $2k of loan paydown is wiped out by about $7k of value loss. Plan a longer hold.
- Marion County population projected at +13% by 2050 — modest demand growth; plan on rents tracking national, not racing it.
Negotiation context
- It's been on market 74 days — a 6% lower offer ($216k) is reasonable based on typical stale-listing flexibility.
- 4 sale attempts since 10y ago with the ask held roughly flat each time — persistent listings suggest the price (not the market) is what's stuck; bring a comps-based counter.
- Current owner paid $157k; 46% above their basis — modest negotiation headroom, anchor on the comps not their cost.
Risks & watch-outs
- Climate carrying-cost: moderate flood risk; severe wind risk, 99% chance of damaging wind over 30y; extreme-heat days projected 7→21/yr by 2055 (HVAC capex compounding) — expect insurance premiums to compound above CPI over the hold.
Questions for the listing agent
- What do current leases actually rent for vs. the listed asking? Can we see a recent rent roll and the last 12 months of T-12 income?
- It's been on market 74 days. Have you received any prior offers? Is the seller open to a 13% concession, seller financing, or rate buy-down credit?
- What does the HOA fee cover, when was the last increase, and are there any pending special assessments or reserve-fund shortfalls?
- Any open or pending special assessments — roof, HVAC, plumbing, elevator, façade? What's the per-unit balance and payoff schedule, and is the seller paying it off at close or rolling it to the buyer?
- Why hasn't it sold? Are there any deal-killer items the seller is aware of (foundation, flood, title, zoning, code violations)?
- Is there a deadline driving the sale (1031 exchange, divorce, estate, relocation)? That informs how much negotiation room exists.
- Crime grade is F in this area — have there been break-ins, vandalism, or insurance claims at this property in the last 3 years? What carrier currently insures it and at what premium?
- The area grade is low — what's the realistic commute time and amenity access for the typical tenant pool here? Any planned neighborhood developments (good or bad) we should know about?
- What's the average days-on-market for RENTAL listings here right now (not sales)? A rising rental-DOM trend means longer vacancies and softer asking-rent achievability than the comps imply.
- What's the recent tenant-quality profile in this submarket — average credit score on applications, eviction rate, late-payment / NSF rate, and stable-employment percentage? A property-management company in the area should have these aggregated.
- How much new apartment / multifamily construction is in the pipeline within 1–3 miles? Heavy new supply (>2% of stock underway) typically softens rents 12–24 months out; light construction supports rent growth.
Investment metrics
- 1% rule
- 0.89% ✗
- Cap rate
- 5.44%
- Cash-on-cash
- -3.06%
- DSCR
- 0.86
- GRM
- 9.3
CMA / ARV
- ARV (median comp)
- $330,827
- List price
- $230,000
- Delta
- -30.48%
- Verdict
- UNDERPRICED
- Comps
- 20 within 1.0 mi
Projected returns pro-forma
-3.0% appreciation · 0.0% rent growth · sell at horizon
- IRR
- -25.2%
- Equity multiple
- 0.17×
- Total profit
- $-53,577
- Equity at exit
- $34,294
- IRR
- -36.8%
- Equity multiple
- -0.28×
- Total profit
- $-82,728
- Equity at exit
- $19,886
Cash invested: $64,400 (down + closing). Projections, not guarantees.
Landlord ↔ Tenant lean methodology
- Overall (STATE)
- 87 Strongly Landlord-Friendly
- State Florida
- 87 Strongly Landlord-Friendly · R+3
- County
- — inherits STATE
- City
- — inherits STATE
ZIP-level market 34471
- Rents YoY
- -0.6%
- Active inventory
- 318
- Price-to-rent
- 9.3×
Monthly cashflow live
- Estimated rent
- $2,052 high interval (Pro) →
- Mortgage (P&I)
- −$1,206
- Tax from tax record
- −$283 /mo · $3,395/yr
- Insurance
- −$96
- HOA
- −$200
- Vacancy / Maint / Mgmt
- −$431
- Net cashflow
- $-164
Break-even live
Sensitivity live
| Price | -10% $-34 | -5% $-99 | +0% $-164 | +5% $-229 | +10% $-294 |
|---|---|---|---|---|---|
| Rent | -10% $-326 | -5% $-245 | +0% $-164 | +5% $-83 | +10% $-2 |
| Rate | -1.0pp $-48 | -0.5pp $-106 | base $-164 | +0.5pp $-224 | +1.0pp $-284 |
UW: 25.0% down · 7.5% · 30yr · 1.5% tax · 5.0% vac · 8.0% maint · 8.0% mgmt
Financing live
Cash to close
- Down payment
- $57,500
- Closing costs
- $6,900
- Reserves months
- —
- Total cash needed
- —
Loan-product check · same deal, 3 products live
Conventional
25% down · 7.5% · 30yr
- Down + closing
- —
- Monthly P&I
- —
- Monthly cashflow
- —
- DSCR
- —
- Eligible?
- —
Personal DTI + credit; lowest rate.
DSCR
20% down · 8.5% · 30yr
- Down + closing
- —
- Monthly P&I
- —
- Monthly cashflow
- —
- DSCR
- —
- Eligible?
- —
No personal income docs; deal must DSCR.
Hard money
10% down · 12.0% · 12mo
- Down + closing
- —
- Monthly P&I
- —
- Monthly cashflow
- —
- DSCR
- —
- Eligible?
- —
Short-term bridge; refi at stabilization.
Rent comps 12 comps
| Address | Beds | Baths | Sqft | Rent | $/sqft | DOM | Units | Dist |
|---|---|---|---|---|---|---|---|---|
| 1311 SE 39th Ct Ocala, FL | 3.0 | 2.0 | 2121 | $2,500 | $1.18 | 15d | 1 | 0.58mi |
| 1231 SE 40th Ct Ocala, FL | 3.0 | 2.0 | 2220 | $2,500 | $1.13 | 15d | 1 | 0.70mi |
| 4549 SE 25th Loop Ocala, FL | 3.0 | 2.0 | 1490 | $1,850 | $1.24 | 23d | 1 | 0.87mi |
| 2936 SE 13th St Ocala, FL | 3.0 | 2.0 | 1285 | $1,700 | $1.32 | 15d | 1 | 0.89mi |
| 3339 SE 37th Avenue Rd Ocala, FL | 3.0 | 2.5 | 1828 | $1,900 | $1.04 | 15d | 1 | 0.92mi |
| 3488 SE 37th Avenue Rd Ocala, FL | 3.0 | 2.5 | 1708 | $1,800 | $1.05 | 23d | 1 | 0.98mi |
| 4505 SE 12th Pl Ocala, FL | 3.0 | 2.0 | 1551 | $1,750 | $1.13 | 23d | 1 | 0.98mi |
| 3663 SE 37th Avenue Rd Ocala, FL | 3.0 | 2.5 | 1707 | $1,825 | $1.07 | 23d | 1 | 1.10mi |
| 3674 SE 37th Ct Ocala, FL | 3.0 | 2.5 | 1708 | $1,800 | $1.05 | 15d | 1 | 1.11mi |
| 3700 SE 34th Ct Ocala, FL | 3.0 | 2.0 | 1508 | $2,050 | $1.36 | 23d | 1 | 1.15mi |
| 2700 SE 35th St Ocala, FL | 3.0 | 2.0 | 1977 | $2,500 | $1.26 | 23d | 1 | 1.37mi |
| 1906 SE Clatter Bridge Rd Ocala, FL | 3.0 | 2.5 | 2176 | $2,400 | $1.10 | 23d | 1 | 1.43mi |
HOA detail condo
- Monthly dues
- $200 · $2,400/yr
- Assessments
- None detected in remarks — confirm with the listing agent.
Listing history 28 events
-
2026-06-21days on market $230,000 Active 74 DOM
-
2026-06-18days on market $230,000 Active 71 DOM
-
2026-06-17days on market $230,000 Active 70 DOM
-
2026-06-16days on market $230,000 Active 69 DOM
-
2026-06-15days on market $230,000 Active 68 DOM
-
2026-06-14days on market $230,000 Active 66 DOM
-
2026-06-13days on market $230,000 Active 65 DOM
-
2026-06-10days on market $230,000 Active 63 DOM
-
2026-06-09days on market $230,000 Active 62 DOM
-
2026-06-08days on market $230,000 Active 61 DOM
-
2026-06-07days on market $230,000 Active 60 DOM
-
2026-06-03days on market $230,000 Active 56 DOM
-
2026-06-02days on market $230,000 Active 55 DOM
-
2026-06-01days on market $230,000 Active 54 DOM
-
2026-05-31days on market $230,000 Active 53 DOM
-
2026-05-30days on market $230,000 Active 52 DOM
-
2026-05-11price $230,000 1097-char remark
Show marketing remark (1097 chars)
Welcome to 2050 SE 37th Ct Cir, a well-positioned home in SE Ocala offering a balance of convenience and everyday comfort. Located just minutes from shopping, dining, and downtown Ocala, this property provides easy access to the amenities that make daily life more enjoyable. Inside, the home features a bright and functional layout with generous living spaces and a natural flow between rooms. Large windows bring in abundant light, creating an inviting atmosphere throughout. The floor plan offers flexibility for a variety of living arrangements and uses. The outdoor space provides additional room to enjoy the Florida lifestyle, whether for relaxing, entertaining, or simply unwinding at the end of the day. A notable feature of this property is its placement on an emergency power grid, offering added reliability during outages and peace of mind year-round along with the 6 year old roof and air conditioner with plenty of durability for years to come! With its convenient location and practical features, this home presents a great opportunity in one of Ocala’s established areas.
-
2026-04-08$235,000 Active 1097-char remark
Show marketing remark (1097 chars)
Welcome to 2050 SE 37th Ct Cir, a well-positioned home in SE Ocala offering a balance of convenience and everyday comfort. Located just minutes from shopping, dining, and downtown Ocala, this property provides easy access to the amenities that make daily life more enjoyable. Inside, the home features a bright and functional layout with generous living spaces and a natural flow between rooms. Large windows bring in abundant light, creating an inviting atmosphere throughout. The floor plan offers flexibility for a variety of living arrangements and uses. The outdoor space provides additional room to enjoy the Florida lifestyle, whether for relaxing, entertaining, or simply unwinding at the end of the day. A notable feature of this property is its placement on an emergency power grid, offering added reliability during outages and peace of mind year-round along with the 6 year old roof and air conditioner with plenty of durability for years to come! With its convenient location and practical features, this home presents a great opportunity in one of Ocala’s established areas.
-
2020-08-03soldstatus $157,300
-
2020-07-31soldstatus $157,250 377-char remark
Show marketing remark (377 chars)
LARGE 3/2.5 TOWNHOME IN CRESTWOOD VILLAGE WITH MASTER DOWNSTAIRS. LIV RM/DIN RM W/ FIREPLACE, NICE KIT WITH NEWER STOVE & REFRIG, CORIAN COUNTERS. 2 BEDRMS WITH JACK & JILL BATH UPSTAIRS & A LOFT AREA. ABUNDANCE OF STORAGE & CLOSET SPACE; PANTRY, STORAGE CLOSET, 2 CLOSETS IN MASTER, BOTH GUEST BEDRMS HAVE WALK-INS. LARGE SCREENED & WALLED PATIO.
-
2020-01-22$166,500 377-char remark
Show marketing remark (377 chars)
LARGE 3/2.5 TOWNHOME IN CRESTWOOD VILLAGE WITH MASTER DOWNSTAIRS. LIV RM/DIN RM W/ FIREPLACE, NICE KIT WITH NEWER STOVE & REFRIG, CORIAN COUNTERS. 2 BEDRMS WITH JACK & JILL BATH UPSTAIRS & A LOFT AREA. ABUNDANCE OF STORAGE & CLOSET SPACE; PANTRY, STORAGE CLOSET, 2 CLOSETS IN MASTER, BOTH GUEST BEDRMS HAVE WALK-INS. LARGE SCREENED & WALLED PATIO.
-
2017-05-05soldstatus $162,900
-
2017-05-05soldstatus $162,900
-
2017-03-13$162,900
-
2017-03-12historical
-
2016-09-12$162,000
-
1999-05-10soldstatus $118,000
-
1990-01-01soldstatus $100,400
ⓘ Source: listings_history table (triggers on properties + properties_extension) + one-shot
backfill from property_details.listing_events for pre-trigger history.
Tax reassessment forecast FL · Resets to sale price
- Current annual tax
- $3,395 · $283/mo
- Projected year-2 tax
- $3,395 · $283/mo
- Expected delta
- $0/yr ($0/mo · 0.0%)
ⓘ Screening estimate from a state-policy table — verify with the county assessor before closing.
Climate risk First Street
- Flood 5/10 Major FEMA zone X (shaded) · 24% chance over 30 yrs
- Wildfire 2/10 Low
- Heat 8/10 Severe 7 d/yr ≥108°F today · 21 d/yr by 30 yrs out
- Wind 9/10 Extreme 99% chance of damaging wind over 30 yrs
- Air quality 4/10 Moderate 5 unhealthy d/yr today · 5 by 30 yrs out
Nearby sold comps map
Loading sold comps map…
Walkable amenities ~0.75 mi
Loading nearby amenities…
Taxation est. · year 1
- Rental income
- $24,621
- − Mortgage interest
- −$12,884
- − Property taxes
- −$3,395
- − Insurance
- −$1,150
- − Repairs & maintenance
- −$1,970
- − Management
- −$1,970
- − HOA
- −$2,400
- − Depreciation
- −$6,691
- Taxable loss
- −$5,838
- Est. tax savings @ 24.0%
- +$1,401
- After-tax cash flow
- $-567/yr
For passive investors: Depreciation is non-cash, so a rental often shows a tax loss while cash-flowing — sheltering income. Rental losses are passive: they offset passive income freely, and up to $25,000/yr can offset ordinary (W-2) income if you actively participate and your MAGI is under $100k (phasing out to $0 by $150k); unused losses carry forward. On sale, claimed depreciation is recaptured at up to 25%, and gains may owe capital-gains tax (a 1031 exchange can defer both). Figures are a year-1 estimate at your 24.0% rate — not tax advice; consult a CPA.
Schools (NCES district)
- District
- Marion
- NCES district ID
- 1201260
- Math proficiency
- 42% ▼ -7.00%
- Reading proficiency
- 43% ▼ -4.00%
- Median HH income
- $40,015
- Composite
- 35.61/100
- National rank
- #4890
- State rank
- #61 of 73 in FL
Livability — Ocala
- Score
- 69/100
- State rank
- #476
- US rank
- #8461
Category grades
Schools grade is shown separately in the Schools card above.
Census & demographics
- Census place
- Ocala, FL
- County
- Marion County · 315,796 people
- City population
- 263,375
- Metro
- Ocala, FL
- Population (ZIP)
- 28,342
- Household income
- $65,789
- Rent vs Own
- Severe rent burden
- 1494.0
Population outlook (Marion County) Hauer SSP2
- Today (2025)
- 365,905 people
- By 2030
- 376,768 · +3.0%
- By 2040
- 396,555 · +8.4%
- By 2050
- 412,723 · +12.8%
- By 2075
- 446,090 · +21.9%
- By 2100
- 436,193 · +19.2%
Race, ethnicity, and origin ACS 2023
- Neighborhood character
- Predominantly White (67%)
- Race & ethnicity
- White 67% Hispanic / Latino 16% Two or more races 11% Black 10% Asian 3%
- Hispanic origin (detail)
- Mexican 2% Puerto Rican 6% Cuban 3% Dominican 1%
- Common ancestry
- Slovak 3% Italian 2% Lithuanian 2%
- Foreign-born
- 9% · Canada, Jamaica, Dominican Republic
- Languages at home
- 86% English-only · Spanish 11% Other Asian/Pacific 1%
Political lean MEDSL · Marion
- 2024 margin
- Solid R (+31.6) · D 33.8% · R 65.5%
- 2008→2024 swing
- -20.0pp toward R · 2008: -11.6pp · 2024: -31.6pp
- All cycles
- 2024: R+31.6 2020: R+25.9 2016: R+26.2 2012: R+16.2 2008: R+11.6
Not yet ingested
- Civics
- —
Market trends
- HPI YoY
- ▼ -176.55%
- Current HPI
- 224.1709
- Rent YoY
- ▼ -0.64%
- Metro
- Ocala, FL
- State GDP YoY
- ▲ 3.28%
- F500 in state
- 36
Industry mix (Fortune 500 HQ in FL)
| Industry | F500 HQs | Revenue |
|---|---|---|
| Industrial Technology | 2 | $29B |
|
||
| Insurance | 2 | $17B |
|
||
| Retail | 1 | $60B |
|
||
| Technology Distribution | 1 | $58B |
|
||
| Homebuilding | 1 | $35B |
|
||
| Technology Manufacturing | 1 | $35B |
|
||
Price history
+129.1% since first listed12 events — show timeline
- 2026-05-11 Price Changed $230,000 Stellar MLS as Distributed by MLS Grid
- 2026-04-08 Listed $235,000 Stellar MLS as Distributed by MLS Grid
- 2020-08-03 Sold (Public Records) $157,300 Public Records
- 2020-07-31 Sold (MLS) $157,250 Stellar MLS as Distributed by MLS Grid
- 2020-01-22 Listed $166,500 Stellar MLS as Distributed by MLS Grid
- 2017-05-05 Sold (Public Records) $162,900 Public Records
- 2017-05-05 Sold (MLS) $162,900 Stellar MLS as Distributed by MLS Grid
- 2017-03-13 Listed $162,900 Stellar MLS as Distributed by MLS Grid
- 2017-03-12 Listing Removed — Stellar MLS as Distributed by MLS Grid
- 2016-09-12 Listed $162,000 Stellar MLS as Distributed by MLS Grid
- 1999-05-10 Sold (Public Records) $118,000 Public Records
- 1990-01-01 Sold (Public Records) $100,400 Public Records
Property tax history
+11.8%/yrLatest (2025): $3,395 · +1.6% YoY. Source: county tax records.
Cash-flow waterfall
monthlySold comps — $/sqft
last 12 mo · ≤1 miLoading sold comps…