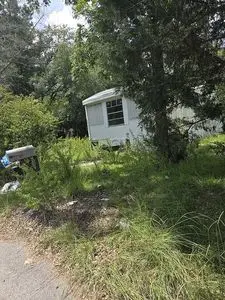
1342 Cromer Ave · North, SC
Flood risk 1/10 · Minimal
- FEMA flood zone
- X (unshaded)
- Chance of flooding over 30 yrs
- 0.0%
- Est. flood insurance / yr
- $507 – $1,088
Fire risk 5/10 · Moderate
- Est. fire insurance / yr
- $783 – $1,453
Heat risk 7/10 · Major
- Hot days now (above 108°F)
- 7 days/yr
- Hot days in 30 yrs
- 17 days/yr
Wind risk 8/10 · Major
- Chance of severe wind over 30 yrs
- 80.0%
Air-quality risk 3/10 · Minor
- Unhealthy air days now
- 3 days/yr
- Unhealthy air days in 30 yrs
- 3 days/yr
Risk factors via First Street. Map © Google.
Why this score? — see what drove the A- grade
The composite is a weighted blend of 9 inputs, each scored 0–100. Each bar is that input's sub-score; the figure is the points it added to the 100-point composite (weight × sub-score).
- Cash flow +30.0/30.0
- 1% rule +10.0/10.0
- DSCR +10.0/10.0
- Appreciation +10.0/10.0
- ARV discount +7.5/15.0
- Schools +5.0/10.0
- Livability +2.9/5.0
- Rent growth +2.5/5.0
- Condition / age +2.5/5.0
$25,000
🖨 Deal sheet 📄 Offer letter ✓ Due diligence
Listing remarks
2bed 2bath mobile home, utility are on. Tennant in place. Just under a half acre with septic already installed and connected to home. City water connected and active. Home land package deal.
Key facts
- Septic installed
- City water connected
- Built 1981
Tags
Neighborhood map
What this means for you Summary
Snapshot
- This is a 2-bed/2.0-bath manufactured listed at $25k.
Deal economics
- At list price, monthly cash flow is $558 ($7k/yr) — positive.
- The deal already cash-flows at list — no discount required.
- Meets the 1% rule at list price ($926 rent vs $25k).
- Recommended offer: $25k (1.5% below list) — sets the bar for market timing.
Location & tenants
- Location reads 57/100 on livability (#280 in SC) — a working-class tenant base; expect higher turnover. Strengths: cost of living A+, housing B; Watch: schools F, amenities F, commute F.
- Market conditions: 33 active listings in the ZIP; 87 units permitted in Orangeburg County in 2024 (0 in 5+ unit buildings).
Forward outlook
- In year one you build about $3k of equity ($173 loan paydown + $2k appreciation (10.0% local appreciation)).
- Orangeburg County population projected at -27% by 2050 — secular population decline; favor cash flow + early exit over multi-decade hold.
- At projected returns (10.0% appreciation + 3.0% rent growth), your $7k cash investment doubles in ~1 year — after that, you're playing with house money.
- By year 10, paydown + projected appreciation supports a ~$32k cash-out refi (75% LTV) — recoverable capital for the next deal without selling this one.
Negotiation context
- It's been on market 24 days — a 2% lower offer ($25k) is reasonable based on typical stale-listing flexibility.
Risks & watch-outs
- Climate carrying-cost: severe wind risk, 80% chance of damaging wind over 30y; moderate wildfire risk; extreme-heat days projected 7→17/yr by 2055 (HVAC capex compounding) — expect insurance premiums to compound above CPI over the hold.
Questions for the listing agent
- Is there a deadline driving the sale (1031 exchange, divorce, estate, relocation)? That informs how much negotiation room exists.
- Schools are F-rated, which usually means shorter tenancies and higher turnover. Who's the typical renter profile here, and what's been the actual vacancy rate?
- What's the average days-on-market for RENTAL listings here right now (not sales)? A rising rental-DOM trend means longer vacancies and softer asking-rent achievability than the comps imply.
- What's the recent tenant-quality profile in this submarket — average credit score on applications, eviction rate, late-payment / NSF rate, and stable-employment percentage? A property-management company in the area should have these aggregated.
- How much new for-sale + rental construction is in the pipeline within 1–3 miles? Heavy new supply typically softens prices + rents 12–24 months out; constrained supply supports both.
Investment metrics
- 1% rule
- 3.70% ✓
- Cap rate
- 33.10%
- Cash-on-cash
- 95.73%
- DSCR
- 5.26
- GRM
- 2.3
CMA / ARV
No comps found within radius.
Projected returns pro-forma
10.0% appreciation · 3.0% rent growth · sell at horizon
- IRR
- —
- Equity multiple
- 8.03×
- Total profit
- $49,195
- Equity at exit
- $22,522
- IRR
- 99.9%
- Equity multiple
- 17.70×
- Total profit
- $116,931
- Equity at exit
- $48,570
Cash invested: $7,000 (down + closing). Projections, not guarantees.
Landlord ↔ Tenant lean methodology
- Overall (STATE)
- 90 Strongly Landlord-Friendly
- State South Carolina
- 90 Strongly Landlord-Friendly · R+6
- County
- — inherits STATE
- City
- — inherits STATE
ZIP-level market 29112
- Home prices YoY
- 11.7%
- Active inventory
- 33
- Price-to-rent
- 2.3×
Monthly cashflow live
- Estimated rent
- $926 medium interval (Pro) →
- Mortgage (P&I)
- −$131
- Tax est. 1.5%
- −$31 /mo · $375/yr
- Insurance
- −$10
- HOA
- −$0
- Vacancy / Maint / Mgmt
- −$194
- Net cashflow
- $558
Break-even live
UW: 25.0% down · 7.5% · 30yr · 1.5% tax · 5.0% vac · 8.0% maint · 8.0% mgmt
Financing live
Cash to close
- Down payment
- $6,250
- Closing costs
- $750
- Reserves months
- —
- Total cash needed
- —
Loan-product check · same deal, 3 products live
Conventional
25% down · 7.5% · 30yr
- Down + closing
- —
- Monthly P&I
- —
- Monthly cashflow
- —
- DSCR
- —
- Eligible?
- —
Personal DTI + credit; lowest rate.
DSCR
20% down · 8.5% · 30yr
- Down + closing
- —
- Monthly P&I
- —
- Monthly cashflow
- —
- DSCR
- —
- Eligible?
- —
No personal income docs; deal must DSCR.
Hard money
10% down · 12.0% · 12mo
- Down + closing
- —
- Monthly P&I
- —
- Monthly cashflow
- —
- DSCR
- —
- Eligible?
- —
Short-term bridge; refi at stabilization.
Listing history 17 events
-
2026-06-19days on market $25,000 Active 24 DOM
-
2026-06-18days on market $25,000 Active 23 DOM
-
2026-06-17days on market $25,000 Active 22 DOM
-
2026-06-16days on market $25,000 Active 21 DOM
-
2026-06-15days on market $25,000 Active 20 DOM
-
2026-06-14days on market $25,000 Active 18 DOM
-
2026-06-12days on market $25,000 Active 17 DOM
-
2026-06-09days on market $25,000 Active 14 DOM
-
2026-06-08days on market $25,000 Active 13 DOM
-
2026-06-07days on market $25,000 Active 12 DOM
-
2026-06-07days on market $25,000 Active 11 DOM
-
2026-06-04days on market $25,000 Active 8 DOM
-
2026-06-02days on market $25,000 Active 7 DOM
-
2026-06-01days on market $25,000 Active 6 DOM
-
2026-05-31days on market $25,000 Active 5 DOM
-
2026-05-31days on market $25,000 Active 4 DOM
-
2026-05-26$25,000 Active
ⓘ Source: listings_history table (triggers on properties + properties_extension) + one-shot
backfill from property_details.listing_events for pre-trigger history.
Climate risk First Street
- Flood 1/10 Low FEMA zone X (unshaded) · 0% chance over 30 yrs
- Wildfire 5/10 Major
- Heat 7/10 Severe 7 d/yr ≥108°F today · 17 d/yr by 30 yrs out
- Wind 8/10 Severe 80% chance of damaging wind over 30 yrs
- Air quality 3/10 Moderate 3 unhealthy d/yr today · 3 by 30 yrs out
Nearby sold comps map
Loading sold comps map…
Walkable amenities ~0.75 mi
Loading nearby amenities…
Taxation est. · year 1
- Rental income
- $11,107
- − Mortgage interest
- −$1,400
- − Property taxes
- −$375
- − Insurance
- −$125
- − Repairs & maintenance
- −$889
- − Management
- −$889
- − Depreciation
- −$727
- Taxable income
- $6,702
- Est. tax owed @ 24.0%
- −$1,608
- After-tax cash flow
- $5,093/yr
For passive investors: Depreciation is non-cash, so a rental often shows a tax loss while cash-flowing — sheltering income. Rental losses are passive: they offset passive income freely, and up to $25,000/yr can offset ordinary (W-2) income if you actively participate and your MAGI is under $100k (phasing out to $0 by $150k); unused losses carry forward. On sale, claimed depreciation is recaptured at up to 25%, and gains may owe capital-gains tax (a 1031 exchange can defer both). Figures are a year-1 estimate at your 24.0% rate — not tax advice; consult a CPA.
Schools (NCES district)
No district data.
Livability — North
- Score
- 57/100
- State rank
- #280
- US rank
- #21976
Category grades
Schools grade is shown separately in the Schools card above.
Census & demographics
- Population (ZIP)
- 3,718
Population outlook (Orangeburg County) Hauer SSP2
- Today (2025)
- 82,698 people
- By 2030
- 78,615 · -4.9%
- By 2040
- 69,308 · -16.2%
- By 2050
- 60,629 · -26.7%
- By 2075
- 42,678 · -48.4%
- By 2100
- 28,136 · -66.0%
Race, ethnicity, and origin ACS 2023
- Neighborhood character
- Majority White (50%)
- Race & ethnicity
- White 50% Black 45% Two or more races 3% Hispanic / Latino 1% Native American 1%
- Common ancestry
- Lithuanian 2%
- Foreign-born
- 0%
- Languages at home
- 97% English-only · Spanish 2% Arabic 1%
Political lean MEDSL · Orangeburg
- 2024 margin
- Strong D (+24.6) · D 61.8% · R 37.2% · Other 1.1%
- 2008→2024 swing
- -13.5pp toward R · 2008: 38.1pp · 2024: 24.6pp
- All cycles
- 2024: D+24.6 2020: D+33.2 2016: D+37.0 2012: D+43.5 2008: D+38.1
Not yet ingested
- Civics
- —
Market trends
- HPI YoY
- ▲ 24.57%
- Current HPI
- 234.04
- Rent YoY
- —
- Metro
- —
- State GDP YoY
- ▲ 4.51%
- F500 in state
- 2
Industry mix (Fortune 500 HQ in SC)
| Industry | F500 HQs | Revenue |
|---|---|---|
| Packaging | 1 | $7B |
|
||
Price history
1 event — show timeline
- 2026-05-26 Listed $25,000 FSBO.com
Property tax history
+5.8%/yrLatest (2024): $33 · +13.3% YoY. Source: county tax records.
Cash-flow waterfall
monthlySold comps — $/sqft
last 12 mo · ≤1 miLoading sold comps…